- •Examination questions for discipline Microeconomics
- •Production Efficiency
- •The ppf and Marginal Cost
- •Markets and Prices
- •The law of demand
- •The Factors that Influence the Elasticity of Supply
- •New Ways of Explaining Consumer Choices
- •Consumption Possibilities
- •Work-Leisure Choices
- •The Firm and Its Economic Problem
- •Markets and the Competitive Environment
- •Product Curves
- •Short-Run Cost
- •Marginal Cost and Average Costs
- •Marginal Cost and Average Costs
- •The Long-Run Average Cost Curve
- •Perfect competition
- •What is Perfect Competition?
- •The Firm’s Output Decision
- •Output, Price, and Profit in the Short Run
- •Price Discrimination
- •Marginal Revenue and Elasticity
- •63. Single-Price Monopoly and Competition Compared
- •Monopoly Regulation
- •Monopolistic Competition and Perfect Competition comparison
- •What is Oligopoly?
- •Two Traditional Oligopoly Models
- •Oligopoly Games: An Oligopoly Price-Fixing Game
- •Antitrust Law
- •Classifying Goods and Resources
- •Public Goods
- •Common Resources
- •The Anatomy of Factor Markets
- •The Demand for a Factor of Production
- •Capital and Natural Resource Markets
- •Nonrenewable Natural Resource Markets
- •Property Rights and the Coase Theorem
- •Achieving an Efficient Outcome
The Long-Run Average Cost Curve
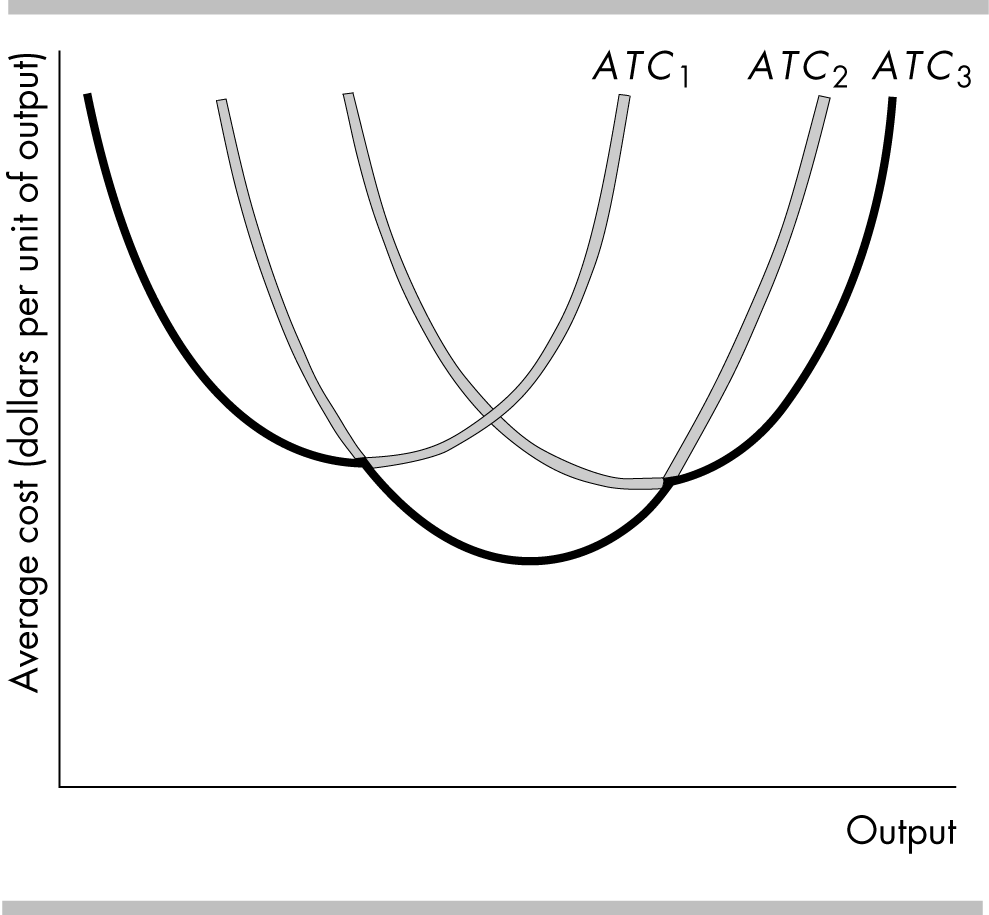
The long-run average cost curve, LRAC, is the relationship between the lowest attainable average total cost and output when both the plant size and labor are varied. This curve is derived from the short-run average total cost curves. It shows the lowest average total cost to produce a given level of output. In the figure, the LRAC curve is the darkened parts of the three short-run ATC curves.
Production Function
The production function determines the behavior of long run costs.
A firm’s production function typically exhibits diminishing returns to capital as well as diminishing returns to labor. The marginal product of capital is the change in total product divided by the change in capital when the quantity of labor is held constant. Holding constant the quantity of employment, after some level of output the firm will have diminishing returns to capital—the marginal product of capital decreases as more capital is used.
S hort-Run
Cost and Long-Run Cost
In the long run, a firm can use different plant sizes. Each plant size has a different short-run ATC curve. Each short-run ATC curve is U-shaped and the larger the plant size, the greater is the output at which the average total cost is a minimum.
The figure illustrates three average total cost curves for three plant sizes. ATC1 pertains to the smallest plant size and ATC3 to the largest.
The Long-Run Average Cost Curve
The long-run average cost curve, LRAC, is the relationship between the lowest attainable average total cost and output when both the plant size and labor are varied. This curve is derived from the short-run average total cost curves. It shows the lowest average total cost to produce a given level of output. In the figure, the LRAC curve is the darkened parts of the three short-run ATC curves.
Economies and Diseconomies of Scale
Economies of scale are features of a firm’s technology that lead to falling long-run average cost as output increases. With given factor prices, economies of scale occur if the percentage increase in output exceeds the percentage increase in all factors of production. The long-run average cost curve slopes downward in this range of output. The main source of economies of scale is greater specialization of both labor and capital.
Constant returns to scale are features of a firm’s technology that lead to constant long-run average cost as output increases. With given factor prices, economies of scale occur if the percentage increase in output equals the percentage increase in all factors of production. The long run average cost curve is horizontal in this range of output.
Diseconomies of scale are features of a firm’s technology that lead to rising long-run average cost as output increases. With given factor prices, economies of scale occur if the percentage increase in output is less than the percentage increase in all factors of production. The long run average cost curve slopes upward in this range of output.
The minimum efficient scale is the smallest quantity of output at which the long-run average cost curve reaches its lowest level.
