

New Ways of Explaining Consumer Choices
Behavioral Economics
Behavioral economics studies the ways in which limits on the human brain’s ability to compute and implement rational decisions influences economic behavior—both the decisions that people make and the consequences of those decisions for the way markets work.
There are three impediments to rational choice: bounded rationality, bounded will-power, and bounded self-interest.
Bounded Rationality
Bounded rationality is rationality that is bounded by the computing power of the human brain. Faced with uncertainty, consumers cannot rationally make choices and instead rely on other decision-making methods such as rules of thumb, listening to the views of others, or gut instinct.
Bounded Will-Power
Bounded will-power is the less-than-perfect will-power that prevents us from making a decision that we know, at the time of implementing the decision, we will later regret.
Bounded Self-Interest
Bounded self-interest is the limited self-interest that sometimes results in suppressing our own interests to help others.
The Endowment Effect
The endowment effect is the tendency for people to value something more highly simply because they own it.
Neuroeconomics
Neuroeconomics is the study of the activity of the human brain when a person makes an economic decision. Different decisions appear to activate different areas of the brain. Some decisions are made in the pre-frontal cortex, which is where memories are stored and data analyzed. These decisions might be deemed rational. Other decisions are made in the hippocampus, which is where memories of anxiety and fear are stored. These decisions might be deemed irrational.
Controversy
Whether economics should focus on explaining the decisions we observe or on what goes on inside people’s heads is the source of controversy.
Consumption Possibilities
A household’s consumption choices are constrained by its income and the prices of the goods and services available. A household’s budget line describes the limits to its consumption choices.
T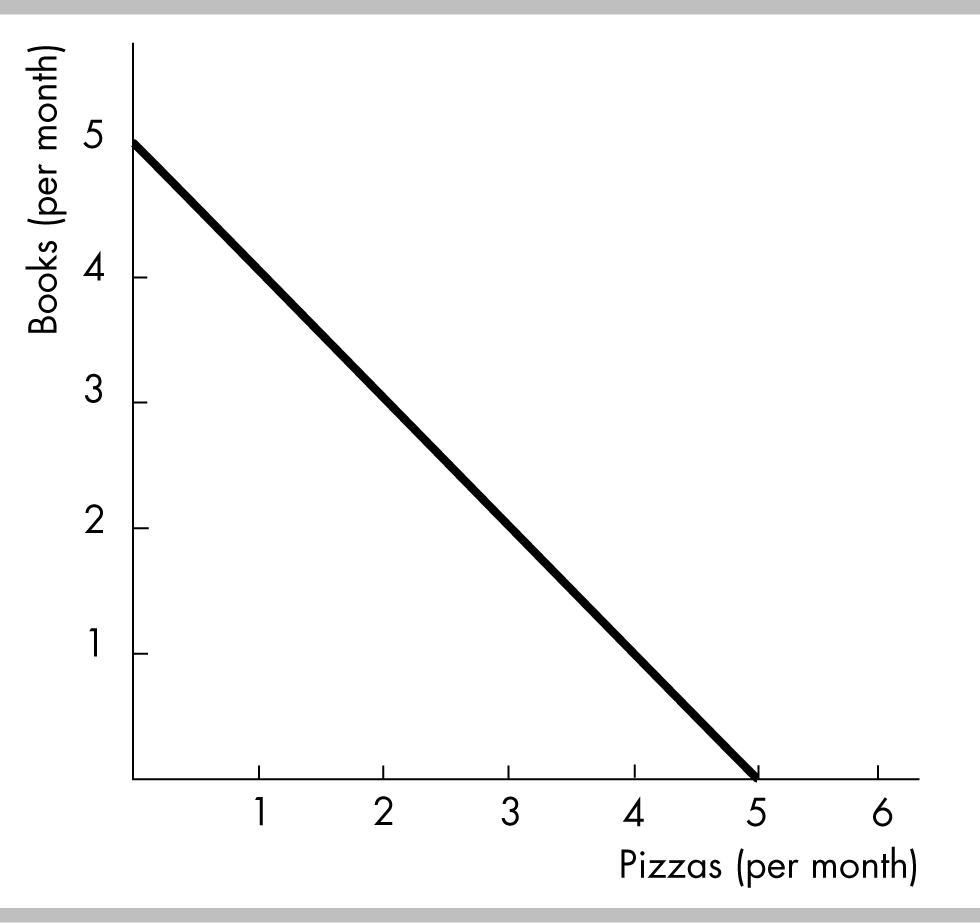 he
figure to the right shows a budget line for a household that buys
only pizzas and books. The household can buy any combination of pizza
and books that lies on or within the budget line. Combinations that
lie beyond the budget line are unaffordable.
he
figure to the right shows a budget line for a household that buys
only pizzas and books. The household can buy any combination of pizza
and books that lies on or within the budget line. Combinations that
lie beyond the budget line are unaffordable.
Budget Equation
We can describe the budget line by using a budget equation, which states that income equals expenditure.
Calling the price of a book PB, the quantity of books QB, the price of a pizza PP, the quantity of pizza QP, and income Y, we can write a budget equation as PB QB + PP QP = Y, which can be rearranged into slope-intercept form as QB = Y/PB (PP/PB) QP.
A household’s real income is the household’s income expressed as a quantity of goods the household can afford to buy. In the figure above, in terms of books, the household’s real income is Y/PB (5 books), which is the vertical intercept of the budget line.
A relative price is the price of one good divided by the price of another good. The magnitude of the slope of the budget line, (PP/PB), is the relative price of a pizza in terms of a book. A relative price is an opportunity cost, so the relative price of a pizza in terms of books gives the opportunity cost of a pizza in terms of books forgone.
When the price of the good measured along the horizontal axis (pizzas) changes, the budget line rotates around the vertical intercept. If the price of the good falls, the budget line rotates outward and becomes steeper; if the price of the good rises, the budget line rotates inward and becomes steeper.
When income changes, the budget line shifts and its slope does not change. If income increases, the budget line shifts outward; if income decreases, the budget line shifts inward.
Preferences and Indifference Curves
A preference map shows how a person ranks various combinations of goods and services.
I
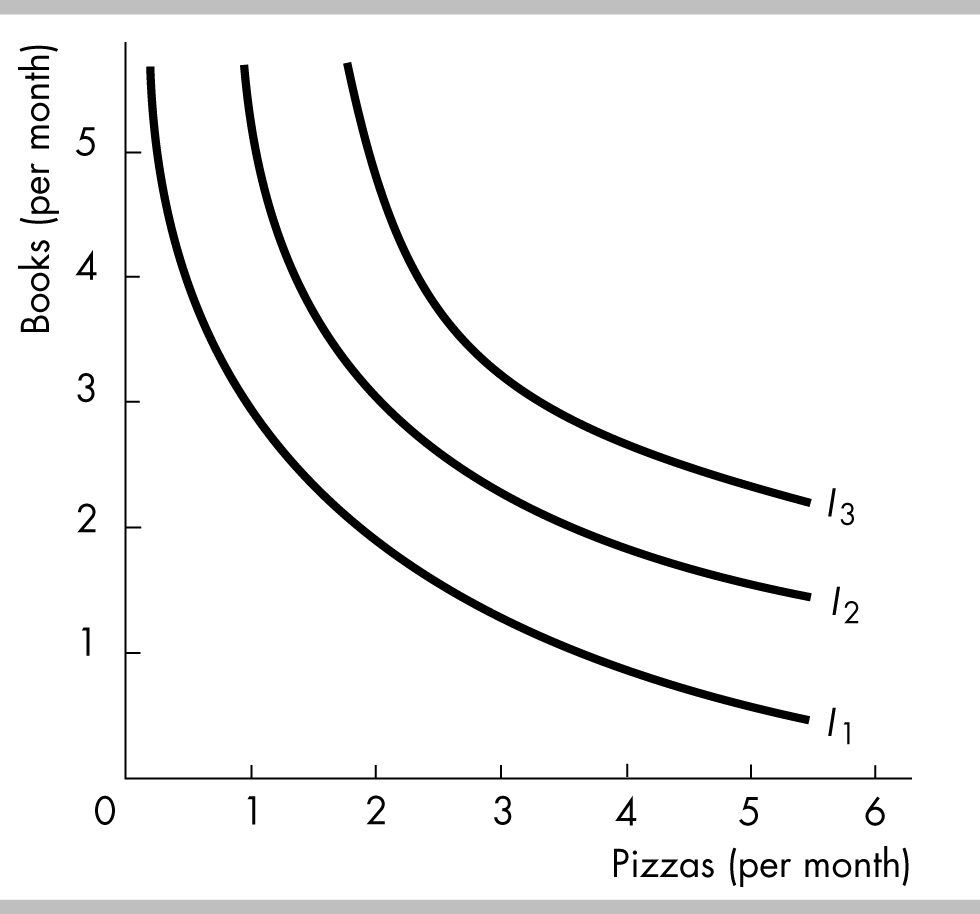 ndifference
curves are used to illustrate a person’s preference map. An
indifference
curve
is a line that shows combinations of goods among which a consumer is
indifferent.
The figure to the right shows three of a person’s indifference
curves between pizza and books.
ndifference
curves are used to illustrate a person’s preference map. An
indifference
curve
is a line that shows combinations of goods among which a consumer is
indifferent.
The figure to the right shows three of a person’s indifference
curves between pizza and books.
The consumer is indifferent among all the points on any particular indifference curve.
The consumer prefers points above any particular indifference curve to points on the curve. And the consumer prefers points on the indifference curve to points below the curve. In the figure, the consumer prefers any point on indifference curve I2 to any point on I1 and any point on I3 to any point on I2.
Marginal Rate of Substitution
The marginal rate of substitution (MRS) is the rate at which a person will give up good y (the good measured on the y-axis) to get an additional unit of good x (the good measured on the x-axis) and at the same time remaining indifferent (remaining on the same indifference curve).
The magnitude of the slope of the indifference curve at any point measures the marginal rate of substitution between the goods. If the indifference curve is steep, the MRS is high; if the indifference curve is flat, the MRS is small.
The diminishing marginal rate of substitution is the general tendency for a person to be willing to give up less of good y to get one unit of good x, and at the same time remain indifferent, as the quantity of x increases. This principle implies that indifference curves generally become flatter moving along them to the right.
Degree of Substitutability
The indifference curves between most goods are bowed in, with a diminishing MRS.
The indifference curves for perfect substitutes are linear, with a constant MRS.
The indifference curves for perfect complements are L-shaped. Utility increases (the consumer moves to a higher indifference curve) only if the quantity of both goods x and y increases.
Predicting Consumer Choices
B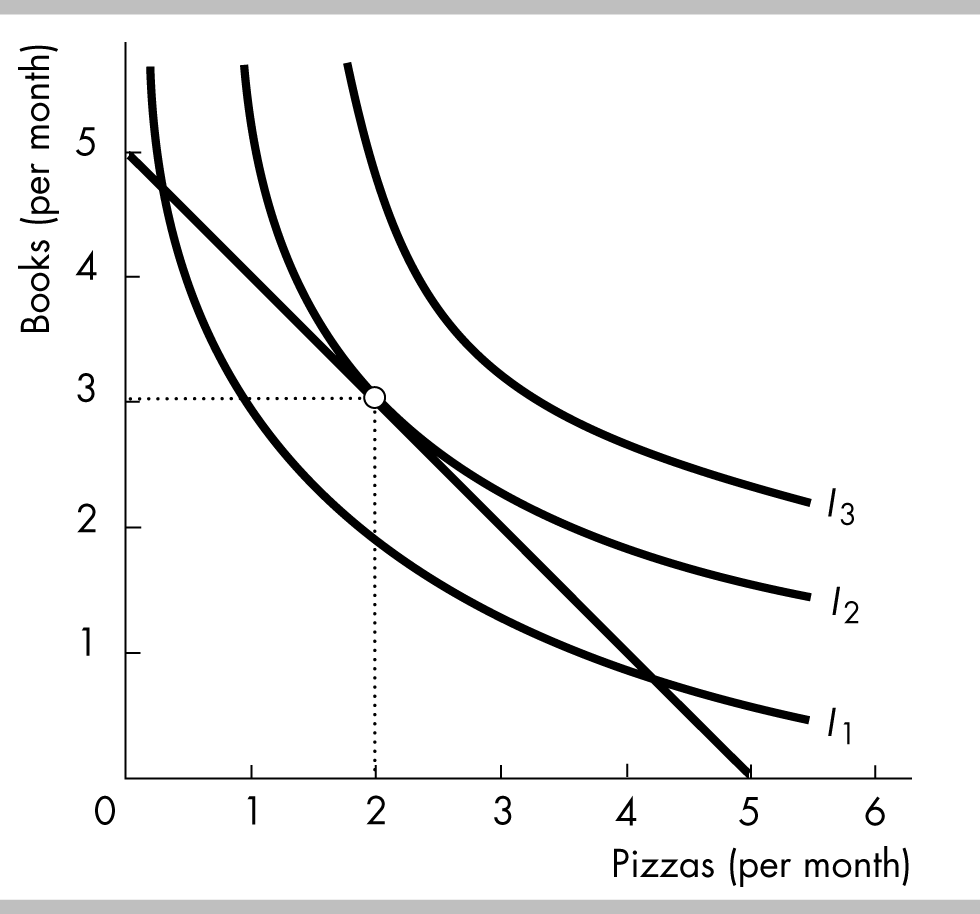 est
Affordable Choice
est
Affordable Choice
The consumer will select his or her best affordable point. This point:
is on the budget line,
is on the highest attainable indifference curve,
has a marginal rate of substitution between the two goods equal to the relative price of the two goods.
The figure shows the best affordable point, 2 pizzas and 3 books. This combination is on the budget, and hence is “affordable”. It also is on the highest indifference curve so that the marginal rate of substitution equals the relative price of the two goods, and hence the point is “best.”
A Change In Price
The price effect shows how a change in the price of a good affects the quantity of that good consumed.
When the price of the good on the x-axis falls, the budget line rotates around the y-axis intercept and becomes flatter. The person moves to a new consumption point. The new consumption bundle satisfies all three properties: It is on the new budget line, it is on the highest attainable indifference curve, and the MRS equals the slope of the new budget line.
When the price of a good changes, tracking the change in the quantity of the good consumed reveals the demand curve for that good.
Substitution Effect and Income Effect
For a normal good, a rise in price always decreases the quantity consumed. This result is shown by breaking the price effect into two parts, as illustrated in the figure in which the price of movies rises:
T
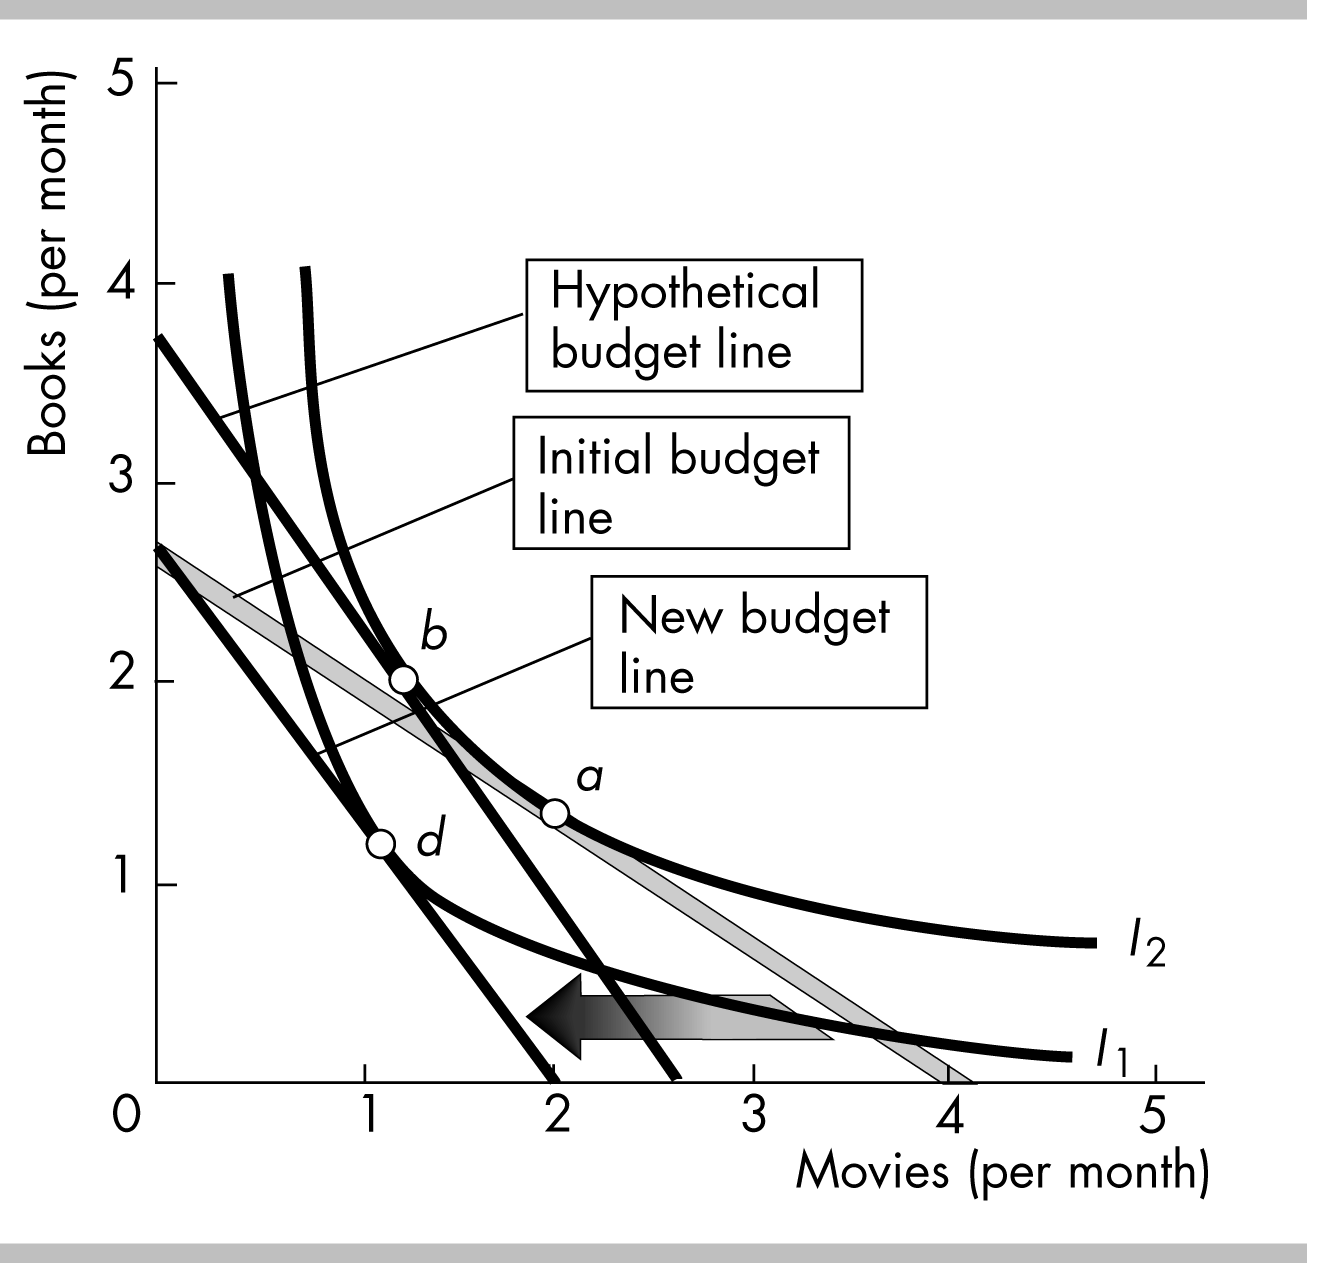 he
substitution
effect
is
the effect of a change in price on the quantity bought when the
consumer (hypothetically) remains indifferent between the original
situation and the new one. The substitution effect is showing by
moving the new budget line (with its new slope) so that it is
tangent to the initial indifference curve. This procedure creates a
(hypothetical) new best affordable point using the initial
indifference curve and the hypothetical budget line. Comparing the
initial best affordable point to this new one captures the
substitution effect. In the figure this compares point a
to point b.
The substitution effect of a rise in price always
leads
to a decrease in the quantity consumed.
he
substitution
effect
is
the effect of a change in price on the quantity bought when the
consumer (hypothetically) remains indifferent between the original
situation and the new one. The substitution effect is showing by
moving the new budget line (with its new slope) so that it is
tangent to the initial indifference curve. This procedure creates a
(hypothetical) new best affordable point using the initial
indifference curve and the hypothetical budget line. Comparing the
initial best affordable point to this new one captures the
substitution effect. In the figure this compares point a
to point b.
The substitution effect of a rise in price always
leads
to a decrease in the quantity consumed.
The income effect is the effect on the quantity bought of a change in income sufficient to shift the hypothetical budget line used to measure the substitution effect so that it is the same as the actual new budget line. This process is the movement from point b to point d in the figure. For a rise in price, this change requires a decrease in income. For a normal good, the decrease in income decreases the quantity consumed. So for a normal good, the substitution effect and the income effect reinforce each other: both demonstrate that the quantity consumed decreases.