

Output, Price, and Profit in the Short Run
The short-run market supply curve shows the quantity supplied by all the firms in the market at each price when each firm’s plant and number of firms remain the same. The quantity supplied in the industry at any price is the summation of all quantities supplied by each firm at that price, so the short-run industry supply curve is the horizontal summation of all the firms’ supply curves.
Changes in market demand influence the output and the entry or exit decisions made by firms. An increase in market demand shifts the demand curve rightward and raises the market price. Each firm in the industry responds by increasing its quantity supplied.
The higher price now exceeds each firm’s minimum ATC and the firms in the industry earn an economic profit. The figure illustrates a perfectly competitive firm earning an economic profit. The firm’s economic profit is equal to the area of the darkened rectangle.
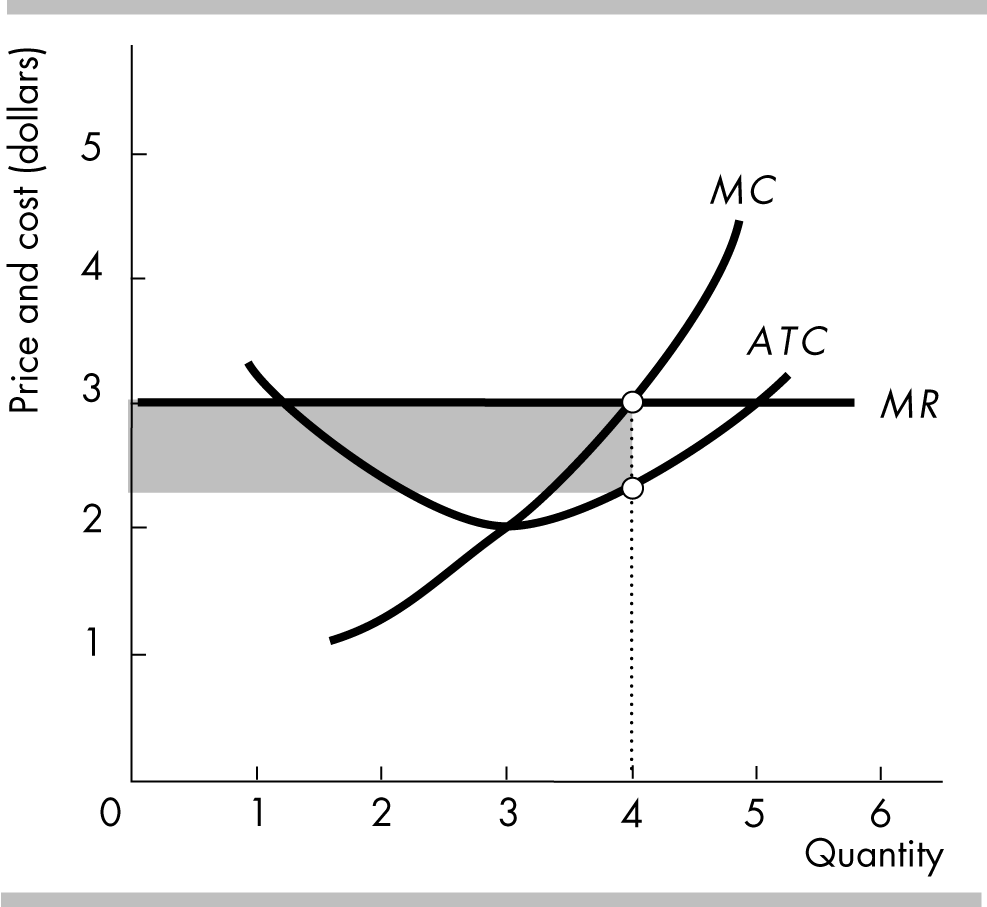
In the short run there are three possible profit outcomes—an economic profit, zero economic profit, and an economic loss.
If the price exceeds the ATC, the firm earns an economic profit (as illustrated in the figure).
If the price equals the ATC, the firm “breaks even” by earning zero economic profit. In this case, the firm earns a normal profit. At the profit maximizing level of output, q, the price, P, equals the ATC. If the price is less than the ATC, the firm incurs an economic loss.
Output, Price, and Profit in the Long Run
Economic profit motivates firms to enter the industry, thereby increasing the market supply.
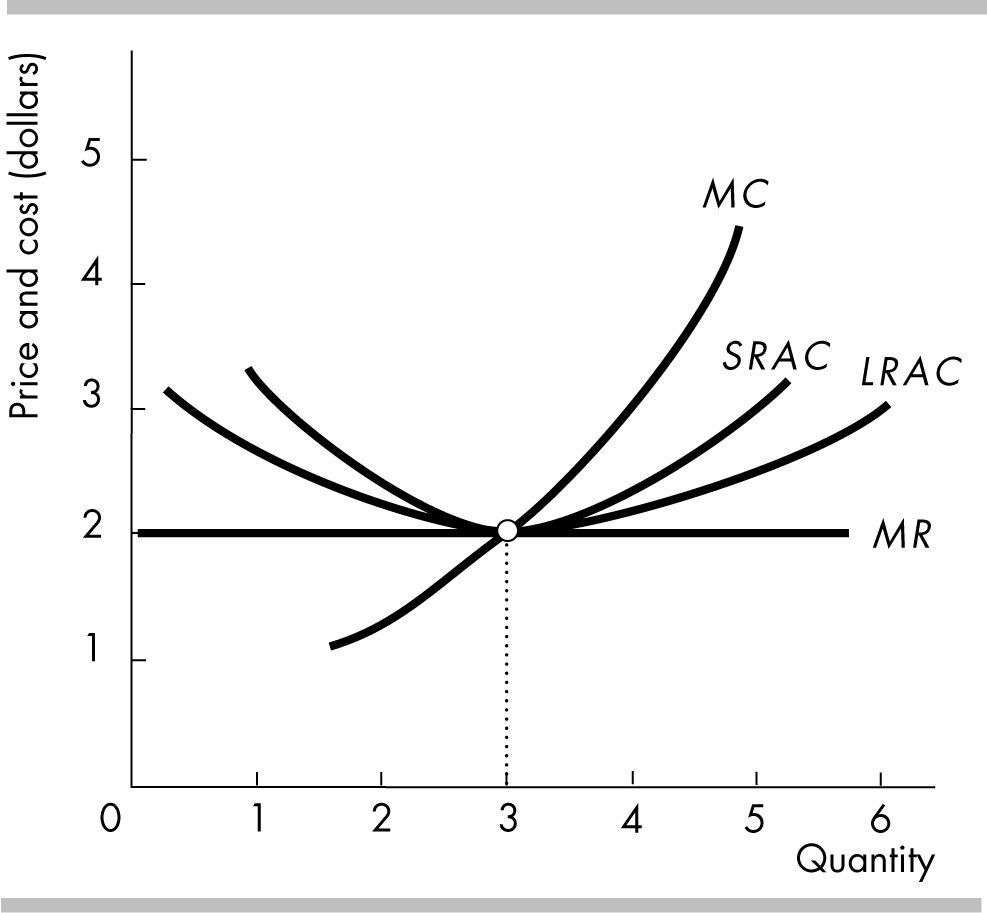
When the market supply curve shifts rightward, the market price falls. Eventually the price falls to equal the minimum ATC for each firm in the industry and firms have adjusted their plant size so they are producing at the minimum long-run average cost. At this price, firms in the industry no longer earn an economic profit and so firms no longer enter the industry. The figure illustrates this long-run equilibrium. In the figure, LRAC is the long-run average cost curve and SRAC is the short-run average cost curve.
One difference between the old and new market equilibriums is that the number of firms in the industry has risen and total quantity produced in the industry has increased.
The effects of a decrease in market demand are the opposite of those outlined above.
In the long run, competitive firms earn zero economic profit (price = average total cost).
Changing Tastes and Advancing Technology
Competition and Efficiency
Efficient Use of Resources
Resource allocation in a market is efficient when society values no other use of the resources more highly. Resource use is efficient when production is such that the marginal social benefit of the good equals the marginal social cost of the good.
Choices, Equilibrium, and Efficiency
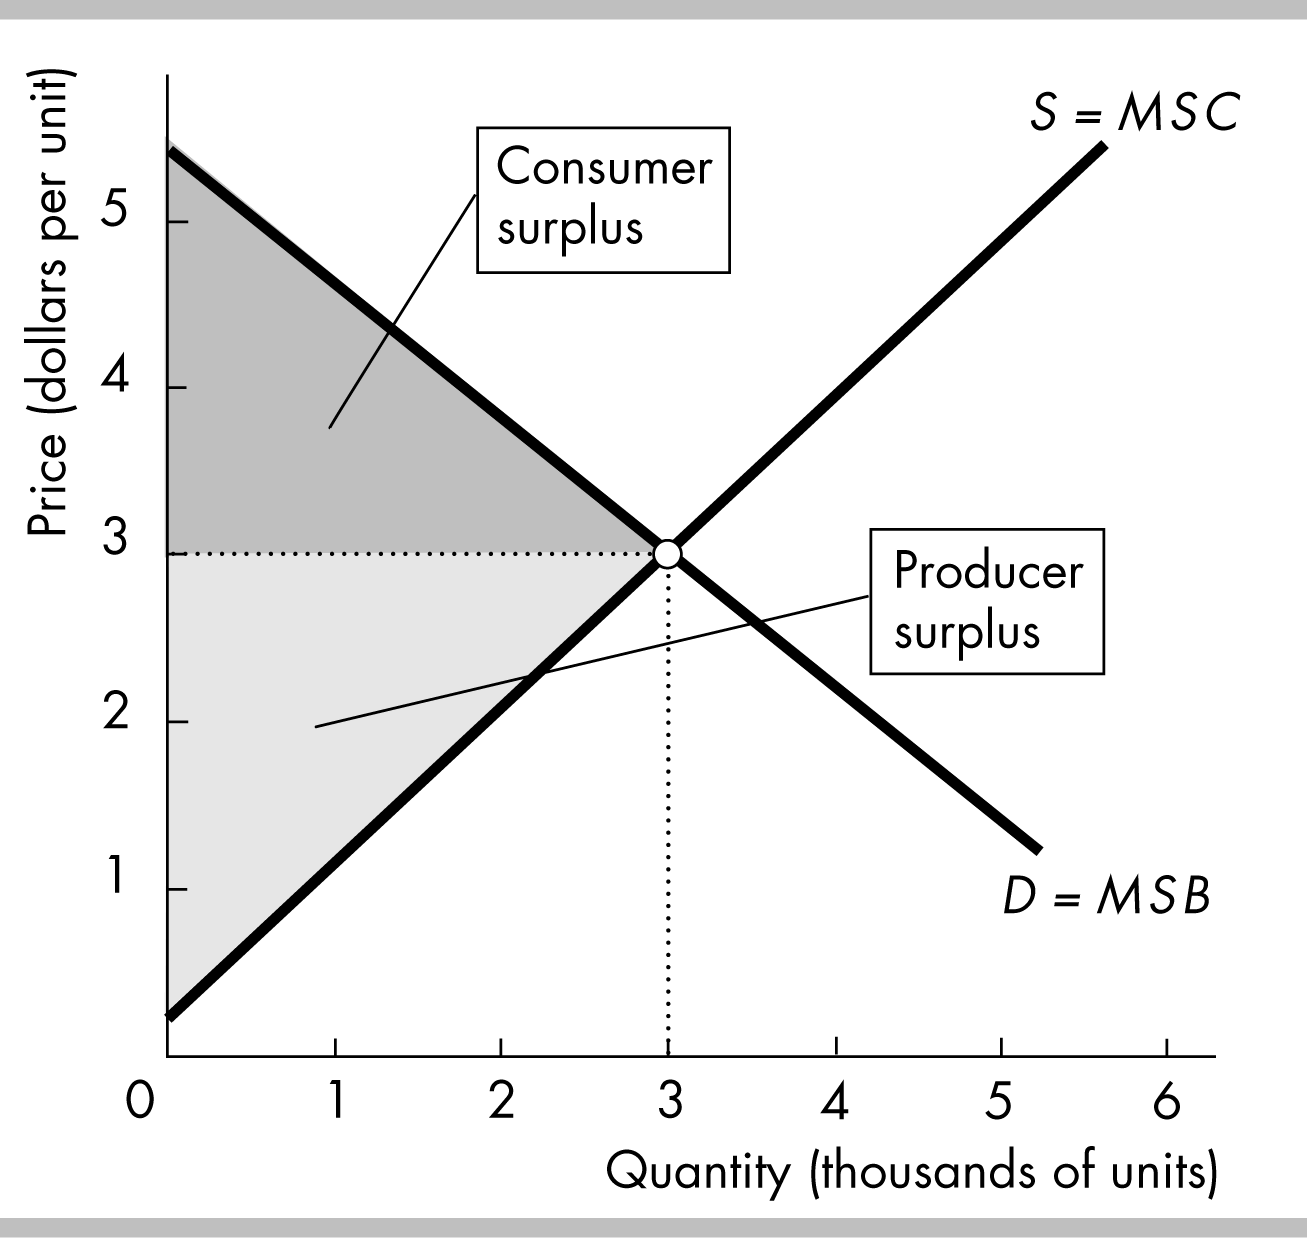
Consumers allocate their budgets to get the most value out of them. Because consumers get the most value out of their budget, a consumer’s individual demand curve for a good is the consumer’s marginal benefit curve for the good. If no one else benefits from the good other than the consumers, then as shown in the figure the market demand curve for a good is the marginal social benefit curve.
Firms maximize their profits in order to get the most value out of their resources. Firms make choices across all possible allocations of their resources. A firm’s supply curve for a good is its marginal cost curve. If all the costs of production of the good are paid by the producers, then as shown in the figure the market supply curve for a good is the marginal social cost curve.
I
 n
a competitive equilibrium, the quantity demanded equals the quantity
supplied. If there are no externalities, the demand curve is the
same as the marginal social benefit curve and the supply curve is
the same as the marginal social cost curve, so at the competitive
equilibrium, the marginal social benefit equals the marginal social
cost. Resource use is efficient. Because resources are used
efficiently, at the competitive equilibrium there is no other
allocation of resources that will generate greater net benefits to
society. The figure shows this outcome, where resource use is
efficient at the equilibrium quantity of 3,000 units.
n
a competitive equilibrium, the quantity demanded equals the quantity
supplied. If there are no externalities, the demand curve is the
same as the marginal social benefit curve and the supply curve is
the same as the marginal social cost curve, so at the competitive
equilibrium, the marginal social benefit equals the marginal social
cost. Resource use is efficient. Because resources are used
efficiently, at the competitive equilibrium there is no other
allocation of resources that will generate greater net benefits to
society. The figure shows this outcome, where resource use is
efficient at the equilibrium quantity of 3,000 units.
Monopoly and How It Arises
 A
monopoly
is a firm that produces a good or service for which no close
substitute exists and which is protected by a barrier that prevents
other firms from selling that good or service. A monopoly has two key
features:
A
monopoly
is a firm that produces a good or service for which no close
substitute exists and which is protected by a barrier that prevents
other firms from selling that good or service. A monopoly has two key
features:
No Close Substitutes: There are no close substitutes for the good or service.
Barriers to Entry: A constraint that protects a firm from potential competition is called a barrier to entry. Monopolies are protected by barriers to entry.
Natural barriers to entry create a natural monopoly, which is an industry in which economies of scale enable one firm to supply the entire market at the lowest possible cost.
An ownership barrier to entry occurs if one firm owns a significant portion of a key resource.
Legal barriers to entry create a legal monopoly, which is a market in which competition and entry are restricted by the granting of a public franchise (an exclusive right is granted to a firm to supply a good or service—the U.S. Postal Service has a public franchise to deliver first-class mail), a government license (when the government controls entry into particular occupations, professions and industries—a license is required to practice law), a patent (an exclusive right granted to the inventor of a product or service) or a copyright (exclusive right granted to the author or composer of a literary, musical, dramatic, or artistic work).
Monopoly Price-Setting Strategies
A single-price monopoly is a firm that sells each unit of its output for the same price to all its customers.
Price discrimination is the practice of selling different units of a good or service for different prices. Many firms price discriminate, but not all of them are monopoly firms.