- •Introduction
- •Chapter 1. Market Analysis
- •Product Positioning
- •Chapter 4. Determination of optimal price for a product , based on a test marketing
- •4.1. Determination of relationship between price and demand
- •Intermediate calculations
- •4.2 Determination of the optimal price at which the firm will get the maximum profit.
- •Chapter 5.Formation of optimal goods distribution channels.
- •Chapter 6.Campaign Planning product promotions
- •Conclusions
- •References
- •Questionnaire
Intermediate calculations
m=12 |
P |
n |
P*n |
P2 |
n2 |
Ni |
Ni-nm |
Ni-nm2 |
S |
1 |
150 |
120 |
18000 |
22500 |
14400 |
115,96154 |
-75,288462 |
5668,352441 |
18532,3 |
1 |
142,8 |
132 |
18849,6 |
20391,84 |
17424 |
129,65035 |
-61,59965 |
3794,516923 |
18532,3 |
1 |
135,6 |
144 |
19526,4 |
18387,36 |
20736 |
143,33916 |
-47,910839 |
2295,448509 |
18532,3 |
1 |
128,4 |
156 |
20030,4 |
16486,56 |
24336 |
157,02797 |
-34,222028 |
1171,147199 |
18532,3 |
1 |
121,2 |
168 |
20361,6 |
14689,44 |
28224 |
170,71678 |
-20,533217 |
421,6129915 |
18532,2 |
1 |
114 |
180 |
20520 |
12996 |
32400 |
184,40559 |
-6,8444056 |
46,84588794 |
18532,2 |
1 |
106,8 |
195 |
20826 |
11406,24 |
38025 |
198,09441 |
6,84440559 |
46,84588794 |
18532,2 |
1 |
99,6 |
210 |
20916 |
9920,16 |
44100 |
211,78322 |
20,5332168 |
421,6129915 |
18532,2 |
1 |
92,4 |
225 |
20790 |
8537,76 |
50625 |
225,47203 |
34,222028 |
1171,147199 |
18532,2 |
1 |
85,2 |
240 |
20448 |
7259,04 |
57600 |
239,16084 |
47,9108392 |
2295,448509 |
18532,2 |
1 |
78 |
255 |
19890 |
6084 |
65025 |
252,84965 |
61,5996503 |
3794,516923 |
18532,2 |
1 |
70,8 |
270 |
19116 |
5012,64 |
72900 |
266,53846 |
75,2884615 |
5668,352441 |
18532,2 |
Sum |
1324,8 |
2295 |
239274 |
153671,04 |
465795 |
2295 |
|
26795,8479 |
|
Interim calculations
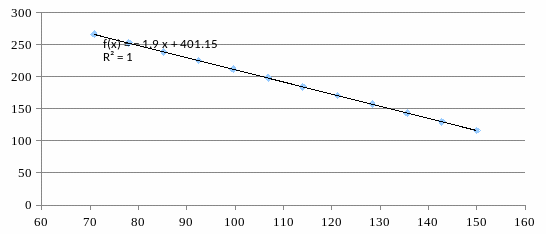
Based on the data we make a regression equation that would look like this:
N = 401,1451049+(-1,901223776)* P
We plot the dependence (pict. 4.2) the volume of sales (N) of the price (P). Example graph of the function N = f (P).

Pic 4.2. Graph of dependence total sales and price.
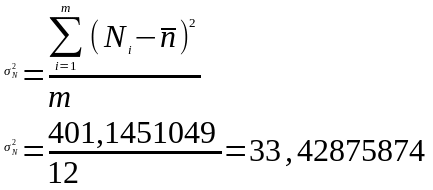
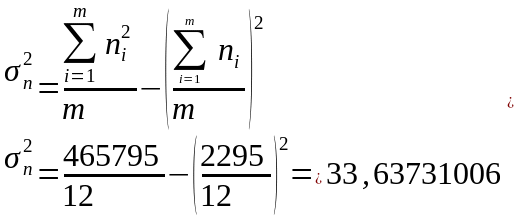
Then we determine the density of connection between these values by calculating the coefficient of determination.

where -
factor variance,
 - total variance;
The coefficient of determination - is the proportion variance of the dependent variable that is explained by the examined model dependence.


After receiving the necessary data for the calculation, we calculate the coefficient of determination:

Our
 =
0,9938, which means the link between price and demand is relatively
strong, which enables us to almost accurately determine physical
dependence prices and demand.
