

Inventory Turnover
A3 Assess inventory management using both inventory turnover and days' sales in inventory.
Earlier chapters described two important ratios useful in evaluating a company's short-term liquidity: current ratio and acid-test ratio. A merchandiser's ability to pay its short-term obligations also depends on how quickly it sells its merchandise inventory. Inventory turnover,also called merchandise inventory turnover or, simply, turns, is one ratio used to assess this and is defined in Exhibit 6.13.
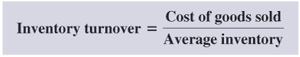
EXHIBIT 6.13
Inventory Turnover
Point: We must take care when comparing turnover ratios across companies that use different costing methods (such as FIFO and LIFO).
This ratio reveals how many times a company turns over (sells) its inventory during a period. If a company's inventory greatly varies within a year, average inventory amounts can be computed from interim periods such as quarters or months.
Users apply inventory turnover to help analyze short-term liquidity and to assess whether management is doing a good job controlling the amount of inventory available. A low ratio compared to that of competitors suggests inefficient use of assets. The company may be holding more inventory than it needs to support its sales volume. Similarly, a very high ratio compared to that of competitors suggests inventory might be too low. This can cause lost sales if customers must back-order merchandise. Inventory turnover has no simple rule except to say a high ratio is preferable provided inventory is adequate to meet demand.
Days' Sales in Inventory
Point: Inventory turnover is higher and days' sales in inventory is lower for industries such as foods and other perishable products. The reverse holds for nonperishable product industries.
To better interpret inventory turnover, many users measure the adequacy of inventory to meet sales demand. Days' sales in inventory, also called days' stock on hand, is a ratio that reveals how much inventory is available in terms of the number of days' sales. It can be interpreted as the number of days one can sell from inventory if no new items are purchased. This ratio is often viewed as a measure of the buffer against out-of-stock inventory and is useful in evaluating liquidity of inventory. It is defined in Exhibit 6.14.
![]()
EXHIBIT 6.14
Days' Sales in Inventory
Point: Days' sales in inventory for many Ford models has risen: Freestyle, 122 days; Montego, 109 days; Five Hundred, 118 days. The industry average is 73 days. (BusinessWeek)
Days' sales in inventory focuses on ending inventory and it estimates how many days it will take to convert inventory at the end of a period into accounts receivable or cash. Days' sales in inventory focuses on ending inventory whereas inventory turnover focuses on average inventory.
Decision Insight
Short Shelf Life Whole Foods Market, Inc., is committed to foods that are fresh, wholesome, and safe to eat. To fulfill those values, Whole Foods Market focuses on inventory management. It turns its inventory 20 times a year with days' sales in inventory of 19 days.
Analysis of Inventory Management
Inventory management is a major emphasis for merchandisers. They must both plan and control inventory purchases and sales. Toys “R” Us is one of those merchandisers. Its inventory in fiscal year 2011 was $2,104 million. This inventory constituted 58% of its current assets and 24% of its total assets. We apply the analysis tools in this section to Toys “R” Us, as shown inExhibit 6.15—also see margin graph.
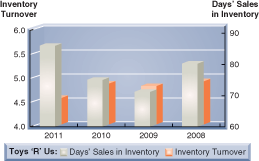
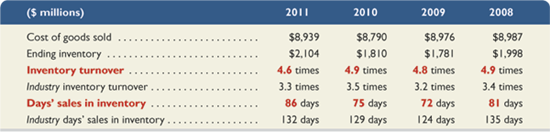
EXHIBIT 6.15
Inventory Turnover and Days' Sales in Inventory for Toys “R” Us
D
Page 244
Its 2011 inventory turnover of 4.6 times means that Toys “R” Us turns over its inventory 4.6 times per year, or once every 79 days (365 days ÷ 4.6). We prefer inventory turnover to be high provided inventory is not out of stock and the company is not losing customers. The second metric, the 2011 days' sales in inventory of 86 days, reveals that it is carrying 86 days of sales in inventory. This inventory buffer seems more than adequate. The increased days' sales in inventory suggests that Toys “R” Us would benefit from further management efforts to increase inventory turnover and reduce inventory levels.
Decision Maker

© 2002 Thaves. All rights reserved. Reprint permission granted by the Thaves in conjunction with the Cartoonist Group.
Entrepreneur Analysis of your retail store yields an inventory turnover of 5.0 and a days' sales in inventory of 73 days. The industry norm for inventory turnover is 4.4 and for days' sales in inventory is 74 days. What is your assessment of inventory management? [Answer—p. 256]
DEMONSTRATION PROBLEM 1–PERPETUAL METHOD
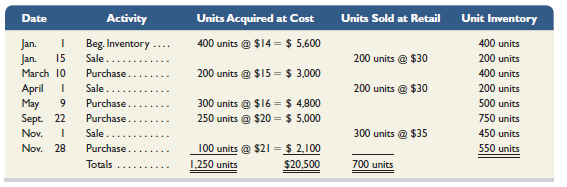
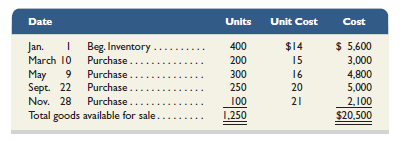
Information: Craig Company buys and sells one product. Its beginning inventory, purchases, and sales during calendar year 2013 follow:
D
Additional tracking data for specific identification: (1) January 15 sale — 200 units @ $14, (2) April 1 sale — 200 units @ $15, and (3) November 1 sale — 200 units @ $14 and 100 units @ $20.
Required
Calculate the cost of goods available for sale.
Apply the four different methods of inventory costing (FIFO, LIFO, weighted average, and specific identification) to calculate ending inventory and cost of goods sold under each method using the perpetual system.
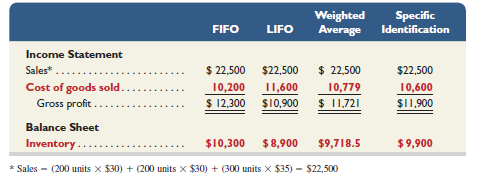
Compute gross profit earned by the company for each of the four costing methods in part 2. Also, report the inventory amount reported on the balance sheet for each of the four methods.
Page 245
In preparing financial statements for year 2013, the financial officer was instructed to use FIFO but failed to do so and instead computed cost of goods sold according to LIFO, which led to a $1,400 overstatement in cost of goods sold from using LIFO. Determine the impact on year 2013's income from the error. Also determine the effect of this error on year 2014's income. Assume no income taxes.
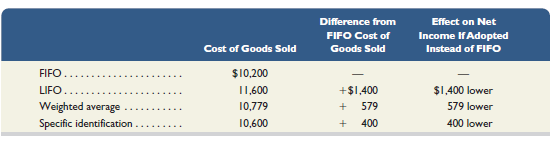
Management wants a report that shows how changing from FIFO to another method would change net income. Prepare a table showing (1) the cost of goods sold amount under each of the four methods, (2) the amount by which each cost of goods sold total is different from the FIFO cost of goods sold, and (3) the effect on net income if another method is used instead of FIFO.
PLANNING THE SOLUTION
Compute cost of goods available for sale by multiplying the units of beginning inventory and each purchase by their unit costs to determine the total cost of goods available for sale.
Prepare a perpetual FIFO table starting with beginning inventory and showing how inventory changes after each purchase and after each sale (see Exhibit 6.5).
Prepare a perpetual LIFO table starting with beginning inventory and showing how inventory changes after each purchase and after each sale (see Exhibit 6.6).
Make a table of purchases and sales recalculating the average cost of inventory prior to each sale to arrive at the weighted average cost of ending inventory. Total the average costs associated with each sale to determine cost of goods sold (see Exhibit 6.7).
Prepare a table showing the computation of cost of goods sold and ending inventory using the specific identification method (see Exhibit 6.4).
Compare the year-end 2013 inventory amounts under FIFO and LIFO to determine the misstatement of year 2013 income that results from using LIFO. The errors for year 2013 and 2014 are equal in amount but opposite in effect.
Create a table showing cost of goods sold under each method and how net income would differ from FIFO net income if an alternate method is adopted.
SOLUTION TO DEMONSTRATION PROBLEM
1.
Cost of goods available for sale (this amount is the same for all methods).
D
2a.
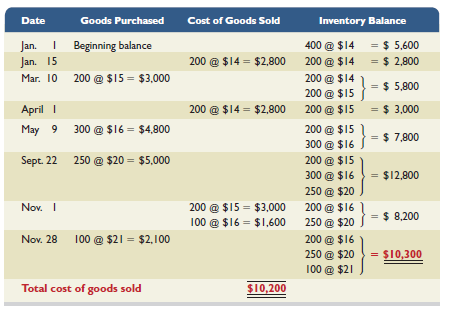
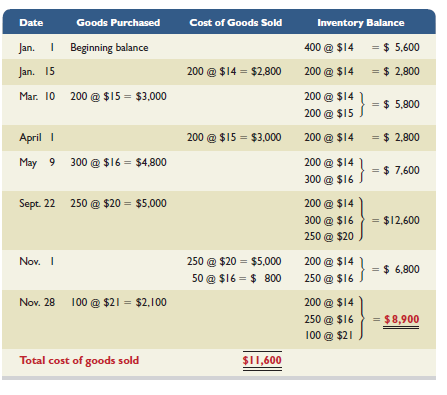
FIFO perpetual method.
D
Point: Students often mistakenly assume that the costing acronym refers to what remains in inventory. For example, it is important to realize that FIFO refers to costs that are assumed to flow into COGS; namely, the first units purchased are assumed to be the first ones to flow out to cost of goods sold. For FIFO, this means that the goods purchased most recently are assumed to be in ending inventory.
Page 246
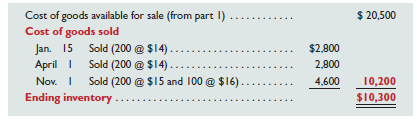
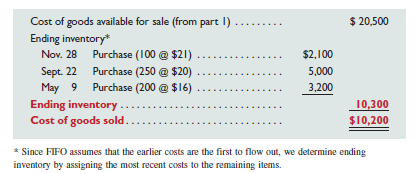
Note to students: In a classroom situation, once we compute cost of goods available for sale, we can compute the amount for either cost of goods sold or ending inventory — it is a matter of preference. In practice, the costs of items sold are identified as sales are made and immediately transferred from the inventory account to the cost of goods sold account. The previous solution showing the line-by-line approach illustrates actual application in practice. The following alternate solutions illustrate that, once the concepts are understood, other solution approaches are available. Although this is only shown for FIFO, it could be shown for all methods.
Alternate Methods to Compute FIFO Perpetual Numbers
[FIFO Alternate No. 1: Computing cost of goods sold first]
[FIFO Alternate No. 2: Computing ending inventory first]
D
2b.
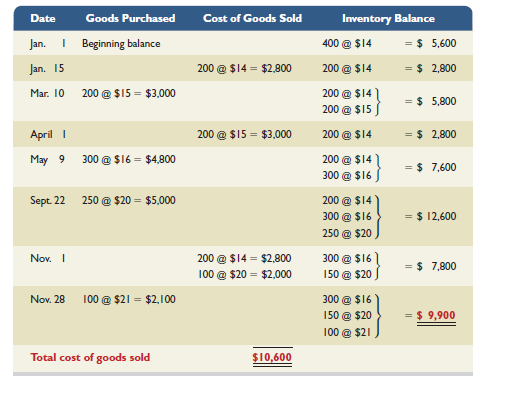
LIFO perpetual method.
D
Page 247
2c.
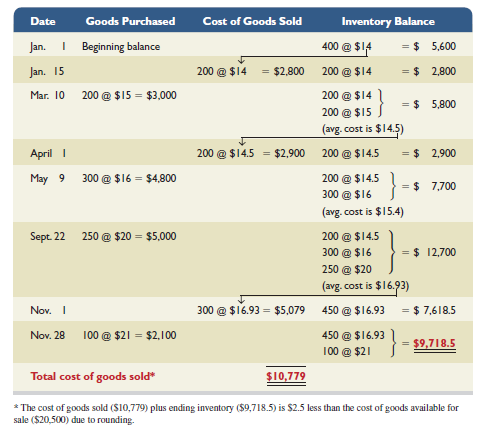
Weighted average perpetual method.
D
2d.
Specific identification method.
D
Page 248
3.
D
4.
Mistakenly using LIFO when FIFO should have been used overstates cost of goods sold in year 2013 by $1,400, which is the difference between the FIFO and LIFO amounts of ending inventory. It understates income in 2013 by $1,400. In year 2014, income is overstated by $1,400 because of the understatement in beginning inventory.
5.
Analysis of the effects of alternative inventory methods.
D
DEMONSTRATION PROBLEM 2–PERIODIC METHOD
Refer to the information in Demonstration Problem 1 to answer the following requirements.
Required
Calculate the cost of goods available for sale.
Apply the four different methods of inventory costing (FIFO, LIFO, weighted average, and specific identification) to calculate ending inventory and cost of goods sold under each method using the periodic system.
Compute gross profit earned by the company for each of the four costing methods in part 2. Also, report the inventory amount reported on the balance sheet for each of the four methods.
In preparing financial statements for year 2013, the financial officer was instructed to use FIFO but failed to do so and instead computed cost of goods sold according to LIFO. Determine the impact of the error on year 2013's income. Also determine the effect of this error on year 2014's income. Assume no income taxes.
SOLUTION TO DEMONSTRATION PROBLEM
1.
The solution is identical to the solution for part 1 of Demonstration Problem 1.
2a.
FIFO periodic method (FIFO under periodic and perpetual yields identical results).
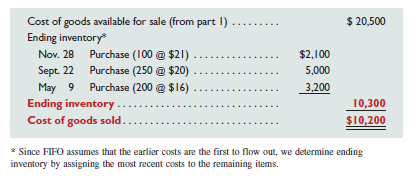
D
Page 249
2b.
LIFO periodic method.
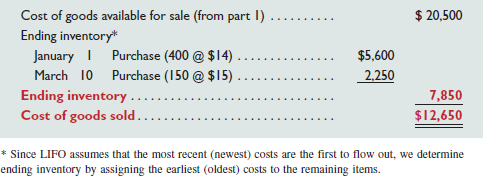
D
2c.
Weighted average periodic method.
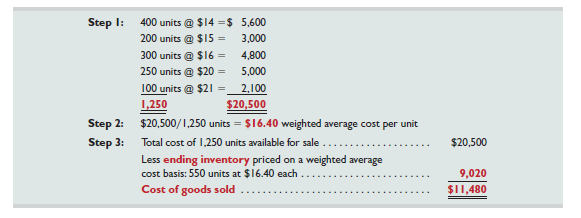
D
2d.
Specific identification method.
The solution is identical to the solution shown in part 2d of Demonstration Problem 1. This is because specific identification is not a cost flow assumption; instead, this method specifically identifies each item in inventory and each item that is sold.
3.
D
4.
The solution is identical to the solution for part 4 of Demonstration Problem 1.
APPENDIX
Inventory Costing under a Periodic System 6A
P3 Compute inventory in a periodic system using the methods of specific identification, FIFO, LIFO, and weighted average.
This section illustrates inventory costing methods. We use information from Trekking, a sporting goods store. Among its products, Trekking carries one type of mountain bike whose sales are directed at resorts that provide inexpensive mountain bikes for complimentary guest use. These resorts usually purchase in amounts of 10 or more bikes. We use Trekking's data from August. Its mountain bike (unit) inventory at the beginning of August and its purchases and sales during August are in Exhibit 6A.1. It ends August with 12 bikes in inventory. Trekking uses the periodic inventory system, which means that its merchandise inventory account is updated at the end of each period (monthly for Trekking) to reflect purchases and sales. Regardless of what inventory method or system is used, cost of goods available for sale must be allocated between cost of goods sold and ending inventory.
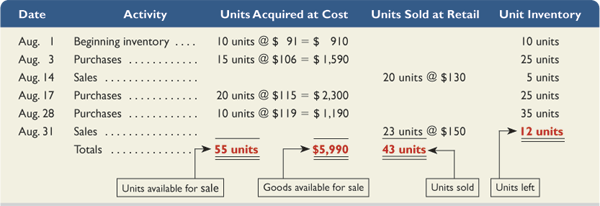
EXHIBIT 6A.1
Purchases and Sales of Goods
D
Page 250
Specific IdentificationWhen each item in inventory can be identified with a specific purchase and invoice, we can use specific identification (also called specific invoice inventory pricing) to assign costs. We also need sales records that identify exactly which items were sold and when. Trekking's internal data reveal the following specific unit sales:
August 14 |
Sold 8 bikes costing $91 each and 12 bikes costing $106 each |
August 31 |
Sold 2 bikes costing $91 each, 3 bikes costing $106 each, 15 bikes costing $115 each, and 3 bikes costing $119 each |
Point: Three key variables determine the dollar value of ending inventory: (1) inventory quantity, (2) costs of inventory, and (3) cost flow assumption.
Applying specific identification and using the information above, we prepare Exhibit 6A.2. This exhibit starts with 10 bikes at $91 each in beginning inventory. On August 3, 15 more bikes are purchased at $106 each for $1,590. Inventory available now consists of 10 bikes at $91 each and 15 bikes at $106 each, for a total of $2,500. On August 14 (see sales data above), 20 bikes costing $2,000 are sold—leaving 5 bikes costing $500 in inventory. On August 17, 20 bikes costing $2,300 are purchased, and on August 28, another 10 bikes costing $1,190 are purchased, for a total of 35 bikes costing $3,990 in inventory. On August 31 (see sales data above), 23 bikes costing $2,582 are sold, which leaves 12 bikes costing $1,408 in ending inventory. Carefully study Exhibit 6A.2 to see the flow of costs both in and out of inventory. Each unit, whether sold or remaining in inventory, has its own specific cost attached to it.
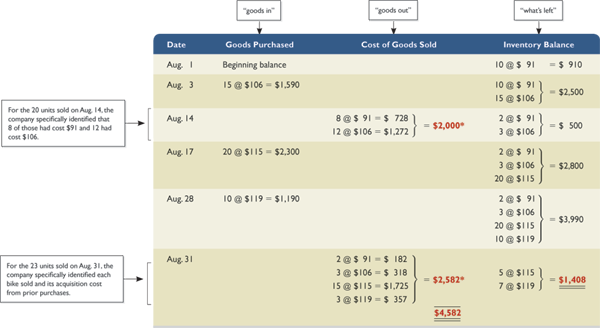
* Identification of items sold (and their costs) is obtained from internal documents that track each unit from its purchase to its sale.
EXHIBIT 6A.2
Specific Identification Computations
D
Page 251
Point: The assignment of costs to the goods sold and to inventory using specific identification is the same for both the perpetual and periodic systems.
Point: Specific identification is usually practical only for companies with expensive, custom-made inventory. Examples include car dealerships, implement dealers such as John Deere, jewelers, and fashion designers.
When using specific identification, Trekking's cost of goods sold reported on the income statement totals $4,582, the sum of $2,000 and $2,582 from the third column of Exhibit 6A.2. Trekking's ending inventory reported on the balance sheet is $1,408, which is the final inventory balance from the fourth column. The purchases and sales entries for Exhibit 6A.2 follow (the colored boldface numbers are those impacted by the cost flow assumption):
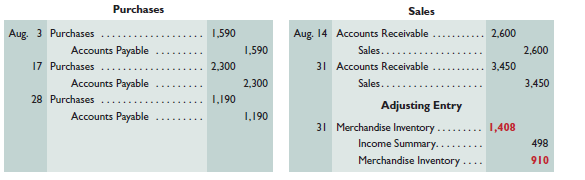
D
First-In, First-OutThe first-in, first-out (FIFO) method of assigning costs to both inventory and cost of goods sold assumes that inventory items are sold in the order acquired. When sales occur, the costs of the earliest units acquired are charged to cost of goods sold. This leaves the costs from the most recent purchases in ending inventory. Use of FIFO for computing the cost of inventory and cost of goods sold is shown in Exhibit 6A.3.
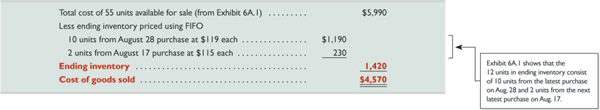
EXHIBIT 6A.3
FIFO Computations — Periodic System
D
This exhibit starts with computing $5,990 in total units available for sale—this is from Exhibit 6A.1. Applying FIFO, we know that the 12 units in ending inventory will be reported at the cost of the most recent 12 purchases. Reviewing purchases in reverse order, we assign costs to the 12 bikes in ending inventory as follows: $119 cost to 10 bikes and $115 cost to 2 bikes. This yields 12 bikes costing $1,420 in ending inventory. We then subtract this $1,420 in ending inventory from $5,990 in cost of goods available to get $4,570 in cost of goods sold.
Point: The assignment of costs to the goods sold and to inventory using FIFO is the same for both the perpetual and periodic systems.
Trekking's ending inventory reported on the balance sheet is $1,420, and its cost of goods sold reported on the income statement is $4,570. These amounts are the same as those computed using the perpetual system. This always occurs because the most recent purchases are in ending inventory under both systems. The purchases and sales entries for Exhibit 6A.3 follow (the colored boldface numbers are those affected by the cost flow assumption).
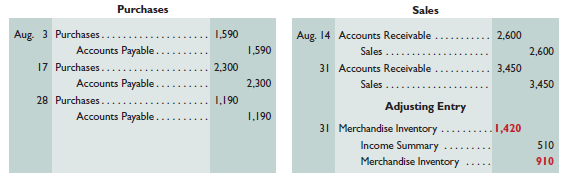
D
Page 252
Last-In, First-OutThe last-in, first-out (LIFO) method of assigning costs assumes that the most recent purchases are sold first. These more recent costs are charged to the goods sold, and the costs of the earliest purchases are assigned to inventory. LIFO results in costs of the most recent purchases being assigned to cost of goods sold, which means that LIFO comes close to matching current costs of goods sold with revenues. Use of LIFO for computing cost of inventory and cost of goods sold is shown in Exhibit 6A.4.
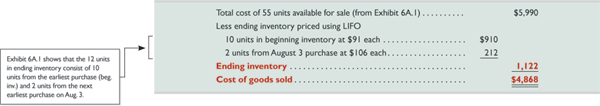
EXHIBIT 6A.4
LIFO Computations—Periodic System
D
This exhibit starts with computing $5,990 in total units available for sale—this is from Exhibit 6A.1. Applying LIFO, we know that the 12 units in ending inventory will be reported at the cost of the earliest 12 purchases. Reviewing the earliest purchases in order, we assign costs to the 12 bikes in ending inventory as follows: $91 cost to 10 bikes and $106 cost to 2 bikes. This yields 12 bikes costing $1,122 in ending inventory. We then subtract this $1,122 in ending inventory from $5,990 in cost of goods available to get $4,868 in cost of goods sold.
Trekking's ending inventory reported on the balance sheet is $1,122, and its cost of goods sold reported on the income statement is $4,868. When LIFO is used with the periodic system, cost of goods sold is assigned costs from the most recent purchases for the period. With a perpetual system, cost of goods sold is assigned costs from the most recent purchases at the point of each sale. The purchases and sales entries for Exhibit 6A.4 follow (the colored boldface numbers are those affected by the cost flow assumption).
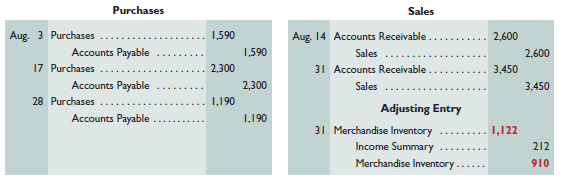
D
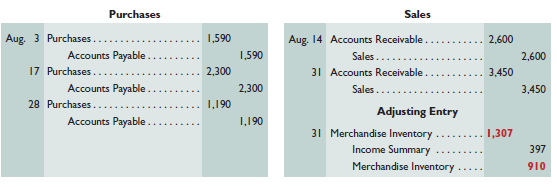
Weighted AverageThe weighted average or WA (also called average cost) method of assigning cost requires that we use the average cost per unit of inventory at the end of the period. Weighted average cost per unit equals the cost of goods available for sale divided by the units available. The weighted average method of assigning cost involves three important steps. The first two steps are shown in Exhibit 6A.5. First, multiply the per unit cost for beginning inventory and each particular purchase by the corresponding number of units (from Exhibit 6A.1). Second, add these amounts and divide by the total number of units available for sale to find the weighted average cost per unit.

Example: In Exhibit 6A.5, if 5 more units had been purchased at $120 each, what would be the weighted average cost per unit?
Answer: $109.83 ($6,590/60)
EXHIBIT 6A.5
Weighted Average Cost per Unit
D
Page 253
The third step is to use the weighted average cost per unit to assign costs to inventory and to the units sold as shown in Exhibit 6A.6.
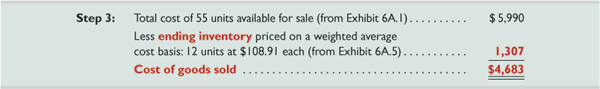
EXHIBIT 6A.6
Weighted Average Computations — Periodic
D
Point: Weighted average usually yields different results for the perpetual and the periodic systems because under a perpetual system it recomputes the per unit cost prior to each sale, whereas under a periodic system, the per unit cost is computed only at the end of a period.
Trekking's ending inventory reported on the balance sheet is $1,307, and its cost of goods sold reported on the income statement is $4,683 when using the weighted average (periodic) method. The purchases and sales entries for Exhibit 6A.6 follow (the colored boldface numbers are those affected by the cost flow assumption).
D
Point: LIFO inventory is often less than the inventory's replacement cost because LIFO inventory is valued using the oldest inventory purchase costs.
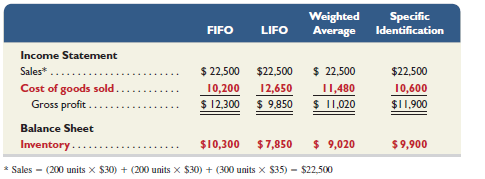
Financial Statement EffectsWhen purchase prices do not change, each inventory costing method assigns the same cost amounts to inventory and to cost of goods sold. When purchase prices are different, however, the methods nearly always assign different cost amounts. We show these differences in Exhibit 6A.7 using Trekking's data.
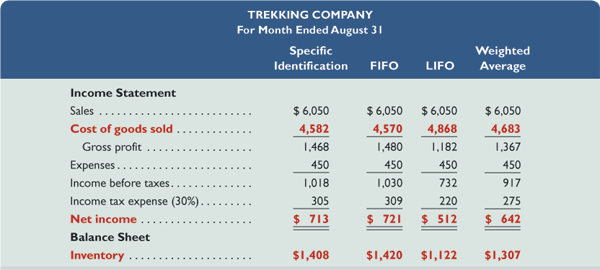
EXHIBIT 6A.7
Financial Statement Effects of Inventory Costing Methods
D
This exhibit reveals two important results. First, when purchase costs regularly rise, as in Trekking's case, observe the following:
FIFO assigns the lowest amount to cost of goods sold — yielding the highest gross profit and net income.
LIFO assigns the highest amount to cost of goods sold — yielding the lowest gross profit and net income, which also yields a temporary tax advantage by postponing payment of some income tax.
Weighted average yields results between FIFO and LIFO.
Specific identification always yields results that depend on which units are sold.
Page 254
Second, when costs regularly decline, the reverse occurs for FIFO and LIFO. FIFO gives the highest cost of goods sold—yielding the lowest gross profit and income. And LIFO gives the lowest cost of goods sold—yielding the highest gross profit and income.
All four inventory costing methods are acceptable in practice. A company must disclose the inventory method it uses. Each method offers certain advantages as follows:
FIFO assigns an amount to inventory on the balance sheet that approximates its current cost; it also mimics the actual flow of goods for most businesses.
LIFO assigns an amount to cost of goods sold on the income statement that approximates its current cost; it also better matches current costs with revenues in computing gross profit.
Weighted average tends to smooth out erratic changes in costs.
Specific identification exactly matches the costs of items with the revenues they generate.
APPENDIX
Inventory Estimation Methods 6B
P4 Apply both the retail inventory and gross profit methods to estimate inventory.
Inventory sometimes requires estimation for two reasons. First, companies often require interim statements (financial statements prepared for periods of less than one year), but they only annually take a physical count of inventory. Second, companies may require an inventory estimate if some casualty such as fire or flood makes taking a physical count impossible. Estimates are usually only required for companies that use the periodic system. Companies using a perpetual system would presumably have updated inventory data.
This appendix describes two methods to estimate inventory.
Point: When a retailer takes a physical inventory, it can restate the retail value of inventory to a cost basis by applying the cost-to-retail ratio. It can also estimate the amount of shrinkage by comparing the inventory computed with the amount from a physical inventory.
Retail Inventory MethodTo avoid the time-consuming and expensive process of taking a physical inventory each month or quarter, some companies use the retail inventory method to estimate cost of goods sold and ending inventory. Some companies even use the retail inventory method to prepare the annual statements. Home Depot, for instance, says in its annual report: “Inventories are stated at the lower of cost (first-in, first-out) or market, as determined by the retail inventory method.” A company may also estimate inventory for audit purposes or when inventory is damaged or destroyed.
The retail inventory method uses a three-step process to estimate ending inventory. We need to know the amount of inventory a company had at the beginning of the period in both cost and retail amounts. We already explained how to compute the cost of inventory. The retail amount of inventory refers to its dollar amount measured using selling prices of inventory items. We also need to know the net amount of goods purchased (minus returns, allowances, and discounts) in the period, both at cost and at retail. The amount of net sales at retail is also needed. The process is shown in Exhibit 6B.1.
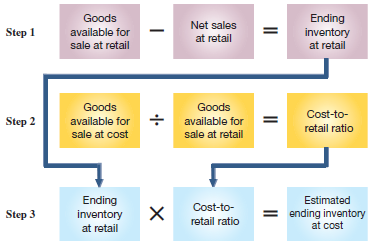
EXHIBIT 6B.1
Retail Inventory Method of Inventory Estimation
D
Example: What is the cost of ending inventory in Exhibit 6B.2 if the cost of beginning inventory is $22,500 and its retail value is $34,500? Answer: $30,000 × 62% = $18,600
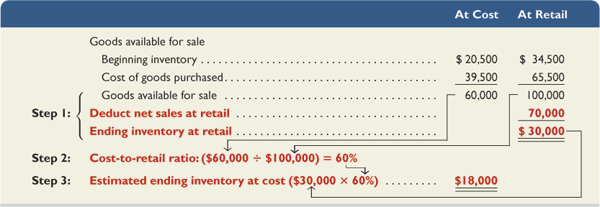
The reasoning behind the retail inventory method is that if we can get a good estimate of the cost-to-retail ratio, we can multiply ending inventory at retail by this ratio to estimate ending inventory at cost. We show in Exhibit 6B.2 how these steps are applied to estimate ending inventory for a typical company. First, we find that $100,000 of goods (at retail selling prices) were available for sale. We see that $70,000 of these goods were sold, leaving $30,000 (retail value) of merchandise in ending inventory. Second, the cost of these goods is 60% of the $100,000 retail value. Third, since cost for these goods is 60% of retail, the estimated cost of ending inventory is $18,000.
Point: A retailer such as Target can speed up its year-end physical count by using the retail inventory method. Inventory counters can record the item's retail price without having to look up the cost of each item.
EXHIBIT 6B.2
Estimated Inventory Using the Retail Inventory Method
D
Page 255
Gross Profit MethodThe gross profit method estimates the cost of ending inventory by applying the gross profit ratio to net sales (at retail). This type of estimate often is needed when inventory is destroyed, lost, or stolen. These cases require an inventory estimate so that a company can file a claim with its insurer. Users also apply this method to see whether inventory amounts from a physical count are reasonable. This method uses the historical relation between cost of goods sold and net sales to estimate the proportion of cost of goods sold making up current sales. This cost of goods sold estimate is then subtracted from cost of goods available for sale to estimate the ending inventory at cost. These two steps are shown in Exhibit 6B.3.
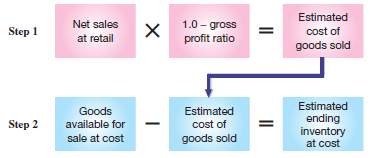
EXHIBIT 6B.3
Gross Profit Method of Inventory Estimation
D
Point: A fire or other catastrophe can result in an insurance claim for lost inventory or income. Backup and off-site storage of data help ensure coverage for such losses.
To illustrate, assume that a company's inventory is destroyed by fire in March 2013. When the fire occurs, the company's accounts show the following balances for January through March: sales, $31,500; sales returns, $1,500; inventory (January 1, 2013), $12,000; and cost of goods purchased, $20,500. If this company's gross profit ratio is 30%, then 30% of each net sales dollar is gross profit and 70% is cost of goods sold. We show in Exhibit 6B.4 how this 70% is used to estimate lost inventory of $11,500. To understand this exhibit, think of subtracting the cost of goods sold from the goods available for sale to get the ending inventory.
Point: Reliability of the gross profit method depends on an accurate and stable estimate of the gross profit ratio.
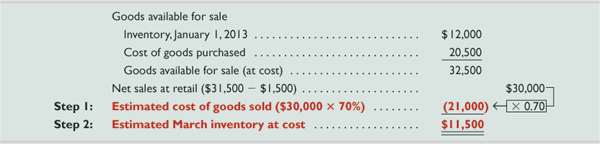
EXHIBIT 6B.4
Estimated Inventory Using the Gross Profit Method
D
Quick Check
Answers — p. 257
9.
Using the retail method and the following data, estimate the cost of ending inventory.
-
Cost
Retail
Beginning inventory
$324,000
$530,000
Cost of goods purchased
195,000
335,000
Net sales
320,000
Page 256
Summary
C1 Identify the items making up merchandise inventory. Merchandise inventory refers to goods owned by a company and held for resale. Three special cases merit our attention. Goods in transit are reported in inventory of the company that holds ownership rights. Goods on consignment are reported in the consignor's inventory. Goods damaged or obsolete are reported in inventory at their net realizable value.
C2 Identify the costs of merchandise inventory. Costs of merchandise inventory include expenditures necessary to bring an item to a salable condition and location. This includes its invoice cost minus any discount plus any added or incidental costs necessary to put it in a place and condition for sale.
A1 Analyze the effects of inventory methods for both financial and tax reporting. When purchase costs are rising or falling, the inventory costing methods are likely to assign different costs to inventory. Specific identification exactly matches costs and revenues. Weighted average smooths out cost changes. FIFO assigns an amount to inventory closely approximating current replacement cost. LIFO assigns the most recent costs incurred to cost of goods sold and likely better matches current costs with revenues.
A2 Analyze the effects of inventory errors on current and future financial statements. An error in the amount of ending inventory affects assets (inventory), net income (cost of goods sold), and equity for that period. Since ending inventory is next period's beginning inventory, an error in ending inventory affects next period's cost of goods sold and net income. Inventory errors in one period are offset in the next period.
A3 Assess inventory management using both inventory turnover and days' sales in inventory. We prefer a high inventory turnover, provided that goods are not out of stock and customers are not turned away. We use days' sales in inventory to assess the likelihood of goods being out of stock. We prefer a small number of days' sales in inventory if we can serve customer needs and provide a buffer for uncertainties.
P1 Compute inventory in a perpetual system using the methods of specific identification, FIFO, LIFO, and weighted average. Costs are assigned to the cost of goods sold account each time a sale occurs in a perpetual system. Specific identification assigns a cost to each item sold by referring to its actual cost (for example, its net invoice cost). Weighted average assigns a cost to items sold by dividing the current balance in the inventory account by the total items available for sale to determine cost per unit. We then multiply the number of units sold by this cost per unit to get the cost of each sale. FIFO assigns cost to items sold assuming that the earliest units purchased are the first units sold. LIFO assigns cost to items sold assuming that the most recent units purchased are the first units sold.
P2 Compute the lower of cost or market amount of inventory. Inventory is reported at market cost when market is lower than recorded cost, called the lower of cost or market (LCM) inventory. Market is typically measured as replacement cost. Lower of cost or market can be applied separately to each item, to major categories of items, or to the entire inventory.
P3A Compute inventory in a periodic system using the methods of specific identification, FIFO, LIFO, and weighted average. Periodic inventory systems allocate the cost of goods available for sale between cost of goods sold and ending inventory at the end of a period. Specific identification and FIFO give identical results whether the periodic or perpetual system is used. LIFO assigns costs to cost of goods sold assuming the last units purchased for the period are the first units sold. The weighted average cost per unit is computed by dividing the total cost of beginning inventory and net purchases for the period by the total number of units available. Then, it multiplies cost per unit by the number of units sold to give cost of goods sold.
P4B Apply both the retail inventory and gross profit methods to estimate inventory. The retail inventory method involves three steps: (1) goods available at retail minus net sales at retail equals ending inventory at retail, (2) goods available at cost divided by goods available at retail equals the cost-to-retail ratio, and (3) ending inventory at retail multiplied by the cost-to-retail ratio equals estimated ending inventory at cost. The gross profit method involves two steps: (1) net sales at retail multiplied by 1 minus the gross profit ratio equals estimated cost of goods sold, and (2) goods available at cost minus estimated cost of goods sold equals estimated ending inventory at cost.
Page 257
Guidance
Answers to Decision
Maker and Decision
Ethics ![]()
Cost Analyst Explain to your supervisor that when inventory costs are increasing, FIFO results in an inventory valuation that approximates replacement cost. The most recently purchased goods are assigned to ending inventory under FIFO and are likely closer to replacement values than earlier costs that would be assigned to inventory if LIFO were used.
Inventory Manager It seems your company can save (or at least postpone) taxes by switching to LIFO, but the switch is likely to reduce bonus money that you think you have earned and deserve. Since the U.S. tax code requires companies that use LIFO for tax reporting also to use it for financial reporting, your options are further constrained. Your best decision is to tell your superior about the tax savings with LIFO. You also should discuss your bonus plan and how this is likely to hurt you unfairly. You might propose to compute inventory under the LIFO method for reporting purposes but use the FIFO method for your bonus calculations. Another solution is to revise the bonus plan to reflect the company's use of the LIFO method.
Entrepreneur Your inventory turnover is markedly higher than the norm, whereas days' sales in inventory approximates the norm. Since your turnover is already 14% better than average, you are probably best served by directing attention to days' sales in inventory. You should see whether you can reduce the level of inventory while maintaining service to customers. Given your higher turnover, you should be able to hold less inventory.
Guidance Answers to Quick Checks
The matching principle.
Famous Footwear reports these goods in its inventory.
Total cost assigned to the painting is $12,180, computed as $11,400 + $130 + $150 + $100 + $400.
Specific identification exactly matches costs and revenues. Weighted average tends to smooth out cost changes. FIFO assigns an amount to inventory that closely approximates current replacement cost. LIFO assigns the most recent costs incurred to cost of goods sold and likely better matches current costs with revenues.
FIFO—it gives a lower cost of goods sold, a higher gross profit, and a higher net income when costs are rising.
When costs are rising, LIFO gives a lower inventory figure on the balance sheet as compared to FIFO. FIFO's inventory amount approximates current replacement costs.
Cost of goods sold would be overstated by $10,000 in 2012 and understated by $10,000 in year 2013.
The reported LCM inventory amount (using items) is $540, computed as [(20 × $5) + (40 × $8) + (10 × $12)].
B Estimated ending inventory (at cost) is $327,000. It is computed as follows:
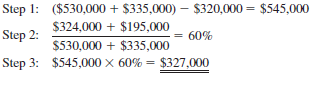
D
Key Terms
Average cost (p. 236, 252)
Conservatism constraint (p. 240)
Consignee (p. 230)
Consignor (p. 230)
Consistency concept (p. 239)
Days' sales in inventory (p. 243)
First-in, first-out (FIFO) (p. 235)
Gross profit method (p. 255)
Interim statements (p. 254)
Inventory turnover (p. 243)
Last-in, first-out (LIFO) (p. 235)
Lower of cost or market (LCM) (p. 239)
Net realizable value (p. 230)
Retail inventory method (p. 254)
Specific identification (p. 233, 250)
Weighted average (p. 236, 252)
Multiple Choice Quiz Answers on p. 274 mhhe.com/wildFAP21e
Additional Quiz Questions are available at the book's Website.
Use the following information from Marvel Company for the month of July to answer questions 1 through 4.
1 July |
Beginning inventory |
75 units @ $25 each |
3 July |
Purchase |
348 units @ $27 each |
8 July |
Sale |
300 units |
July 15 |
Purchase |
257 units @ $28 each |
July 23 |
Sale |
275 units |
Perpetual: Assume that Marvel uses a perpetual FIFO inventory system. What is the dollar value of its ending inventory?
$2,940
$2,685
$2,625
$2,852
$2,705
Perpetual: Assume that Marvel uses a perpetual LIFO inventory system. What is the dollar value of its ending inventory?
$2,940
$2,685
$2,625
$2,852
$2,705
Perpetual: Assume that Marvel uses a perpetual specific identification inventory system. Its ending inventory consists of 20 units from beginning inventory, 40 units from the July 3 purchase, and 45 units from the July 15 purchase. What is the dollar value of its ending inventory?
$2,940
$2,685
$2,625
$2,852
$2,840
Periodic: Assume that Marvel uses a periodic FIFO inventory system. What is the dollar value of its ending inventory?
$2,940
$2,685
$2,625
$2,852
$2,705
Periodic: A company reports the following beginning inventory and purchases, and it ends the period with 30 units in inventory.
Beginning inventory
100 units at $10 cost per unit
Purchase 1
40 units at $12 cost per unit
Purchase 2
20 units at $14 cost per unit
Compute ending inventory using the FIFO periodic system.
Compute cost of goods sold using the LIFO periodic system.
A company has cost of goods sold of $85,000 and ending inventory of $18,000. Its days' sales in inventory equals:
49.32 days
0.21 days
4.72 days
77.29 days
1,723.61 days
Page 258
B Superscript letter A (B) denotes assignments based on Appendix 6A (6B).