

Inventory Cost Flow Assumptions
This section introduces inventory cost flow assumptions. For this purpose, assume that three identical units are purchased separately at the following three dates and costs: May 1 at $45, May 3 at $65, and May 6 at $70. One unit is then sold on May 7 for $100. Exhibit 6.2 gives a visual layout of the flow of costs to either the gross profit section of the income statement or the inventory reported on the balance sheet for FIFO, LIFO, and weighted average.

EXHIBIT 6.2
Cost Flow Assumptions
D
Point: It is helpful to recall the cost flow of inventory from Exhibit 5.4.
D
(1) FIFO assumes costs flow in the order incurred. The unit purchased on May 1 for $45 is the earliest cost incurred — it is sent to cost of goods sold on the income statement first. The remaining two units ($65 and $70) are reported in inventory on the balance sheet.
(2) LIFO assumes costs flow in the reverse order incurred. The unit purchased on May 6 for $70 is the most recent cost incurred — it is sent to cost of goods sold on the income statement. The remaining two units ($45 and $65) are reported in inventory on the balance sheet.
(3) Weighted average assumes costs flow at an average of the costs available. The units available at the May 7 sale average $60 in cost, computed as ($45 + $65 + $70)/3. One unit's $60 average cost is sent to cost of goods sold on the income statement. The remaining two units' average costs are reported in inventory at $120 on the balance sheet.
Cost flow assumptions can markedly impact gross profit and inventory numbers. Exhibit 6.2 shows that gross profit as a percent of net sales ranges from 30% to 55% due to nothing else but the cost flow assumption.
The following sections on inventory costing use the perpetual system. Appendix 6A uses the periodic system. An instructor can choose to cover either one or both systems. If the perpetual system is skipped, then read Appendix 6A and return to the Decision Maker box (on page 238) titled “Cost Analyst.”
Page 233
Inventory Costing Illustration
P1 Compute inventory in a perpetual system using the methods of specific identification, FIFO, LIFO, and weighted average.
This section provides a comprehensive illustration of inventory costing methods. We use information from Trekking, a sporting goods store. Among its many products, Trekking carries one type of mountain bike whose sales are directed at resorts that provide inexpensive mountain bikes for complimentary guest use. Its customers usually purchase in amounts of 10 or more bikes. We use Trekking's data from August. Its mountain bike (unit) inventory at the beginning of August and its purchases and sales during August are shown in Exhibit 6.3. It ends August with 12 bikes remaining in inventory.
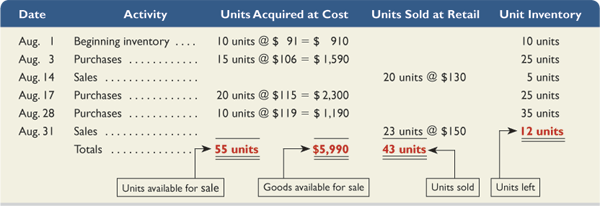
EXHIBIT 6.3
Purchases and Sales of Goods
D
Point: The perpetual inventory system is the most dominant system for U.S. businesses.
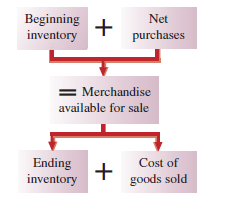
Trekking uses the perpetual inventory system, which means that its merchandise inventory account is continually updated to reflect purchases and sales. (Appendix 6A describes the assignment of costs to inventory using a periodic system.) Regardless of what inventory method or system is used, cost of goods available for sale must be allocated between cost of goods sold and ending inventory.
Point: Beginning inventory units plus purchased units equals units available for sale (UAFS).
Specific Identification
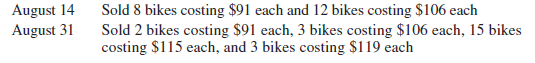
When each item in inventory can be identified with a specific purchase and invoice, we can use specific identification (also called specific invoice inventory pricing) to assign costs. We also need sales records that identify exactly which items were sold and when. Trekking's internal documents reveal the following specific unit sales:
D
Point: Three key variables determine the dollar value of ending inventory: (1) inventory quantity, (2) costs of inventory, and (3) cost flow assumption.
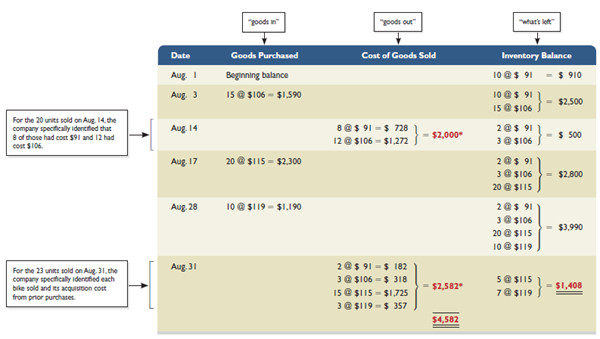
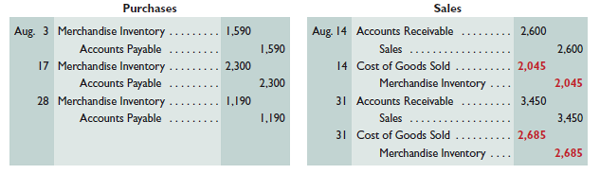
Applying specific identification, and using the information above and from Exhibit 6.3, we prepare Exhibit 6.4. This exhibit starts with 10 bikes at $91 each in beginning inventory. On August 3, 15 more bikes are purchased at $106 each for $1,590. Inventory available now consists of 10 bikes at $91 each and 15 bikes at $106 each, for a total of $2,500. On August 14 (see sales data on previous page), 20 bikes costing $2,000 are sold—leaving 5 bikes costing $500 in inventory. On August 17, 20 bikes costing $2,300 are purchased, and on August 28, another 10 bikes costing $1,190 are purchased, for a total of 35 bikes costing $3,990 in inventory. On August 31 (see sales data on previous page), 23 bikes costing $2,582 are sold, which leaves 12 bikes costing $1,408 in ending inventory. Carefully study this exhibit and the boxed explanations to see the flow of costs both in and out of inventory. Each unit, whether sold or remaining in inventory, has its own specific cost attached to it.
* Identification of items sold (and their costs) is obtained from internal documents that track each unit from its purchase to its sale.
EXHIBIT 6.4
Specific Identification Computations
D
Page 234
Point: Specific identification is usually practical for companies with expensive or custom-made inventory. Examples include car dealerships, implement dealers such as John Deere, jewelers, and fashion designers.
When using specific identification, Trekking's cost of goods sold reported on the income statement totals$4,582, the sum of $2,000 and $2,582 from the third column of Exhibit 6.4. Trekking's ending inventory reported on the balance sheet is $1,408, which is the final inventory balance from the fourth column ofExhibit 6.4.
The purchases and sales entries for Exhibit 6.4 follow (the colored boldface numbers are those impacted by the cost flow assumption):
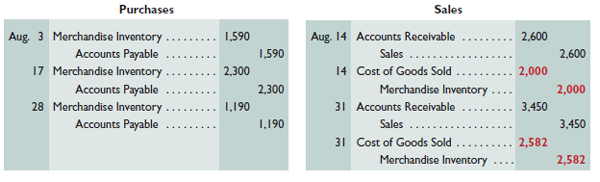
D
Point: The assignment of costs to the goods sold and to inventory using specific identification is the same for both the perpetual and periodic systems.
Page 235
First-In, First-Out
Point: The “Goods Purchased” column is identical for all methods. Data are taken from Exhibit 6.3.
The first-in, first-out (FIFO) method of assigning costs to both inventory and cost of goods sold assumes that inventory items are sold in the order acquired. When sales occur, the costs of the earliest units acquired are charged to cost of goods sold. This leaves the costs from the most recent purchases in ending inventory. Use of FIFO for computing the cost of inventory and cost of goods sold is shown in Exhibit 6.5.
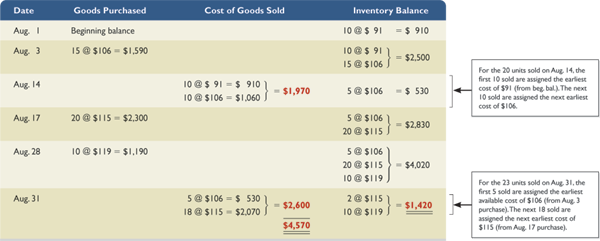
EXHIBIT 6.5
FIFO Computations — Perpetual System
D
This exhibit starts with beginning inventory of 10 bikes at $91 each. On August 3, 15 more bikes costing $106 each are bought for $1,590. Inventory now consists of 10 bikes at $91 each and 15 bikes at $106 each, for a total of $2,500. On August 14, 20 bikes are sold—applying FIFO, the first 10 sold cost $91 each and the next 10 sold cost $106 each, for a total cost of $1,970. This leaves 5 bikes costing $106 each, or $530, in inventory. On August 17, 20 bikes costing $2,300 are purchased, and on August 28, another 10 bikes costing $1,190 are purchased, for a total of 35 bikes costing $4,020 in inventory. On August 31, 23 bikes are sold—applying FIFO, the first 5 bikes sold cost $530 and the next 18 sold cost $2,070, which leaves 12 bikes costing $1,420 in ending inventory.
Point: Under FIFO, a unit sold is assigned the earliest (oldest) cost from inventory. This leaves the most recent costs in ending inventory.
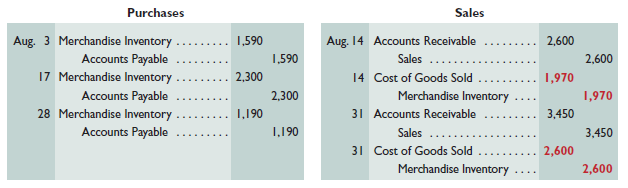
Trekking's FIFO cost of goods sold reported on its income statement (reflecting the 43 units sold) is $4,570($1,970 + $2,600), and its ending inventory reported on the balance sheet (reflecting the 12 units unsold) is$1,420.
The purchases and sales entries for Exhibit 6.5 follow (the colored boldface numbers are those affected by the cost flow assumption).
Point: LOSH (last ones still here) can help remember what costs are in FIFO ending inventory.
D
Last-In, First-Out
The last-in, first-out (LIFO) method of assigning costs assumes that the most recent purchases are sold first. These more recent costs are charged to the goods sold, and the costs of the earliest purchases are assigned to inventory. As with other methods, LIFO is acceptable even when the physical flow of goods does not follow a last-in, first-out pattern. One appeal of LIFO is that by assigning costs from the most recent purchases to cost of goods sold, LIFO comes closest to matching current costs of goods sold with revenues (compared to FIFO or weighted average).
Page 236
Point: Under LIFO, a unit sold is assigned the most recent (latest) cost from inventory. This leaves the oldest costs in inventory.
Point: FOSH (first ones still here) can help remember what costs are in LIFO ending inventory.
Exhibit 6.6 shows the LIFO computations. It starts with beginning inventory of 10 bikes at $91 each. On August 3, 15 more bikes costing $106 each are bought for $1,590. Inventory now consists of 10 bikes at $91 each and 15 bikes at $106 each, for a total of $2,500. On August 14, 20 bikes are sold—applying LIFO, the first 15 sold are from the most recent purchase costing $106 each, and the next 5 sold are from the next most recent purchase costing $91 each, for a total cost of $2,045. This leaves 5 bikes costing $91 each, or $455, in inventory. On August 17, 20 bikes costing $2,300 are purchased, and on August 28, another 10 bikes costing $1,190 are purchased, for a total of 35 bikes costing $3,945 in inventory. On August 31, 23 bikes are sold—applying LIFO, the first 10 bikes sold are from the most recent purchase costing $1,190, and the next 13 sold are from the next most recent purchase costing $1,495, which leaves 12 bikes costing $1,260 in ending inventory.
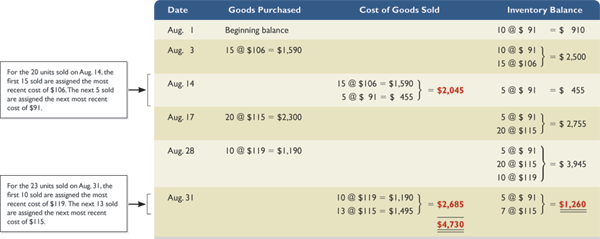
EXHIBIT 6.6
LIFO Computations—Perpetual System
D
Trekking's LIFO cost of goods sold reported on the income statement is $4,730 ($2,045 + $2,685), and its ending inventory reported on the balance sheet is $1,260.
The purchases and sales entries for Exhibit 6.6 follow (the colored boldface numbers are those affected by the cost flow assumption).
Point: Grocers prefer a FIFO physical flow of milk cartons. Consumers prefer a LIFO flow as they desire a long refrigerator life and reach for recently stocked milk. However, the cost flow in accounting need not match the physical flow in the store.
D
Weighted Average
The weighted average (also called average cost) method of assigning cost requires that we use the weighted average cost per unit of inventory at the time of each sale. Weighted average cost per unit at the time of each sale equals the cost of goods available for sale divided by the units available. The results using weighted average (WA) for Trekking are shown in Exhibit 6.7.
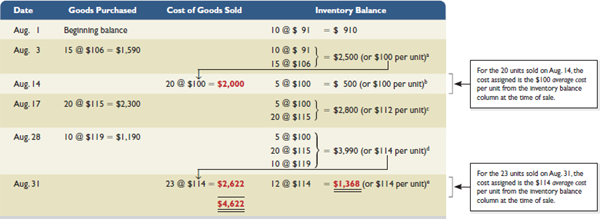
a $100 per unit = ($2,500 inventory balance ÷ 25 units in inventory).
b $100 per unit = ($500 inventory balance ÷ 5 units in inventory).
c $112 per unit = ($2,800 inventory balance ÷ 25 units in inventory).
d $114 per unit = ($3,990 inventory balance ÷ 35 units in inventory).
e $114 per unit = ($1,368 inventory balance ÷ 12 units in inventory).
EXHIBIT 6.7
Weighted Average Computations—Perpetual System
D
Page 237
This exhibit starts with beginning inventory of 10 bikes at $91 each. On August 3, 15 more bikes costing $106 each are bought for $1,590. Inventory now consists of 10 bikes at $91 each and 15 bikes at $106 each, for a total of $2,500. The average cost per bike for that inventory is $100, computed as $2,500/(10 bikes + 15 bikes). On August 14, 20 bikes are sold—applying WA, the 20 sold are assigned the $100 average cost, for a total cost of $2,000. This leaves 5 bikes with an average cost of $100 each, or $500, in inventory. On August 17, 20 bikes costing $2,300 are purchased, and on August 28, another 10 bikes costing $1,190 are purchased, for a total of 35 bikes costing $3,990 in inventory at August 28. The average cost per bike for the August 28 inventory is $114, computed as $3,990/(5 bikes + 20 bikes + 10 bikes). On August 31, 23 bikes are sold—applying WA, the 23 sold are assigned the $114 average cost, for a total cost of $2,622. This leaves 12 bikes costing $1,368 in ending inventory.
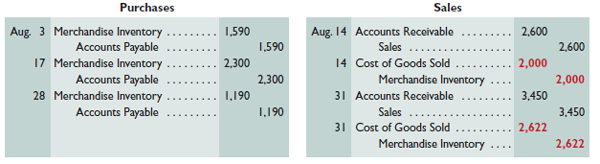
Trekking's cost of goods sold reported on the income statement (reflecting the 43 units sold) is $4,622($2,000 + $2,622), and its ending inventory reported on the balance sheet (reflecting the 12 units unsold) is$1,368.
Point: Under weighted average, a unit sold is assigned the average cost of all items currently available for sale at the date of each sale. This means a new average cost is computed after each purchase.
The purchases and sales entries for Exhibit 6.7 follow (the colored boldface numbers are those affected by the cost flow assumption).
D
Point: Cost of goods available for sale (COGAFS), units available for sale (UAFS), and units in ending inventory are identical for all methods.
This completes computations under the four most common perpetual inventory costing methods. Advances in technology have greatly reduced the cost of a perpetual inventory system. Many companies now ask whether they can afford not to have a perpetual inventory system because timely access to inventory information is a competitive advantage and it can help reduce the amount of inventory, which reduces costs.
![]() Decision Insight
Decision Insight
Inventory Control Inventory safeguards include restricted access, use of authorized requisitions, security measures, and controlled environments to prevent damage. Proper accounting includes matching inventory received with purchase order terms and quality requirements, preventing misstatements, and controlling access to inventory records. A study reports that 23% of employees in purchasing and procurement observed inappropriate kickbacks or gifts from suppliers. Another study reports that submission of fraudulent supplier invoices is now common, and perpetrators are often employees (KPMG 2011).
Page 238
Financial Statement Effects of Costing Methods
A1 Analyze the effects of inventory methods for both financial and tax reporting.
When purchase prices do not change, each inventory costing method assigns the same cost amounts to inventory and to cost of goods sold. When purchase prices are different, however, the methods nearly always assign different cost amounts. We show these differences in Exhibit 6.8 using Trekking's data.
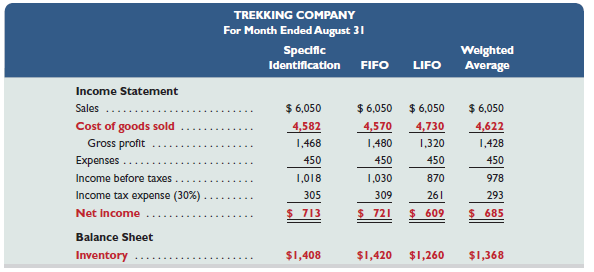
EXHIBIT 6.8
Financial Statement Effects of Inventory Costing Methods
D
This exhibit reveals two important results. First, when purchase costs regularly rise, as in Trekking's case, the following occurs:
Point: Managers prefer FIFO when costs are rising and incentives exist to report higher income for reasons such as bonus plans, job security, and reputation.
FIFO assigns the lowest amount to cost of goods sold — yielding the highest gross profit and net income.
LIFO assigns the highest amount to cost of goods sold — yielding the lowest gross profit and net income, which also yields a temporary tax advantage by postponing payment of some income tax.
Weighted average yields results between FIFO and LIFO.
Specific identification always yields results that depend on which units are sold.
Point: LIFO inventory is often less than the inventory's replacement cost because LIFO inventory is valued using the oldest inventory purchase costs.
Second, when costs regularly decline, the reverse occurs for FIFO and LIFO. Namely, FIFO gives the highest cost of goods sold—yielding the lowest gross profit and income. However, LIFO then gives the lowest cost of goods sold—yielding the highest gross profit and income.
All four inventory costing methods are acceptable. However, a company must disclose the inventory method it uses in its financial statements or notes. Each method offers certain advantages as follows:
FIFO assigns an amount to inventory on the balance sheet that approximates its current cost; it also mimics the actual flow of goods for most businesses.
LIFO assigns an amount to cost of goods sold on the income statement that approximates its current cost; it also better matches current costs with revenues in computing gross profit.
Weighted average tends to smooth out erratic changes in costs.
Specific identification exactly matches the costs of items with the revenues they generate.
![]() Decision Maker
Decision Maker
Cost Analyst Your supervisor says she finds managing product costs easier if the balance sheet reflects inventory values that closely reflect replacement cost. Which inventory costing method do you advise adopting? [Answer—p. 256]
Tax Effects of Costing Methods Trekking's segment income statement in Exhibit 6.8 includes income tax expense (at a rate of 30%) because it was formed as a corporation. Since inventory costs affect net income, they have potential tax effects. Trekking gains a temporary tax advantage by using LIFO. Many companies use LIFO for this reason.
Page 239
Point: LIFO conformity rule may be revised if IFRS is adopted for U.S. companies as IFRS currently does not permit LIFO (see Global View).
Companies can and often do use different costing methods for financial reporting and tax reporting. The only exception is when LIFO is used for tax reporting; in this case, the IRS requires that it also be used in financial statements—called the LIFO conformity rule.
Consistency in Using Costing Methods
The consistency concept prescribes that a company use the same accounting methods period after period so that financial statements are comparable across periods — the only exception is when a change from one method to another will improve its financial reporting. The full-disclosure principle prescribes that the notes to the statements report this type of change, its justification, and its effect on income.
The consistency concept does not require a company to use one method exclusively. For example, it can use different methods to value different categories of inventory.
![]() Decision Ethics
Decision Ethics
Inventory Manager Your compensation as inventory manager includes a bonus plan based on gross profit. Your superior asks your opinion on changing the inventory costing method from FIFO to LIFO. Since costs are expected to continue to rise, your superior predicts that LIFO would match higher current costs against sales, thereby lowering taxable income (and gross profit). What do you recommend? [Answer—p. 256]
Quick Check
Answers — p. 257
Describe one advantage for each of the inventory costing methods: specific identification, FIFO, LIFO, and weighted average.
When costs are rising, which method reports higher net income—LIFO or FIFO?
When costs are rising, what effect does LIFO have on a balance sheet compared to FIFO?
A company takes a physical count of inventory at the end of 2012 and finds that ending inventory is understated by $10,000. Would this error cause cost of goods sold to be overstated or understated in 2012? In year 2013? If so, by how much?