Chapter 10
Standard Costs and the Balanced Scorecard
Solutions to Questions
10-1 A quantity standard indicates how much of an input should be used to make a unit of output. A price standard indicates how much the input should cost.
10-2 Ideal standards assume perfection and do not allow for any inefficiency. Thus, ideal standards are rarely, if ever, attained. Practical standards can be attained by employees working at a reasonable, though efficient pace and allow for normal breaks and work interruptions.
10-3 Chronic inability to meet a standard is likely to be demoralizing and may result in decreased productivity.
10-4 A budget is usually expressed in terms of total dollars, whereas a standard is expressed on a per unit basis. A standard might be viewed as the budgeted cost for one unit.
10-5 A variance is the difference between what was planned or expected and what was actually accomplished. A standard cost system has at least two types of variances. A price variance focuses on the difference between the standard price and the actual price of an input. A quantity variance is concerned with the difference between the standard quantity of the input allowed for the actual output and the actual amount of the input used.
10-6 Under management by exception, managers focus their attention on results that deviate from expectations. It is assumed that results that meet expectations do not require investigation.
10-7 Separating an overall variance into a price variance and a quantity variance provides more information. Moreover, price and quantity variances are usually the responsibilities of different managers.
10-8 The materials price variance is usually the responsibility of the purchasing manager. The materials quantity and labor efficiency variances are usually the responsibility of production managers and supervisors.
10-9 The materials price variance can be computed either when materials are purchased or when they are placed into production. It is usually better to compute the variance when materials are purchased since that is when the purchasing manager, who has responsibility for this variance, has completed his or her work. In addition, recognizing the price variance when materials are purchased allows the company to carry its raw materials in the inventory accounts at standard cost, which greatly simplifies bookkeeping.
10-10 This combination of variances may indicate that inferior quality materials were purchased at a discounted price, but the low-quality materials created production problems.
10-11 If standards are used to find who to blame for problems, they can breed resentment and undermine morale. Standards should not be used to find someone to blame for problems.
10-12 Several factors other than the contractual rate paid to workers can cause a labor rate variance. For example, skilled workers with high hourly rates of pay can be given duties that require little skill and that call for low hourly rates of pay, resulting in an unfavorable rate variance. Or unskilled or untrained workers can be assigned to tasks that should be filled by more skilled workers with higher rates of pay, resulting in a favorable rate variance. Unfavorable rate variances can also arise from overtime work at premium rates.
10-13 If poor quality materials create production problems, a result could be excessive labor time and therefore an unfavorable labor efficiency variance. Poor quality materials would not ordinarily affect the labor rate variance.
10-14 If overhead is applied on the basis of direct labor-hours, then the variable overhead efficiency variance and the direct labor efficiency variance will always be favorable or unfavorable together. Both variances are computed by comparing the number of direct labor-hours actually worked to the standard hours allowed. That is, in each case the formula is:
Efficiency Variance = SR(AH – SH)
Only the “SR” part of the formula, the standard rate, differs between the two variances.
10-15 A statistical control chart is a graphical aid that helps workers identify variances that should be investigated. Upper and lower limits are set on the control chart. Any variances falling between those limits are considered to be normal. Any variances falling outside of those limits are considered abnormal and are investigated.
10-16 If labor is a fixed cost and standards are tight, then the only way to generate favorable labor efficiency variances is for every workstation to produce at capacity. However, the output of the entire system is limited by the capacity of the bottleneck. If workstations before the bottleneck in the production process produce at capacity, the bottleneck will be unable to process all of the work in process. In general, if every workstation is attempting to produce at capacity, then work in process inventory will build up in front of the workstations with the least capacity.
10-17 A company’s balanced scorecard should be derived from and support its strategy. Since different companies have different strategies, their balanced scorecards should be different.
10-18 The balanced scorecard is constructed to support the company’s strategy, which is a theory about what actions will further the company’s goals. Assuming that the company has financial goals, measures of financial performance must be included in the balanced scorecard as a check on the reality of the theory. If the internal business processes improve, but the financial outcomes do not improve, the theory may be flawed and the strategy should be changed.
10-19 The difference between delivery cycle time and throughput time is the waiting period between when an order is received and when production on the order is started. Throughput time is made up of process time, inspection time, move time, and queue time. These four elements can be classified into value-added time (process time) and non-value-added time (inspection time, move time, and queue time).
10-20 An MCE of less than 1 means that the production process includes non-value-added time. An MCE of 0.40, for example, means that 40% of throughput time consists of actual processing, and that the other 60% consists of moving, inspection, and other non-value-added activities.
10-21 Formal entry tends to give variances more emphasis than off-the-record computations. And, the use of standard costs in the journals simplifies the bookkeeping process by allowing all inventories to be carried at standard, rather than actual, cost.
Exercise 10-1 (20 minutes)
1. |
Cost per 2 kilogram container |
6,000.00 |
Kr |
|
Less: 2% cash discount |
120.00 |
|
|
Net cost |
5,880.00 |
|
|
Add freight cost per 2 kilogram container (1,000 Kr ÷ 10 containers) |
100.00 |
|
|
Total cost per 2 kilogram container (a) |
5,980.00 |
Kr |
|
Number of grams per container (2 kilograms × 1000 grams per kilogram) (b) |
2,000 |
|
|
Standard cost per gram purchased (a) ÷ (b) |
2.99 |
Kr |
2. |
Alpha SR40 required per capsule as per bill of materials |
6.00 |
grams |
|
Add allowance for material rejected as unsuitable (6 grams ÷ 0.96 = 6.25 grams; 6.25 grams – 6.00 grams = 0.25 grams) |
0.25 |
grams |
|
Total |
6.25 |
grams |
|
Add allowance for rejected capsules (6.25 grams ÷ 25 capsules) |
0.25 |
grams |
|
Standard quantity of Alpha SR40 per salable capsule |
6.50 |
grams |
3. |
Item |
Standard Quantity per Capsule |
Standard Price per Gram |
Standard Cost per Capsule |
|
Alpha SR40 |
6.50 grams |
2.99 Kr |
19.435 Kr |
Exercise 10-2 (20 minutes)
1. |
Number of chopping blocks |
4,000 |
|
Number of board feet per chopping block |
× 2.5 |
|
Standard board feet allowed |
10,000 |
|
Standard cost per board foot |
× $1.80 |
|
Total standard cost |
$18,000 |
|
|
|
|
Actual cost incurred |
$18,700 |
|
Standard cost above |
18,000 |
|
Total variance—unfavorable |
$ 700 |
2. |
Actual Quantity of Inputs, at Actual Price |
|
Actual Quantity of Inputs, at Standard Price |
|
Standard Quantity Allowed for Output, at Standard Price |
||||||||||
|
(AQ × AP) |
|
(AQ × SP) |
|
(SQ × SP) |
||||||||||
|
$18,700 |
|
11,000 board feet × $1.80 per board foot |
|
10,000 board feet × $1.80 per board foot |
||||||||||
|
|
|
= $19,800 |
|
= $18,000 |
||||||||||
|
|
|
|
|
|
|
|
|
|||||||
|
Price Variance, $1,100 F |
Quantity Variance, $1,800 U |
|
||||||||||||
|
Total Variance, $700 U |
|
|||||||||||||
Alternatively:
Materials Price Variance = AQ (AP – SP)
11,000 board feet ($1.70 per board foot* – $1.80 per board foot) =
$1,100 F
*$18,700 ÷ 11,000 board feet = $1.70 per board foot.
Materials Quantity Variance = SP (AQ – SQ)
$1.80 per board foot (11,000 board feet – 10,000 board feet) =
$1,800 U
Exercise 10-3 (20 minutes)
1. |
Number of meals prepared |
6,000 |
|
|
Standard direct labor-hours per meal |
× 0.20 |
|
|
Total direct labor-hours allowed |
1,200 |
|
|
Standard direct labor cost per hour |
× $9.50 |
|
|
Total standard direct labor cost |
$11,400 |
|
|
|
|
|
|
Actual cost incurred |
$11,500 |
|
|
Total standard direct labor cost (above) |
11,400 |
|
|
Total direct labor variance |
$ 100 |
Unfavorable |
2. |
Actual Hours of Input, at the Actual Rate |
|
Actual Hours of Input, at the Standard Rate |
|
Standard Hours Allowed for Output, at the Standard Rate |
|||||||||||
|
(AH×AR) |
|
(AH×SR) |
|
(SH×SR) |
|||||||||||
|
1,150 hours × $10.00 per hour |
|
1,150 hours × $9.50 per hour |
|
1,200 hours × $9.50 per hour |
|||||||||||
|
= $11,500 |
|
= $10,925 |
|
= $11,400 |
|||||||||||
|
|
|
|
|
|
|
|
|
|
|||||||
|
Rate Variance, $575 U |
Efficiency Variance, $475 F |
|
|||||||||||||
|
Total Variance, $100 U |
|
||||||||||||||
Alternatively, the variances can be computed using the formulas:
Labor rate variance = AH(AR – SR)
= 1,150 hours ($10.00 per hour – $9.50 per hour)
= $575 U
Labor efficiency variance = SR(AH – SH)
= $9.50 per hour (1,150 hours – 1,200 hours)
= $475 F
Exercise 10-4 (20 minutes)
1. |
Number of items shipped |
140,000 |
|
|
Standard direct labor-hours per item |
× 0.04 |
|
|
Total direct labor-hours allowed |
5,600 |
|
|
Standard variable overhead cost per hour |
× $2.80 |
|
|
Total standard variable overhead cost |
$15,680 |
|
|
|
|
|
|
Actual variable overhead cost incurred |
$15,950 |
|
|
Total standard variable overhead cost (above) |
15,680 |
|
|
Total variable overhead variance |
$ 270 |
Unfavorable |
2. |
Actual Hours of Input, at the Actual Rate |
|
Actual Hours of Input, at the Standard Rate |
|
Standard Hours Allowed for Output, at the Standard Rate |
|||||||||||
|
(AH×AR) |
|
(AH×SR) |
|
(SH×SR) |
|||||||||||
|
5,800 hours × $2.75 per hour* |
|
5,800 hours × $2.80 per hour |
|
5,600 hours × $2.80 per hour |
|||||||||||
|
= $15,950 |
|
= $16,240 |
|
= $15,680 |
|||||||||||
|
|
|
|
|
|
|
|
|
|
|||||||
|
Variable overhead spending variance, $290 F |
Variable overhead efficiency variance, $560 U |
|
|||||||||||||
|
Total variance, $270 U |
|
||||||||||||||
*$15,950÷ 5,800 hours =$2.75 per hour
Alternatively, the variances can be computed using the formulas:
Variable overhead spending variance:
AH(AR – SR) = 5,800 hours ($2.75 per hour – $2.80 per hour)
= $290 F
Variable overhead efficiency variance:
SR(AH – SH) = $2.80 per hour (5,800 hours – 5,600 hours)
= $560 U
Exercise 10-5 (45 minutes)
1. MPC’s previous manufacturing strategy was focused on high-volume production of a limited range of paper grades. The goal of this strategy was to keep the machines running constantly to maximize the number of tons produced. Changeovers were avoided because they lowered equipment utilization. Maximizing tons produced and minimizing changeovers helped spread the high fixed costs of paper manufacturing across more units of output. The new manufacturing strategy is focused on low-volume production of a wide range of products. The goals of this strategy are to increase the number of paper grades manufactured, decrease changeover times, and increase yields across non-standard grades. While MPC realizes that its new strategy will decrease its equipment utilization, it will still strive to optimize the utilization of its high fixed cost resources within the confines of flexible production. In an economist’s terms the old strategy focused on economies of scale while the new strategy focuses on economies of scope.
2. Employees focus on improving those measures that are used to evaluate their performance. Therefore, strategically-aligned performance measures will channel employee effort towards improving those aspects of performance that are most important to obtaining strategic objectives. If a company changes its strategy but continues to evaluate employee performance using measures that do not support the new strategy, it will be motivating its employees to make decisions that promote the old strategy, not the new strategy. And if employees make decisions that promote the new strategy, their performance measures will suffer.
Some performance measures that would be appropriate for MPC’s old strategy include: equipment utilization percentage, number of tons of paper produced, and cost per ton produced. These performance measures would not support MPC’s new strategy because they would discourage increasing the range of paper grades produced, increasing the number of changeovers performed, and decreasing the batch size produced per run.
Exercise 10-5 (continued)
3. Students’ answers may differ in some details from this solution.
Financial
Sales
Contribution margin per ton
+
+


Customer
Number of new
customers acquired
+


Time to fill
an order
Customer satisfaction with breadth of product offerings
–
+


Internal Business Process
Number of different paper grades produced
+
Average change-over time
Average manufacturing yield
–
+


Learning and
Growth
Number of employees trained to support the flexibility strategy
+
Exercise 10-5 (continued)
4. The hypotheses underlying the balanced scorecard are indicated by the arrows in the diagram. Reading from the bottom of the balanced scorecard, the hypotheses are:
° If the number of employees trained to support the flexibility strategy increases, then the average changeover time will decrease and the number of different paper grades produced and the average manufacturing yield will increase.
° If the average changeover time decreases, then the time to fill an order will decrease.
° If the number of different paper grades produced increases, then the customer satisfaction with breadth of product offerings will increase.
° If the average manufacturing yield increases, then the contribution margin per ton will increase.
° If the time to fill an order decreases, then the number of new customers acquired, sales, and the contribution margin per ton will increase.
° If the customer satisfaction with breadth of product offerings increases, then the number of new customers acquired, sales, and the contribution margin per ton will increase.
° If the number of new customers acquired increases, then sales will increase.
Each of these hypotheses can be questioned. For example, the time to fill an order is a function of additional factors above and beyond changeover times. Thus, MPC’s average changeover time could decrease while its time to fill an order increases if, for example, the shipping department proves to be incapable of efficiently handling greater product diversity, smaller batch sizes, and more frequent shipments. The fact that each of the hypotheses mentioned above can be questioned does not invalidate the balanced scorecard. If the scorecard is used correctly, management will be able to identify which, if any, of the hypotheses are invalid and modify the balanced scorecard accordingly.
Exercise 10-6 (20 minutes)
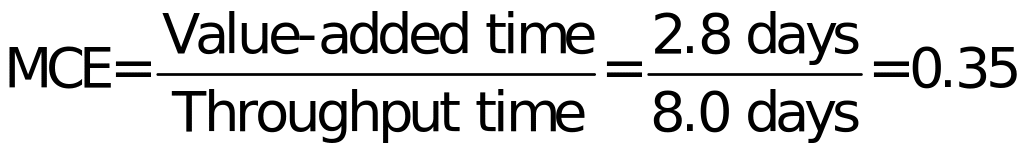
1. |
Throughput time |
= |
Process time + Inspection time + Move time + Queue time |
|
|
= |
2.8 days + 0.5 days + 0.7 days + 4.0 days |
|
|
= |
8.0 days |
2. Only process time is value-added time; therefore the manufacturing cycle efficiency (MCE) is:
3. If the MCE is 35%, then the complement of this figure, or 65% of the time, was spent in non-value-added activities.
4. |
Delivery cycle time |
= |
Wait time + Throughput time |
|
|
= |
16.0 days + 8.0 days |
|
|
= |
24.0 days |
5. If all queue time in production is eliminated, then the throughput time drops to only 4 days (0.5 + 2.8 + 0.7). The MCE becomes:

Thus, the MCE increases to 70%. This exercise shows quite dramatically how the lean production approach can improve operations and reduce throughput time.
Exercise 10-7 (20 minutes)
1. The general ledger entry to record the purchase of materials for the month is:
|
Raw Materials (15,000 meters at $5.40 per meter) |
81,000 |
|
|
Materials Price Variance (15,000 meters at $0.20 per meter U) |
3,000 |
|
|
Accounts Payable (15,000 meters at $5.60 per meter) |
|
84,000 |
2. The general ledger entry to record the use of materials for the month is:
|
Work in Process (12,000 meters at $5.40 per meter) |
64,800 |
|
|
Materials Quantity Variance (100 meters at $5.40 per meter F) |
|
540 |
|
Raw Materials (11,900 meters at $5.40 per meter) |
|
64,260 |
3. The general ledger entry to record the incurrence of direct labor cost for the month is:
|
Work in Process (2,000 hours at $14.00 per hour) |
28,000 |
|
|
Labor Rate Variance (1,950 hours at $0.20 per hour U) |
390 |
|
|
Labor Efficiency Variance (50 hours at $14.00 per hour F) |
|
700 |
|
Wages Payable (1,950 hours at $14.20 per hour) |
|
27,690 |
Exercise 10-8 (20 minutes)
1. The standard price of a kilogram of white chocolate is determined as follows:
|
Purchase price, finest grade white chocolate |
£9.00 |
|
Less purchase discount, 5% of the purchase price of £9.00 |
(0.45) |
|
Shipping cost from the supplier in Belgium |
0.20 |
|
Receiving and handling cost |
0.05 |
|
Standard price per kilogram of white chocolate |
£8.80 |
2. The standard quantity, in kilograms, of white chocolate in a dozen truffles is computed as follows:
|
Material requirements |
0.80 |
|
Allowance for waste |
0.02 |
|
Allowance for rejects |
0.03 |
|
Standard quantity of white chocolate |
0.85 |
3. The standard cost of the white chocolate in a dozen truffles is determined as follows:
|
Standard quantity of white chocolate (a) |
0.85 |
kilogram |
|
Standard price of white chocolate (b) |
£8.80 |
per kilogram |
|
Standard cost of white chocolate (a) × (b) |
£7.48 |
|
Exercise 10-9 (30 minutes)
1. a. Notice in the solution below that the materials price variance is computed on the entire amount of materials purchased, whereas the materials quantity variance is computed only on the amount of materials used in production.
Actual Quantity of Inputs, at Actual Price |
|
Actual Quantity of Inputs, at Standard Price |
|
Standard Quantity Allowed for Output, at Standard Price |
|||||||||||||
(AQ × AP) |
|
(AQ × SP) |
|
(SQ × SP) |
|||||||||||||
70,000 diodes × $0.28 per diode |
|
70,000 diodes × $0.30 per diode |
|
40,000 diodes* × $0.30 per diode |
|||||||||||||
= $19,600 |
|
= $21,000 |
|
= $12,000 |
|||||||||||||
|
|
|
|
|
|
|
|
|
|||||||||
|
Price Variance, $1,400 F |
|
|
||||||||||||||
|
50,000 diodes × $0.30 per diode = $15,000 |
|
|||||||||||||||
|
|
|
|
||||||||||||||
|
|
Quantity Variance, $3,000 U |
|
||||||||||||||
*5,000 toys × 8 diodes per toy = 40,000 diodes
Alternative Solution:
Materials Price Variance = AQ (AP – SP)
70,000 diodes ($0.28 per diode – $0.30 per diode) = $1,400 F
Materials Quantity Variance = SP (AQ – SQ)
$0.30 per diode (50,000 diodes – 40,000 diodes) = $3,000 U
Exercise 10-9 (continued)
b. Direct labor variances:
-
Actual Hours of Input, at the Actual Rate
Actual Hours of Input, at the Standard Rate
Standard Hours Allowed for Output, at the Standard Rate
(AH × AR)
(AH × SR)
(SH × SR)
$48,000
6,400 hours × $7 per hour
6,000 hours* × $7 per hour
= $44,800
= $42,000
Rate Variance, $3,200 U
Efficiency Variance, $2,800 U
Total Variance, $6,000 U
*5,000 toys × 1.2 hours per toy = 6,000 hours
Alternative Solution:
Labor Rate Variance = AH (AR – SR)
6,400 hours ($7.50* per hour – $7.00 per hour) = $3,200 U
*$48,000 ÷ 6,400 hours = $7.50 per hour
Labor Efficiency Variance = SR (AH – SH)
$7 per hour (6,400 hours – 6,000 hours) = $2,800 U
Exercise 10-9 (continued)
2. A variance usually has many possible explanations. In particular, we should always keep in mind that the standards themselves may be incorrect. Some of the other possible explanations for the variances observed at Topper Toys appear below:
Materials Price Variance Since this variance is favorable, the actual price paid per unit for the material was less than the standard price. This could occur for a variety of reasons including the purchase of a lower grade material at a discount, buying in an unusually large quantity to take advantage of quantity discounts, a change in the market price of the material, and particularly sharp bargaining by the purchasing department.
Materials Quantity Variance Since this variance is unfavorable, more materials were used to produce the actual output than were called for by the standard. This could also occur for a variety of reasons. Some of the possibilities include poorly trained or supervised workers, improperly adjusted machines, and defective materials.
Labor Rate Variance Since this variance is unfavorable, the actual average wage rate was higher than the standard wage rate. Some of the possible explanations include an increase in wages that has not been reflected in the standards, unanticipated overtime, and a shift toward more highly paid workers.
Labor Efficiency Variance Since this variance is unfavorable, the actual number of labor hours was greater than the standard labor hours allowed for the actual output. As with the other variances, this variance could have been caused by any of a number of factors. Some of the possible explanations include poor supervision, poorly trained workers, low-quality materials requiring more labor time to process, and machine breakdowns. In addition, if the direct labor force is essentially fixed, an unfavorable labor efficiency variance could be caused by a reduction in output due to decreased demand for the company’s products.
Exercise 10-10 (20 minutes)
1. |
Actual Quantity of Inputs, at Actual Price |
|
Actual Quantity of Inputs, at Standard Price |
|
Standard Quantity Allowed for Output, at Standard Price |
||||||||||
|
(AQ × AP) |
|
(AQ × SP) |
|
(SQ × SP) |
||||||||||
|
20,000 ounces × $2.40 per ounce |
|
20,000 ounces × $2.50 per ounce |
|
18,000 ounces* × $2.50 per ounce |
||||||||||
|
= $48,000 |
|
= $50,000 |
|
= $45,000 |
||||||||||
|
|
|
|
|
|
|
|
|
|||||||
|
Price Variance, $2,000 F |
Quantity Variance, $5,000 U |
|
||||||||||||
|
Total Variance, $3,000 U |
|
|||||||||||||
*2,500 units × 7.2 ounces per unit = 18,000 ounces
Alternatively:
Materials Price Variance = AQ (AP – SP)
20,000 ounces ($2.40 per ounce – $2.50 per ounce) = $2,000 F
Materials Quantity Variance = SP (AQ – SQ)
$2.50 per ounce (20,000 ounces – 18,000 ounces) = $5,000 U
Exercise 10-10 (continued)
2. |
Actual Hours of Input, at the Actual Rate |
|
Actual Hours of Input, at the Standard Rate |
|
Standard Hours Allowed for Output, at the Standard Rate |
||||||||||
|
(AH × AR) |
|
(AH × SR) |
|
(SH × SR) |
||||||||||
|
$10,800 |
|
900 hours × $10 per hour |
|
1,000 hours* × $10 per hour |
||||||||||
|
|
|
= $9,000 |
|
= $10,000 |
||||||||||
|
|
|
|
|
|
|
|
|
|||||||
|
Rate Variance, $1,800 U |
Efficiency Variance, $1,000 F |
|
||||||||||||
|
Total Variance, $800 U |
|
|||||||||||||
*2,500 units × 0.4 hour per unit = 1,000 hours
Alternatively:
Labor Rate Variance = AH (AR – SR)
900 hours ($12 per hour* – $10 per hour) = $1,800 U
*10,800 ÷ 900 hours = $12 per hour
Labor Efficiency Variance = SR (AH – SH)
$10 per hour (900 hours – 1,000 hours) = 1,000 F
Exercise 10-11 (15 minutes)
Notice in the solution below that the materials price variance is computed on the entire amount of materials purchased, whereas the materials quantity variance is computed only on the amount of materials used in production.
Actual Quantity of Inputs, at Actual Price |
|
Actual Quantity of Inputs, at Standard Price |
|
Standard Quantity Allowed for Output, at Standard Price |
|||||||||||
(AQ × AP) |
|
(AQ × SP) |
|
(SQ × SP) |
|||||||||||
20,000 ounces × $2.40 per ounce |
|
20,000 ounces × $2.50 per ounce |
|
14,400 ounces* × $2.50 per ounce |
|||||||||||
= $48,000 |
|
= $50,000 |
|
= $36,000 |
|||||||||||
|
|
|
|
|
|
|
|
|
|||||||
|
Price Variance, $2,000 F |
|
|
||||||||||||
|
16,000 ounces × $2.50 per ounce = $40,000 |
|
|||||||||||||
|
|
|
|
||||||||||||
|
|
Quantity Variance, $4,000 U |
|
||||||||||||
*2,000 bottles × 7.2 ounces per bottle = 14,400 ounces
Alternatively:
Materials Price Variance = AQ (AP – SP)
20,000 ounces ($2.40 per ounce – $2.50 per ounce) = $2,000 F
Materials Quantity Variance = SP (AQ – SQ)
$2.50 per ounce (16,000 ounces – 14,400 ounces) = $4,000 U
Exercise 10-12 (30 minutes)
1. |
Number of units manufactured |
20,000 |
|
Standard labor time per unit (24 minutes ÷ 60 minutes per hour) |
× 0.4 |
|
Total standard hours of labor time allowed |
8,000 |
|
Standard direct labor rate per hour |
× $6 |
|
Total standard direct labor cost |
$48,000 |
|
|
|
|
Actual direct labor cost |
$49,300 |
|
Standard direct labor cost |
48,000 |
|
Total variance—unfavorable |
$ 1,300 |
2. |
Actual Hours of Input, at the Actual Rate |
|
Actual Hours of Input, at the Standard Rate |
|
Standard Hours Allowed for Output, at the Standard Rate |
||||||||||
|
(AH × AR) |
|
(AH × SR) |
|
(SH × SR) |
||||||||||
|
$49,300 |
|
8,500 hours × $6 per hour |
|
8,000 hours* × $6 per hour |
||||||||||
|
|
|
= $51,000 |
|
= $48,000 |
||||||||||
|
|
|
|
|
|
|
|
|
|||||||
|
Rate Variance, $1,700 F |
Efficiency Variance, $3,000 U |
|
||||||||||||
|
Total Variance, $1,300 U |
|
|||||||||||||
*20,000 units × 0.4 hour per unit = 8,000 hours
Alternative Solution:
Labor Rate Variance = AH (AR – SR)
8,500 hours ($5.80 per hour* – $6.00 per hour) = $1,700 F
*$49,300 ÷ 8,500 hours = $5.80 per hour
Labor Efficiency Variance = SR (AH – SH)
$6 per hour (8,500 hours – 8,000 hours) = $3,000 U
Exercise 10-12 (continued)
3. |
Actual Hours of Input, at the Actual Rate |
|
Actual Hours of Input, at the Standard Rate |
|
Standard Hours Allowed for Output, at the Standard Rate |
||||||||||
|
(AH × AR) |
|
(AH × SR) |
|
(SH × SR) |
||||||||||
|
$39,100 |
|
8,500 hours × $4 per hour |
|
8,000 hours × $4 per hour |
||||||||||
|
|
|
= $34,000 |
|
= $32,000 |
||||||||||
|
|
|
|
|
|
|
|
|
|||||||
|
Spending Variance, $5,100 U |
Efficiency Variance, $2,000 U |
|
||||||||||||
|
Total Variance, $7,100 U |
|
|||||||||||||
Alternative Solution:
Variable Overhead Spending Variance = AH (AR – SR)
8,500 hours ($4.60 per hour* – $4.00 per hour) = $5,100 U
*$39,100 ÷ 8,500 hours = $4.60 per hour
Variable Overhead Efficiency Variance = SR (AH – SH)
$4 per hour (8,500 hours – 8,000 hours) = $2,000 U
Exercise 10-13 (45 minutes)
1. Students’ answers may differ in some details from this solution.
Financial
Profit margin
+

Revenue per employee
Sales
+
+


Customer
Number of new
customers acquired
+


Customer satisfaction with
effectiveness
Customer satisfaction with
efficiency
Customer satisfaction with
service quality
+
+
+