

398 Agric. Econ. Czech, 59, 2013 (9): 396–402
Table 1. Paired sample statistics of the selected economic indicators

|
|
Mean |
N |
Std. deviation |
Std. error mean |
|
Pair 1 |
BC_proceeds |
26 655.2 |
10 |
6 916.75126 |
2 187.26880 |
|
AC_proceeds |
23 801.2 |
10 |
3 716.64953 |
1 175.30778 |
|
|
|
|
|||||
Pair 2 |
BC_added_value |
5 959.2 |
10 |
1 117.57205 |
353.40731 |
|
AC_ added_value |
7 416.0 |
10 |
999.57135 |
316.09222 |
|
|
|
|
|||||
Pair 3 |
BC_subsidies |
5 992.5 |
8 |
2 768.04433 |
978.65146 |
|
AC_ subsidies |
6 031.8 |
8 |
2 648.49336 |
936.38381 |
|
|
|
|
|||||
Pair 4 |
BC_labor_costs |
4 891.8 |
10 |
744.33353 |
235.37893 |
|
AC_labor_costs |
6 381.0 |
10 |
741.68187 |
234.54040 |
|
|
|
|
|||||
Pair 5 |
BC_mng_results |
1 043.2 |
10 |
888.25494 |
280.89088 |
|
AC_mng_results |
-398.6 |
10 |
1 153.09576 |
364.64089 |
|
|
|
|
|||||
Pair 6 |
BC_profit_share |
77.1 |
8 |
9.21858 |
3.25926 |
|
AC_profit_share |
65.5 |
8 |
12.44416 |
4.39968 |
|
|
|
|
|||||
|
|
|
||||
Pair 1 |
= Proceeds from the sale of own products and services per ha agricultural land (SKK/ha a.l.) |
|
||||
Pair 2 |
= Added value per ha a.l. (SKK/ha a.l.) |
|
|
|
|
|
Pair 3 |
= Subsidies granted (since 2005 all Subsidies granted) per ha a.l. (SKK/ha a.l.) |
|
|
|||
Pair 4 |
= Labour costs per ha a.l. (SKK/ha a.l.) |
|
|
|
|
|
Pair 5 |
= Management results per ha a.l. (SKK/ha a.l.) |
|
|
|
|
|
Pair 6 |
= Share of profit making enterprises (amount) |
|
|
|
|
|
Source: author’s calculation and research processing
The management result progress in the period has a similar development in both analysed legal form groups. There are differences in the value of the parameter. The business companies (BC) were reaching a better result per hectare of agricultural land from 925 to 3072 SKK/ha a.l., than agricultural cooperatives (AC). The summary of values of the
analyzed parameters is presented in the Table 1 and Table 2.
Due to the fact, that in the analysis of companies, there we take into account only those utilising land, it is not possible to conclude that the better results of companies in all measured parameters are determined by a very low to zero acreage of farmland.
Table 2. Results of the t-test paired testing

|
|
|
Paired differences |
|
|
|
|
|
||
|
|
|
std. |
std. error |
95% confidence interval |
t |
df |
Sig. |
|
|
|
|
mean |
of the difference |
(2-tailed) |
|
|||||
|
|
|
|
|
||||||
|
|
|
deviation |
mean |
lower |
upper |
|
|
|
|
|
|
|
|
|
|
|
|
|
||
Pair 1 |
BC_proceeds |
2 854.00 |
3 484.04 |
1 101.75 |
361.67 |
5 346.33 |
2.590 |
9 |
0.029 |
|
AC_proceeds |
|
|||||||||
Pair 2 |
BC_added_value |
–1 456.80 |
806.41 |
255.01 |
–2 033.67 |
–879.93 |
–5.713 |
9 |
0.000 |
|
AC_added_value |
|
|||||||||
Pair 3 |
BC_subsidies |
–39.25 |
519.42 |
183.64 |
–473.50 |
395.00 |
–0.214 |
7 |
0.837 |
|
AC_subsidies |
|
|||||||||
Pair 4 |
BC_labor_costs |
–1 489.20 |
174.17 |
55.08 |
–1 613.79 |
–1 364.61 |
–27.039 |
9 |
0.000 |
|
|
AC_labor_costs |
|
|
|
|
|
|
|
|
|
Pair 5 |
BC_mng_result |
1 441.80 |
669.45 |
211.70 |
962.90 |
1 920.70 |
6.811 |
9 |
0.000 |
|
AC_mng_result |
|
|||||||||
Pair 6 |
BC_profit_share |
11.63 |
4.27 |
1.51 |
8.05 |
15.20 |
7.693 |
7 |
0.000 |
|
AC_profit_share |
|
|||||||||
Source: author’s calculation and research processing
AGRIC. ECON. CZECH, 59, 2013 (9): 396–402 399
However, since the sample of subjects represents only a selected file data, the application of the method of statistical induction is required for the results generalization (Table 2).
The results of the testing of the congruence of mean values, except for one of the tested parameter (amount of subsidies per ha a.l.), enables us to reject the zero hypotheses on the mean values congruence.
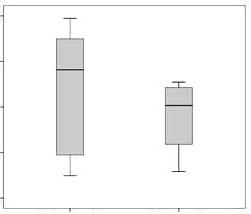
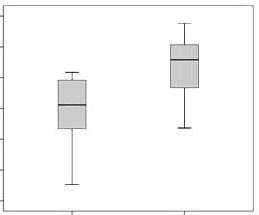
Our claim is that the economic performance of the subjects utilising land is conclusively determined by the legal status of the subjects. The subjects formed as business companies reach in the parameters of proceeds from the sale of own products and services per ha a.l., added value per ha a.l., labour costs per ha a.l., management results per ha a.l. as well as of the share of profit making enterprises significantly
35 000 |
|
9 000 |
|
|
|
|
|
|
|
|
|
8 000 |
|
|
30 000 |
|
7 000 |
|
|
|
|
|
|
|
25 000 |
|
6 000 |
|
|
|
|
5 000 |
|
|
20 000 |
|
4 000 |
|
|
|
|
|
|
|
15 000 |
|
3 000 |
|
|
BC_proceeds |
AC_proceeds |
BC_added_value |
AC_added_value |
|
10 000 |
|
8 000 |
|
|
|
|
|
|
|
8 000 |
|
7 000 |
|
|
|
|
|
|
|
6 000 |
|
6 000 |
|
|
|
|
|
|
|
|
|
5 000 |
|
|
4 000 |
|
|
|
|
|
|
4 000 |
|
|
BC_subsidies |
AC_subsidies |
BC_labor_costs |
AC_labor_costs |
|
2 000 |
|
90 |
|
|
|
|
|
|
|
|
|
80 |
|
|
0 |
|
70 |
|
|
–2 000 |
|
60 |
|
|
|
|
|
|
|
|
|
50 |
|
|
–4 000 |
|
40 |
|
|
BC_mng_result |
AC_mng_result |
BC_profit_share |
AC_profit_share |
|
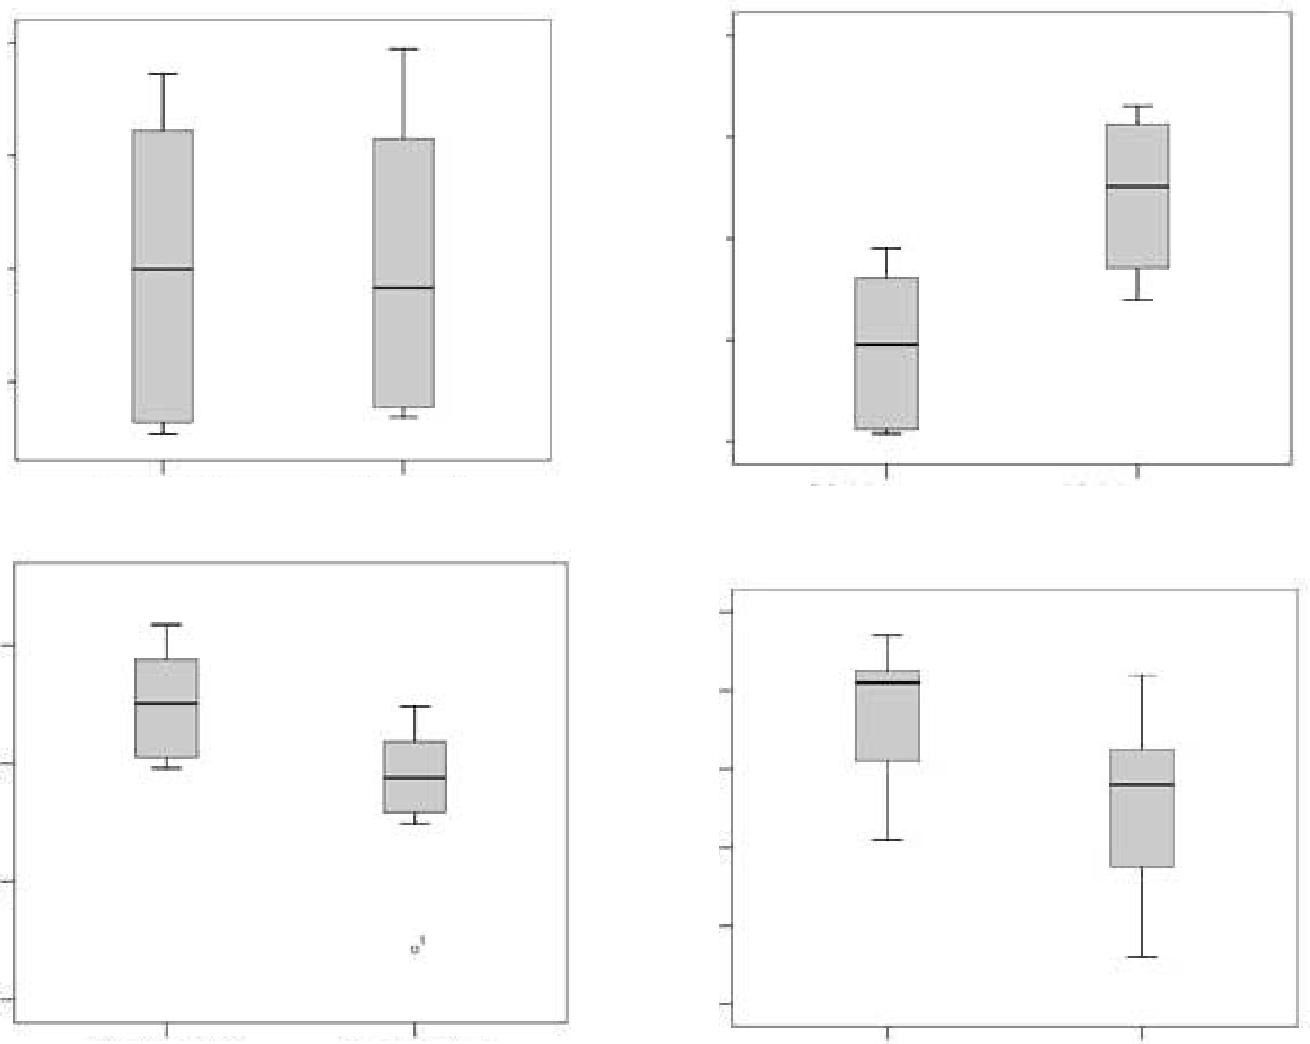
Figure 2. Box plots of the analyzed economic parameters according to legal status
Source: author’s calculation and research processing