

Graph №11 – New Zealand Official Cash Rate (ocr)36
The graph above shows the development of the level of OCR since the date of start (March 1999) to this day (the latest Monetary Policy Statement for the complete year is dated 11 December 2013). In this section, I will briefly describe some of the more notable changes in the level of OCR. Before that, however, I would like to point out that overall level of OCR since the beginning has remained relatively low and not subject to wild swings which characterized, for instance, the interest rates in some other countries.
The graph has one X axis and two value (Y) axes.
The X axis has points in time, when the Reserve Bank of New Zealand was considering the changes in the Official Cash Rate (OCR).
The first Y axis (on the left) shows the actual OCR rates – these are set at least eight times per year. The Bank is not obliged to change them every time or indeed, at any time.
The second Y axis (on the right) measures the direction of the change. Everything above the Zero line on the second Y axis represent an increase in the OCR. Everything below this line is a rate reduction. Points at the level of the line represent decisions not to change the OCR.
The actual OCR values are represented by shaded columns, and the changes in OCR at the same point in time are represented by the green line.
The following sections comment on the more significant moves by the Reserve Bank of New Zealand in the conduct of its monetary policy:
December 2005. This is the first rate change I would like to examine in more detail. In December 2005 the Reserve Bank of New Zealand increased the OCR to its highest level on record, 7.25 per cent. As it was stated in the Monetary Policy Assessment of the time, there were considerable worries by the Bank that the dangers of inflation were persisting37. Although the exporters were already suffering from the relatively high exchange rate (around 1.44 New Zealand dollars for 1 USD), still the overall demand was very high and big pressures on productive capacity existed. The main source of pressure was household demand38. From the Keynesian cross proposition, this results in running down of inventories because of the inability of the producers to cope with the demand.
This situation can be proved by the official statistics taken from the site of the Reserve Bank of New Zealand which is shown on the graph below39. On this graph there are two value (Y) axes. The primary (left) Y-axis shows production-based and expenditure-based GDP. Expenditure-based GDP can be assumed to equal aggregate demand. The secondary (right) Y-axis shows the changes in inventories. Time period is on the horizontal (X) axis.
Graph №12 Production and Expenditure-Based GDP (Graphical presentation and compilation by Nikita Stopnikov)
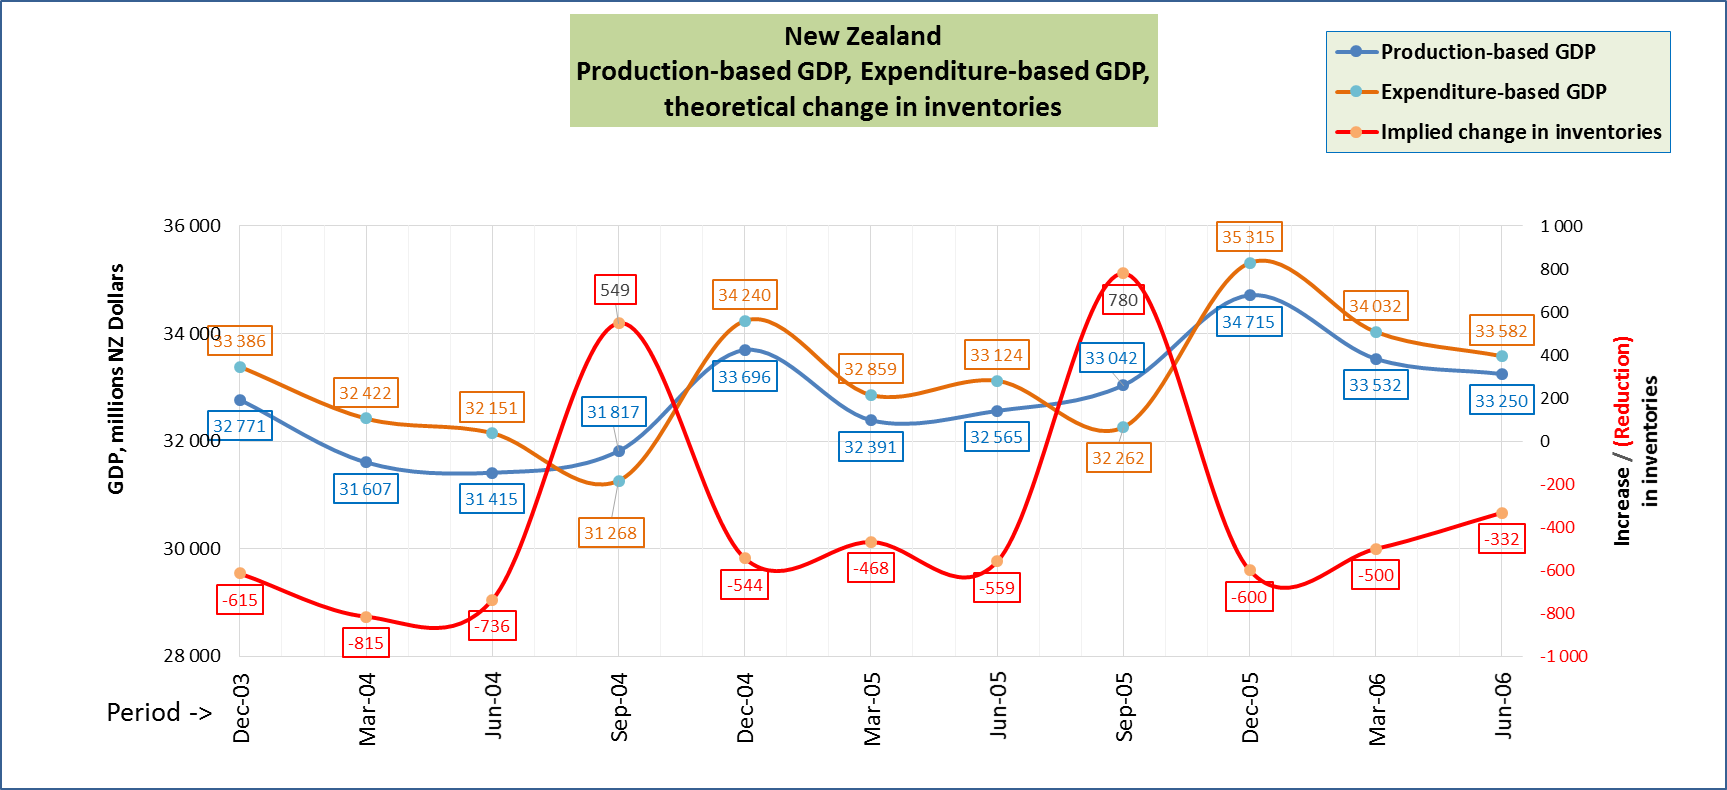
It can be observed from the data, that for most of the time except September 2004 and September 2005 quarter ends, expenditure-based GDP was consistently higher than the production-based GDP. I have specially taken a longer period to demonstrate that demand pressures were not one-time but long-term. High inflation was also evident in the labour costs. The Bank saw this as a danger because inflation expectations could become locked in (embedded) in the economy and disinflation would be especially difficult if this happened. The Bank further stated that further increase in the OCR might be needed depending on how the housing market and demand in general respond to the increase40. If the demand did not slow down, the rates could go up again. The Bank also said that it did not see any prospect of the rates going down in the foreseeable future. It specifically mentioned the situation to the left of the Keynesian Cross, where household and business demand have been very strong in recent years, outstripping growth in the economy’s productive capacity. The labour market was also very strong, with the unemployment rates dropping to their “20-year low of 3.4 per cent”41. Note that currently the unemployment rate in the Russian Federation is around 5 per cent, in the USA – around 7 per cent, in the UK – around 7.2 per cent, and in the Eurozone as a whole – over 10 per cent. The Russian Federation rate of unemployment is considered very moderate against some other G-8 countries. Accordingly, in this context, New Zealand figures can be considered zero unemployment.
June 2007. At this point in time, the Reserve Bank of New Zealand increased the OCR again, this time to a record 8% level. It would not be long before the Bank increases the rate again, to the new record level of 8.25 per cent, and this rate would persist until the 3rd quarter of 2008, until such time when it became evident that the world’s financial system was facing an unprecedented crisis. Then the Bank moved fast, reducing the rate to the record low of 2.5 per cent in the space of nine months. Back to 2007, The Bank of New Zealand stated in its Monetary Policy document, that the economic expansion was more than a temporary phenomenon, and this was proved by the economic indicators in the first half of 2007. The economy’s resources, in the Bank’s own language, became “particularly stretched”42. Another significant change to the outlook for the economy has been the dramatic increase in the world dairy prices. Dairy products have been and still are the single biggest export item for New Zealand (almost ¼ of all exports). One can remember the rise in commodity prices in general (such as oil hitting $140 per barrel) during the 2007-2008 period, and of food prices in particular, with surging demand from China and other East Asian nations. As far as the dairy prices were concerned, they had risen by almost 60% for the six months to June 200743. However, this surge in food prices creates issues for the monetary policy, especially since the economy was already facing high inflation for some time. This is because, in the Bank’s opinion, high dairy prices would not increase the economy’s productive capacity, and higher inflation generally would be the only effect of the high dairy prices. The overall risk assessment by the Bank of the inflation outlook was that inflation could spill over into the other sectors of the economy (including housing construction). In addition, both the nominal and trade-weighted exchange rate of New Zealand dollar were very high (nominal rate was around 1.32 New Zealand dollar for 1 USD). This was hurting the New Zealand exporters. The labour market showed no sign of weakening and unemployment remained below the 4 per cent level. Again, almost a zero unemployment scenario. The businesses in New Zealand had a difficult time finding either skilled or unskilled labour. As an example, the Bank quotes the survey of the business firms, according to which in the summer of 2007, the percentage of employers, saying it was difficult to find skilled labour, exceeded the percentage of those who said finding skilled labour was easy, by almost 40 percentage points. “Consequently, little spare capacity remains in the labour market…”44 It is no surprise, therefore, that the Bank acted in the same way as most central banks do when the economy overheats, and raised the Official Cash Rate again.
December 2008. This period is very different to the ones briefly described earlier. At this time, most of the world was in the financial crisis. The crisis started as the housing market crash in the United States, and quite soon, many European and Asian countries followed. There are many views as to the reasons for this crisis. However, most commentators agree that one of the main causes for the crisis was the fact, that the financial system became so complicated, that it became extremely difficult even for the professionals to assess risks of dealing with counterparties properly. At some point, it became so complicated to assess risks, that in order to prevent losses, transactions were simply stopped. This situation left many investors with assets, which they purchased for the anticipated increase in value but now this value was impossible to determine, and transactions simply could not take place anymore. It should be noted, that the OCR decision to reduce was not the first one in the economic cycle (there were rate reductions starting from early June 2008). However, the reduction in December 2008 of 1.5 percentage points from 6.5 to 5.0 per cent was the biggest in history (there would be another one of the same size later in January 2009). In the foreword to the Monetary Policy Statement, the Governor Mr. Alan Bollard directly pointed to the “ongoing financial markets turmoil and the marked deterioration in the outlook for global growth have played a large role in shaping today’s decision. Activity in most of our trading partners is now expected to contract or grow only very slowly over the next few quarters”45. The economic background in New Zealand for this decision was as follows:
The overall activity in New Zealand economy slowed down from the beginning of 2008. The Bank directly pointed out that New Zealand moved rather quickly from the position where resources were stretched to the position where considerable slack was building up46;
The consumers reduced their spending rather drastically. As we remember, this may be a good and virtuous thing for an individual household, but when most of them do the same thing, this may create a rather dangerous situation in the overall economy, where aggregate demand almost disappears, huge inventories are building up quickly and are unwanted, producers therefore cut production and real GDP is substantially below its potential level;
Firms cut back their investment decisions in a big way. Many firms also cut back the hours of their employees, and started to fire the workforce to reduce costs. The weather did not help as New Zealand had an unusually dry summer with falling agricultural production as a result;
New Zealand’s main trading partners were all having a similarly hard time, developed countries already in a severe recession, and Asian partners slowing their growth significantly. Therefore exports were facing a much lower demand than previously;
Because of the chaos in the financial markets, the amount of loanable funds available to households and businesses, had reduced considerably compared to 2007.
Business confidence had fallen very low as a result.
It was natural, therefore, that extraordinary actions were required on the part of the Bank and the Government. Interestingly, the Bank even made a reference to the other policy, although it has nothing to do with the Bank, as if acknowledging that the situation was indeed extraordinary: “Fiscal policy is expected to provide some offset to these negative factors, reflecting a combination of ongoing growth in government consumption and investment spending, and larger and earlier personal tax cuts”47. Note that all the policy methods available to the Government and the regulator are now promised to be employed: taxation stimulus, increase in Government spending as part of the fiscal policy, and a 1.5 per cent cut in the OCR by the Reserve Bank – in the monetary policy.
March 2011. It is no coincidence that I have selected this period of time for a review of the Monetary Policy actions by the Reserve Bank of New Zealand. On the 22nd of February 2011, a devastating earthquake struck the city of Christchurch. This is the second-largest city in New Zealand and it is called “The Garden City” by the people of the country. It is situated in the eastern part of the Southern Island of the country. As a result of the earthquake, severe damage was caused to properties and livelihoods of the people, and there was also considerable disruption in the economy. Moreover, this was not the first earthquake. A smaller earthquake had struck the city five months before, in September of 2010. The Reserve Bank of New Zealand in the March 2011 Monetary Policy Statement reduced the OCR rate to 2.5 per cent. The Bank had thus described the background to its decision:
Often the decisions have to be taken based on limited information. The Bank admitted that it was too early to predict how the situation would develop after the earthquake, and described the March 2011 Policy Statement as a “thematic representation of the thinking behind the policy decision rather than a strict prediction of the future”48.
Households were still going through very difficult times. People were trying to reduce the levels of debt. This put severe limits on consumer aggregate demand.
The housing market was experiencing the opposite of the period of 2006-2007 – in most parts of the country house prices were falling. This is good for first-time purchasers because more of them can afford to start their first home. But this is quite bad for those who already have a mortgage with many years of repayment ahead of them, because this slows down the labour force mobility and ability to start new jobs.
Many businesses in the area discontinued their operations after the earthquake;
If there were any investment projects planned in Christchurch and Canterbury area in general, these projects would be postponed for a long time;
Tourism was severely negatively affected, both from other parts of the country and from abroad;
On the other hand, because of the two earthquakes over a short period of time, the Bank expected the construction activity to grow because of the rebuilding that had to take place49.
The Bank stated that the total impact of the earthquake would take some time to materialize, but overall there was the risk of the negative impact on economic activity being quite substantial. In these circumstances, the step to reduce OCR by 0.5 percentage points had to be looked at as a risk-reducing measure. The Bank also noted that because many people now preferred the variable rate mortgages and loans to fixed-rate loans (only natural because of the overall downward trend in interest rates), it now took less time for the effect of its policy decisions to be felt by businesses and households.
December 2013. This is the most recent decision by the Reserve Bank of New Zealand on the Official Cash Rate closing the year, and also the last one examined in this paper. In its latest Monetary Policy Statement the Bank left the Official Cash Rate unchanged at 2.5 per cent. The economic background to this decision is as follows:
Overall the economic trend of New Zealand is positive. The economy continues to expand.
The inflation, measured by the CPI index had fallen to all-time lows previously in the year to September but lately had picked up to around 1.4 per cent (the most recent figure is 1.6 per cent). This is still relatively low because the target range of the Bank is 1 to 3 per cent. Accordingly, the inflation rate is still in the lower half of the corridor (below the Bank’s target midpoint of 2 per cent).
The forecast GDP growth is quite healthy – at 3 per cent for the 2013 year. This is better than most of the other developed economies – that of the United States, Japan, all of the Eurozone, and higher even than some of the previously faster-growing economies of the Eastern Europe (most notably, the Russian Federation);
The housing and construction market have both displayed excellent growth. One of the reasons was the reconstruction effort after the earthquake in Canterbury in February 2011. This led to the rise in house prices. Another factor contributing to the rise in house prices is the net migration. New Zealanders are quick to relocate to Australia in difficult times but they are equally very responsive to good prospects re-appearing back home50.
The Reserve Bank of New Zealand introduced restrictions on mortgage lending in October 2013. Previously borrowers were able to obtain loans for houses, which had high loan-to-value ratio. That is, if the value of the house was NZ$100,000 individuals were able to borrow (say) NZ$90,000 providing only NZ$10,000 of own funds (10%). The similar situation in the United States was prevailing up to the middle of 2007, when people could borrow 100% (and even more!) of their house value, in the hope that the property prices would continue to rise indefinitely. This phenomenon is at least partly to blame for the effect of the crisis on the households. They simply borrowed too much on a security that did not increase in price as they expected! The Bank of New Zealand estimated that these restrictions would help to bring down the average house price inflation by between 1 and 4 per cent51.
The improved outlook for the New Zealand economy resulted in the high exchange rate of the New Zealand dollar. (Note on the exchange rate graph that the value of the currency is fluctuating around 1.20 New Zealand dollars for 1 USD. It is important to note here, that the economic outlook is judged relative to the New Zealand’s trading partners, and not as an absolute measure. The high exchange rate continues to present problems for exporters, but on the other hand, it has anti-inflationary impact on import prices52.
The Bank indicated also that in light of the recent developments and overall inflationary pressures, it may be necessary to reduce or discontinue the monetary policy incentives because the inflation threat is considered significant. At the same time, the Bank justified its actions of keeping the Official Cash Rate so low for so long, by the fact that the economy is growing in a healthy way, the inflation is low so there is no need to fight it.
The Bank was following closely the actions of the other central banks in the developed world, most notably the Federal Reserve, which left the monetary policy incentives unchanged, and the European Central Bank, which made perhaps the final reduction a month earlier from 0.5 percent to 0.25 per cent, and also those of Japan, Canada, Australia, and the UK.
The situation in the domestic borrowing changed significantly, with borrowers changing from variable rate loans back into fixed rate loans. This is only natural when the overall levels of interest rates are so low.
The Bank also outlined the macroeconomic outlook for the New Zealand economy for the near future, something usually done at the end of the year Monetary Policy Statement. The Bank stated that the domestic economy was going well, but was cautioning against the resource pressures building up at this stage of the economic cycle, a similar warning to end of 2005, many of 2006 and the examined June 2007 Statements. It repeated the central theme that the monetary policy incentive in the form of ultra-low OCR may be discontinued at any time, and future increases in the OCR will help against inflation53.
Besides the OCR graph, which has been discussed in some detail above, I would like to present another graph below and only comment very briefly.
Graph №13 - New Zealand major macroeconomic indicators together

Data combined by Nikita Stopnikov.
As one can see, this graph is a combined graph. During my research, I decided to put together on one graph the four major macroeconomic indicators that we have covered during the macroeconomics course: Gross Domestic Product (GDP), Official Cash Rate (OCR) being the best substitute for the principal monetary policy instrument, the Consumer Price Index (CPI) being the most commonly used measure of annual inflation rate, and Unemployment rate.
It is noticeable that overall the figures do show some correlation, either positive or negative is correlated with others and firstly, I would like to mention the correlation between OCR and GDP rates.
Previously I covered the topic of the World Financial Crisis in 2008, and it is necessary to mention this topic again. Because of the World Financial Crisis the GDP growth rate has declined by almost 5.8 percentage points (from approximately 3.6 per cent growth in mid-2007 to minus 2.2 per cent by mid-2009. Approximately three months after the decline in GDP growth became evident (most probably after the quarterly statistics were reported), the Reserve Bank took action by steady reductions in the OCR. It has declined by 5.75 percentage points (from 8.25 to 2.5 per cent between Q3 2007 and Q3 2012). Note that the unemployment during the same period rose by more than 3 percentage points (from graph –from 3.5 per cent to 7.2 per cent). By this, we are able to confirm with real data the straight-line or reverse relationship between some of the economic indicators. The main purpose of this graph is to show how the crisis can affect the wealth of the country.