

Equipment, materials and pictorial means
Optical metallurgical microscope 5...6
Templets with pipe, porosity, cracks and other defects 1...2 (with the each defect)
Specimens with fatigue, tough and brittle fractures 2 (of the each type)
Macrosections after cold or hot working 3...4
Macroetched sections of steels
(grades 10, 25, 45, У7, У10, У13),
chilled, malleable and grey cast irons 1...2 (of the each alloy)
Macro- and microstructures of steels
and cast irons (photographs) 1...2 (of the each alloy)
The work must be executed as follows. Investigate surface defects on parts and specimens, external appearance of various fractures and become skilful at their classification. Examine templets of cast steel and steel after cold or hot working; defects in metals, disclosed by means of microanalysis.
Develop skills in distinguishing the components that constitute steel and cast iron structure. Analyse the influence of carbon on quantity and mutual ratio of structural components in steel. Estimate the graphite shape parameter (index) – ratio of the maximal dimension of graphite inclusions to the minimal one, – in grey, malleable and nodular cast irons. Plot the graph of the tensile strength and the relative elongation as a function of the graphite shape parameter (apply the data from the table 1.1). Make a conclusion how the shape of graphite inclusions influences the cast iron strength and plasticity.
Contents of the report. Characterize briefly fatigue, intermediate, tough and brittle fractures, as well as steels’ microstructure; exhibit microstructures of hypoeutectoid, eutectoid and hypereutectoid steels, grey, malleable and nodular cast irons (scketches). Make brief inference about carbon effect on the mutual ratio of structural components in steel and the influence of graphite shape on strength and plasticity of cast iron.
1.2 Determination of strength and plasticity of alloys
Purpose of the work: to develop practical skills at tensile strength test technique; to study the determination of strength and plasticity indices by means of stress-strain diagrams and by measurement of specimens; to plot graphic dependences of tensile strength and plasticity upon carbon content in steel and analyze them.
Theory. Strength is the resistance of a material to deformation and failure. Plasticity is its ability to withstand a permanent deformation (remaining after the removal of the deforming load) without failure.
Tension tests determine the strength properties; proportional limit, yield point (physical or conventional), ultimate or tensile strength and true strength, as well as the plasticity (ductility) indices: percent or relative elongation and reduction in area.
Tension tests are conducted on standard specimens mainly of round or square cross section with the initial gage length l0 of 50 mm and 10 mm in diameter (Fig. 1.6a). It is possible to use specimens of other dimensions. Shape and dimentions of the specimens are determined by GOST 1497-84.
Testing machines have an instrument that records the stress-strain diagram, i.e. the change in length of a specimen versus the applied load (Fig. 1.6b). Characteristic points are obtained from the stress-strain diagram, that enable to determine indices of mechanical properties. At the beginning of the test the elongation is proportional to the applied load (the portion from the point 0 to the point A). The law of proportionality is valid up to a certain load that corresponds to the point A. The stress calculated for this load is called the proportional limit:
p = Pp/F0 , MPa
where Pp is ultimate load the law of proportionality is valid up to;
F0 is initial cross-sectional area of the specimen.
When the load exceeds the proportional limit the law of proportionality is violated. But the strain still remains elastic, i.e. strain that disappears when the load is removed. The elastic limit is frequently defined as the stress at which the residual strain reaches a certain value, such as 0.005% of the initial length of the specimen. This limit is obtained at the point B of the diagram that corresponds to the load Pe. The elastic limit is calculated for this load on the basis of the initial cross-sectional area of the specimen:
e = Pe/F0 , MPa
At an increase in load above Pe, the relationship between the load and the elongation deviates and will no longer be linear. The straight line of the diagram becomes a curve and, at a certain load, a horizontal step is sometimes observed. This step (portion CD) indicates that the metal is elongated (yields) without any increase in the load. The stress corresponding to the load Py (point C) is called the yield point (physical):
у = Pу/F0 , MPa
The most materials (especially brittle) do not have a clear-cut yield step. For such diagrams the conventional yield point is defined as the stress at which the specimen acquires a permanent elongation equal to 0.2% of the initial gage length (Fig. 1.6c). It is denoted by 0.2:
0.2 = P0.2/F0 , MPa
The stress corresponding to the maximal load preceding failure of the specimen (point E) is called the ultimate strength or tensile strength:
u = Pu/F0 , MPa
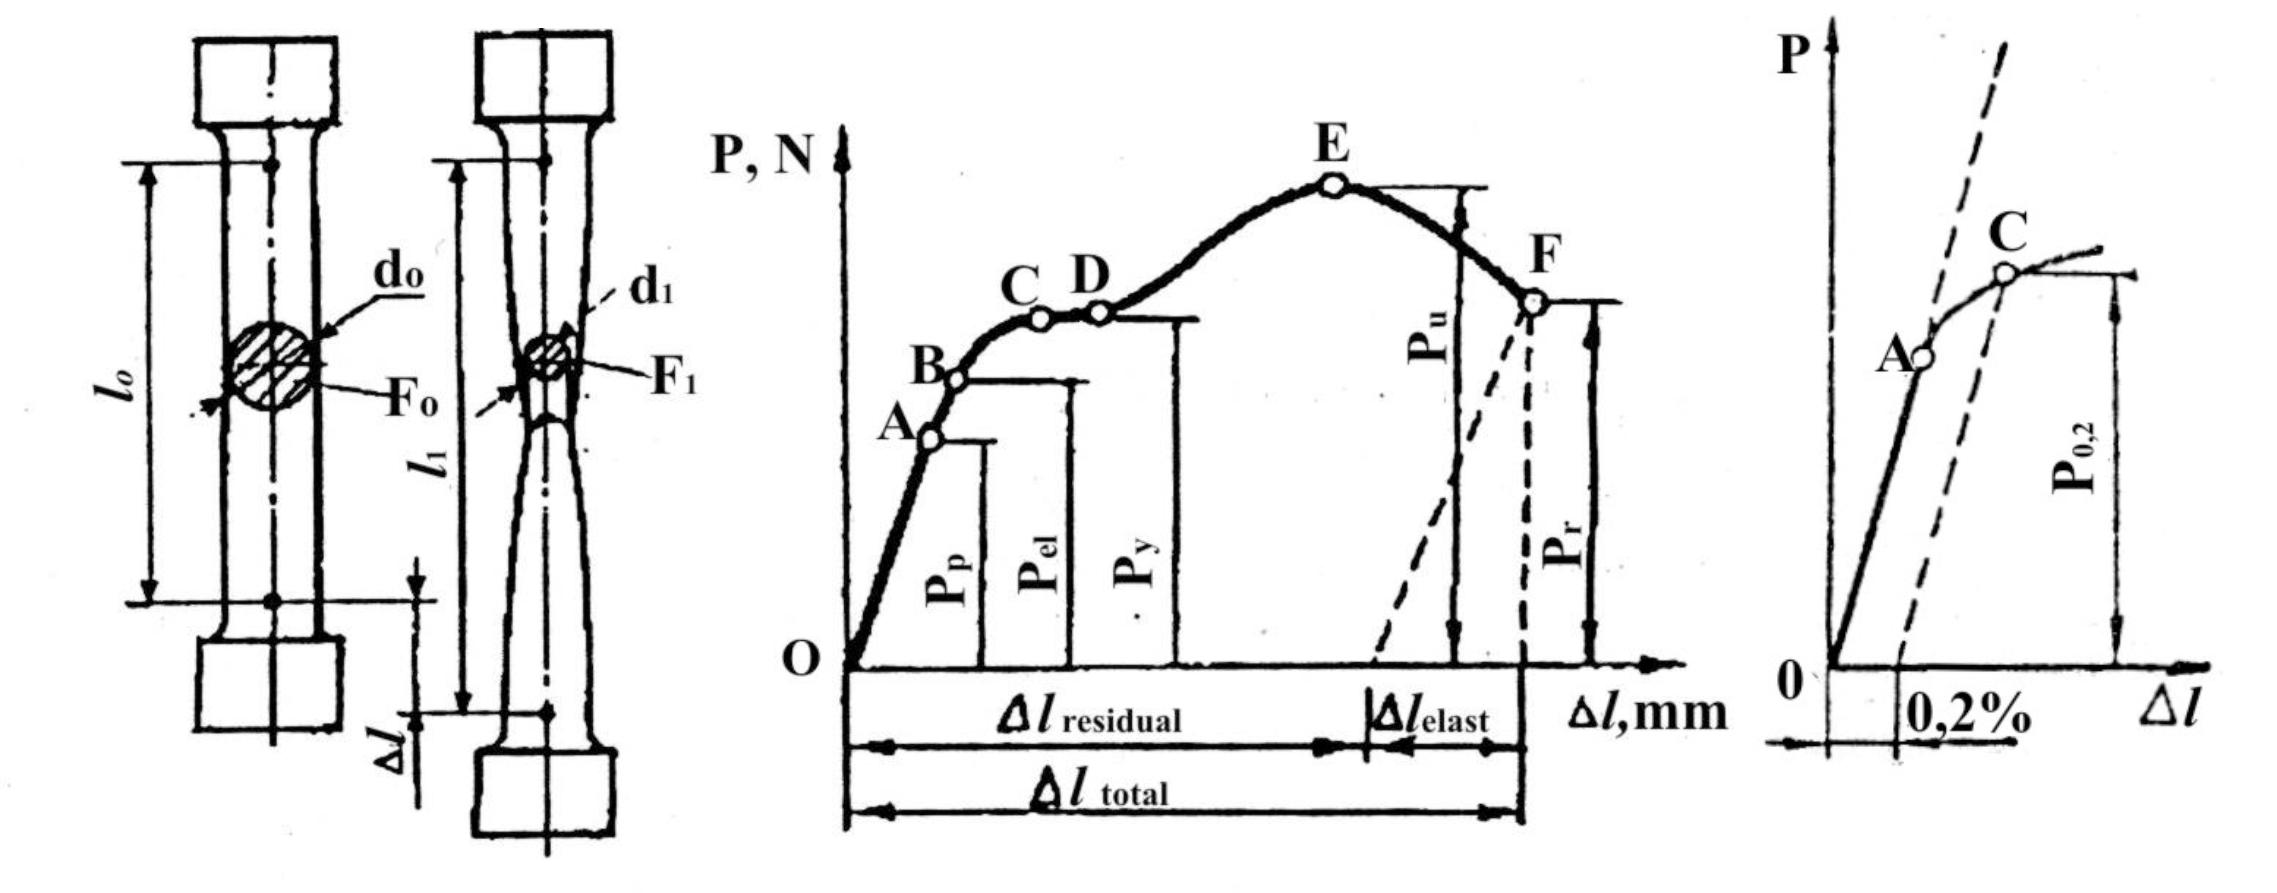
a b c
Fig. 1.6. Specimen for tests (a); stress-strain diagram obtained after tension test on a ductile metal (b); principle of a conventional yield point determination (c)
Load decrease after the point D relates to localized reduction of the cross-sectional area, called necking, appeared on specimens of ductile materials. The load drops (portion EF), but the stress increases. The true or instantaneous stress Sf is found by division the load at the failure instant Pf by the cross-sectional area of the specimen at the same instant F1:
Sf = Pf/F1 , MPa
According to the measurements of the specimens before and after tests plasticity (ductility) indices are determined. The percent elongation is defined as the following ratio:
= (l1 – 10)100/l0, %,
where l0 is initial gage length, mm;
l1 is gage length of the speciment after fracture, mm.
The reduction in area is determined by the formula:
=(F0 – F1) 100 / F0, %,
where F0 and Ff are the initial cross-sectional area and the cross sectional area of the specimen after fracture, correspondently.