

Triaxial strength testing
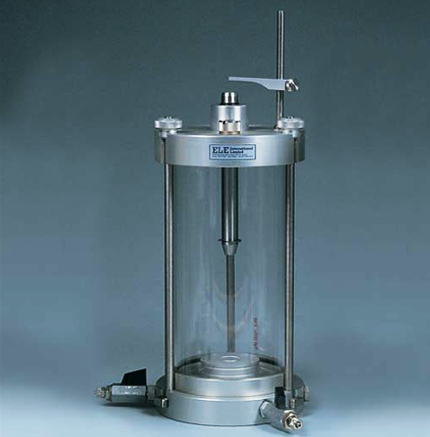
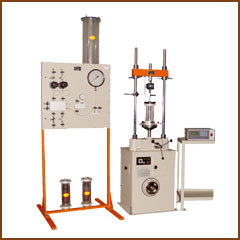
This test is similar to USC test but triaxial strength testing is carried out with range of different confining stress. Specimen is prepared with similar conditions that are discussed above in introduction. After that sample is mounted in rubber sleeve and then in triaxial cell designed by Hoek et al (1968) (figure 7). Further this system is placed to testing machine (figure 8). Hoek cell can take into itself core with height/diameter ratios of 2-2.5:1 [1]. There is an oil-filled space between steel walls and rubber sleeve in the cell. This oil is generated confining pressure by means of pump that capable to create a stress up to 70 MN/ . The stiffness of the testing machine is approximately 4900 kN/mm. Because of this additional deformation of rock that generates with stored energy in the machine is almost absent.
Figure 7. Triaxial cell |
Figure 8. Triaxial testing machine |
There are two types of techniques in that test. One consists of standard single point, other technique named multi-failure state test. In the single point technique the sample is pressured by confining stress at the selected level that further is maintained. After that axial load is applied to specimen and value of the load is the same as constant confining pressure. Then axial load is increased to sample failure at maximum strength.
In the multi-failure test it can possible to obtain several stress points of the failure from one core specimen. The testing procedure includes the serial use of the axial load and confining stress until the latter reaches a pre-selected level [1].
The results of single point technique are represented in the figures 9, 10. And relationship between axial load and axial displacement from multi-failure state test is represented in figure 11.
|
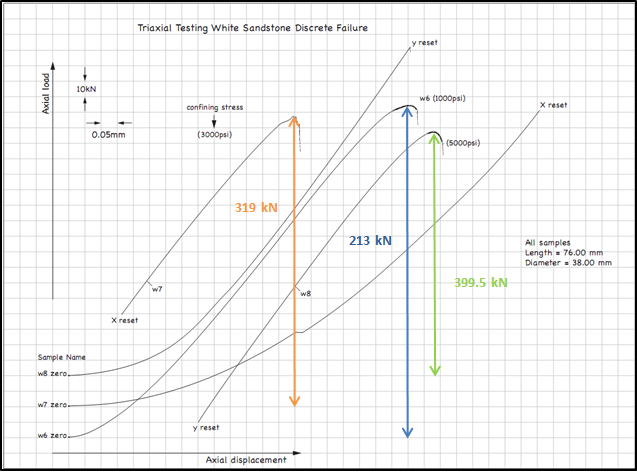
Figure 9. Triaxial testing white sandstone discrete failure
|
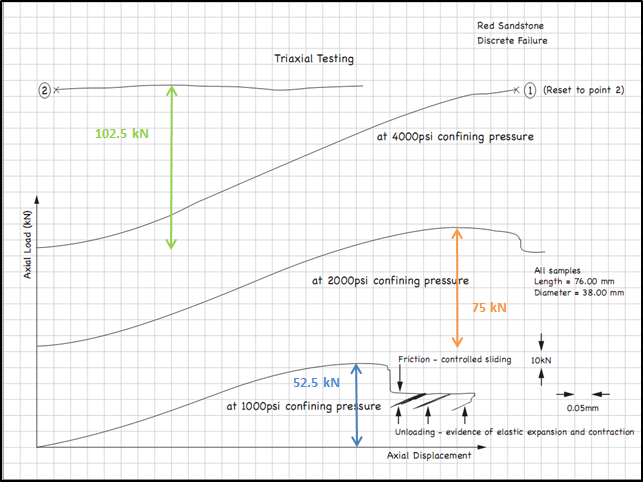
Figure 10. Triaxial testing red sandstone discrete failure
|
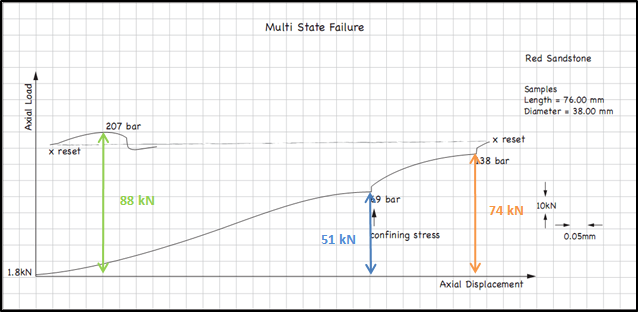
Figure 11. Triaxial testing red sandstone multi state failure
It should be noted that shear and normal stress acting on any plane within sample. And they always lie on a Mohr’s circle (figure 12).
|

Figure 12. Mohr’s circle
According to
figure 12 it can possible to find :
:
|
(6) |
|
(7) |


where
 – radius of the Mohr’s circle;
 – central point of the Mohr’s
circle on
– central point of the Mohr’s
circle on
 axis;
axis;
Type of test and material |
R |
Area |
№ of sample |
Axial load, kN |
Axial stress - σ₁, MN/ |
Confining stress - σ₃, MN/ |
|
Confining stress, psi |
Center of the Morh circle |
White Sandstone |
0.019 |
0.00113 |
w6 |
213 |
187.907 |
6.895 |
90.506 |
1000 |
97.401 |
w7 |
319 |
281.419 |
20.684 |
130.367 |
3000 |
151.052 |
|||
w8 |
399.5 |
352.436 |
34.474 |
158.981 |
5000 |
193.455 |
|||
Red Stone |
0.019 |
0.00113 |
1 |
52.5 |
46.315 |
6.895 |
19.710 |
1000 |
26.605 |
2 |
75 |
66.164 |
13.790 |
26.187 |
2000 |
39.977 |
|||
3 |
102.5 |
90.425 |
27.579 |
31.423 |
4000 |
59.002 |
|||
Red Stone (Multi state test) |
0.019 |
0.00113 |
1 |
51 |
44.9918 |
6.9 |
19.0459 |
1000 |
25.9459 |
2 |
74 |
65.28221 |
13.8 |
25.74111 |
2000 |
39.54111 |
|||
3 |
88 |
77.6329 |
20.7 |
28.46645 |
3000 |
49.16645 |

Table 4. Results of triaxial testing analysis
It should be noted that relationship between shear and normal stress must generate a straight line that touches each of the Mohr’s circles at only one point. As a result it can possible to determinate cohesion – C and internal fraction angle – tan φ (figure 13).
|
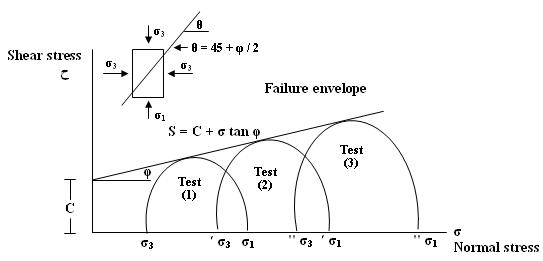
Figure 13. Determination the cohesion and internal fraction angle by means of Mohr’s circle
These procedures of determination the cohesion and internal fraction angle for all cases in task are represented at figures 14,15,16.
|
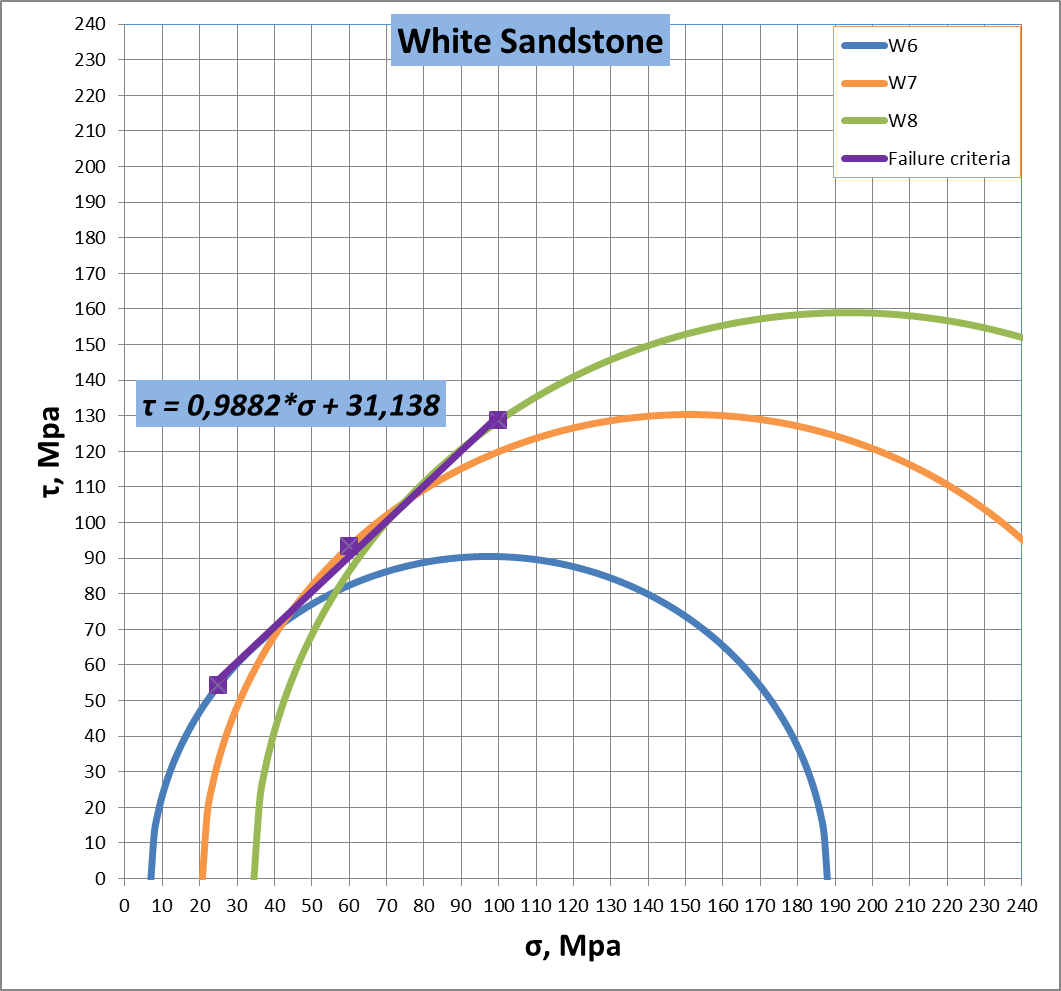
Figure 14. Determination the cohesion and internal fraction angle for white sandstone
|
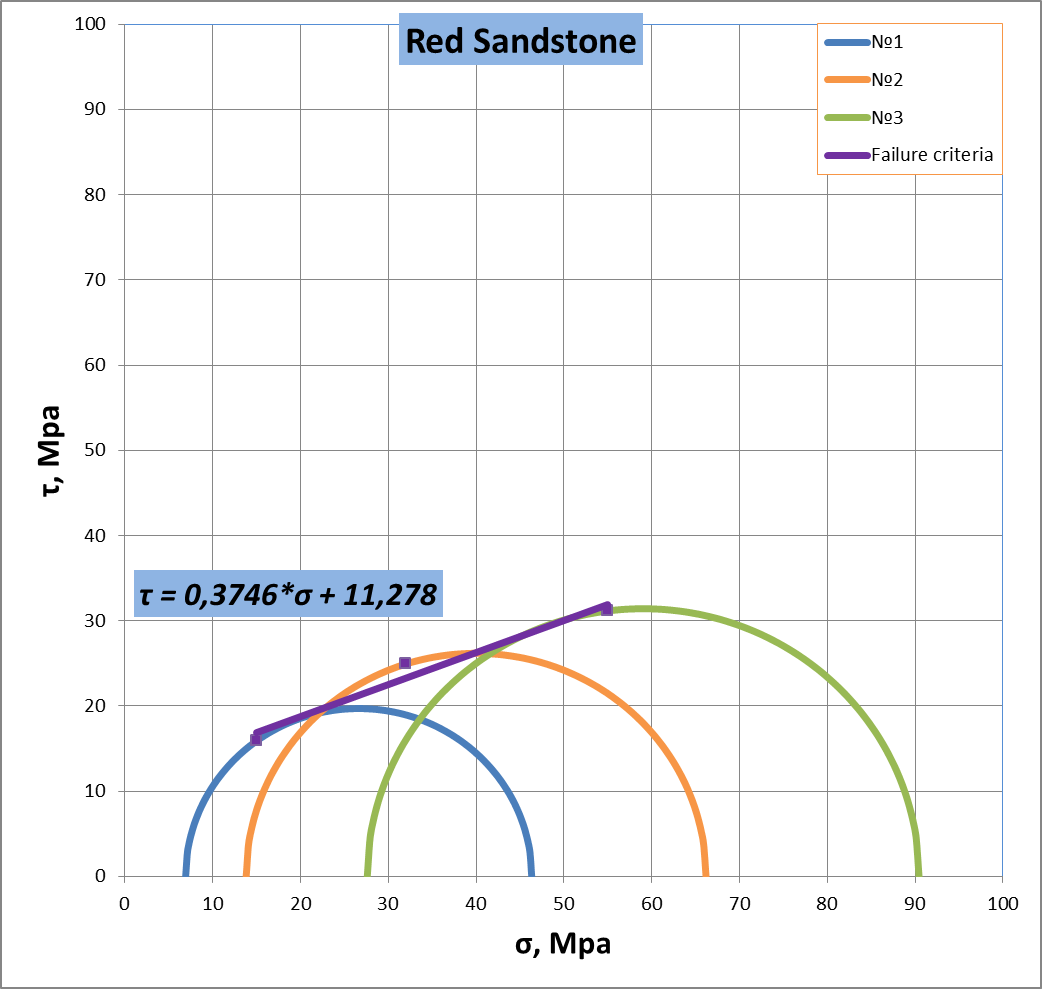
Figure 15. Determination the cohesion and internal fraction angle for red sandstone
|
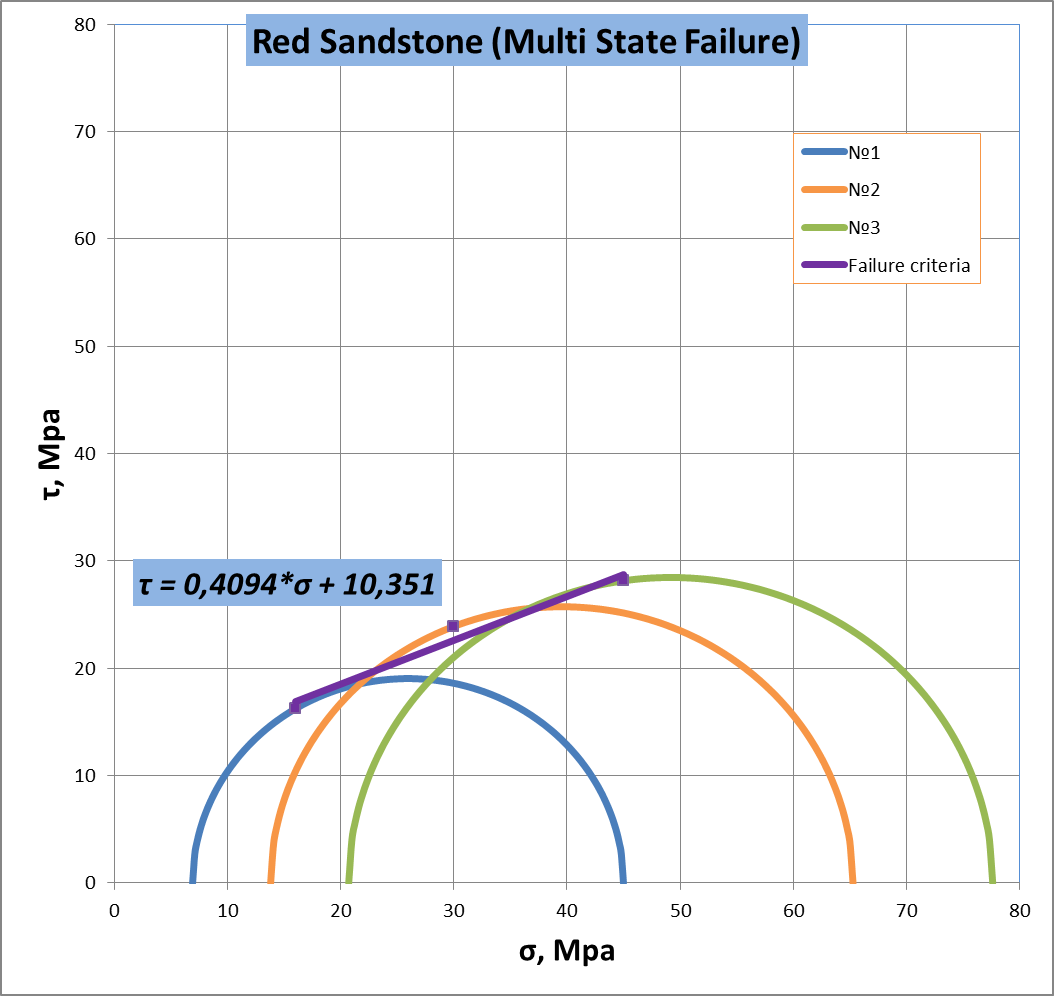
Figure 15. Determination the cohesion and internal fraction angle for red sandstone (multi state failure)
It should be noted that during determination of internal fraction angle it can possible to define the triaxial factor – k from next equation:
|
(7) |

The same value
of k can be derived by means of relationship between
 (figures 16, 17, 18). The
 is
unconfined compressive strength.
is
unconfined compressive strength.
|
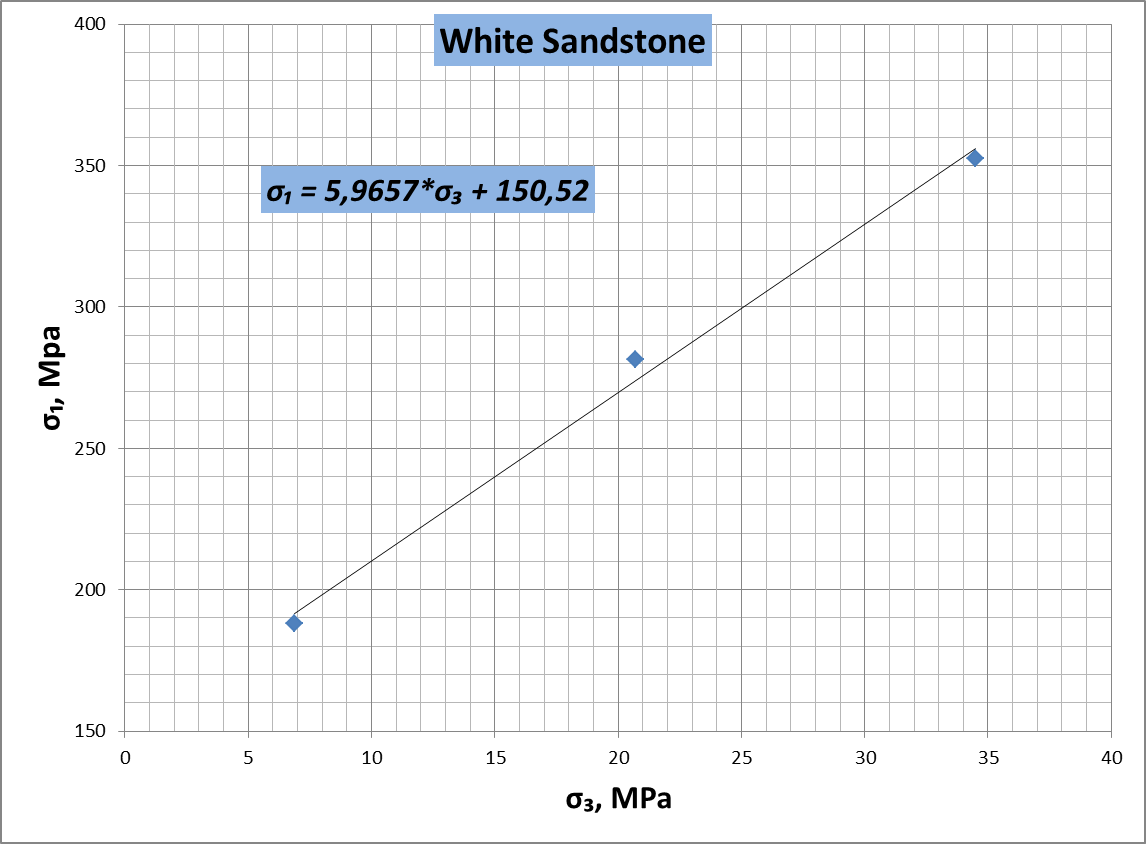
Figure 16. Relationship between for white sandstone
|
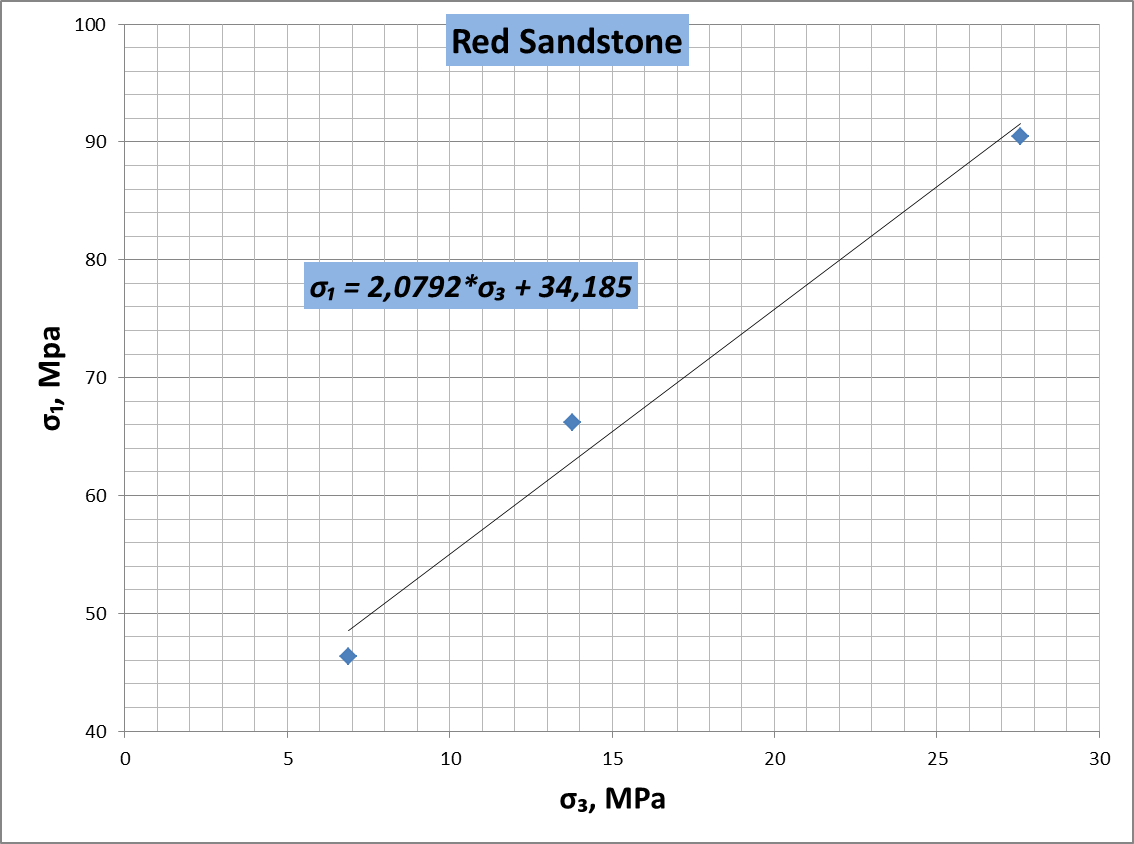
Figure 17. Relationship between for red sandstone
|
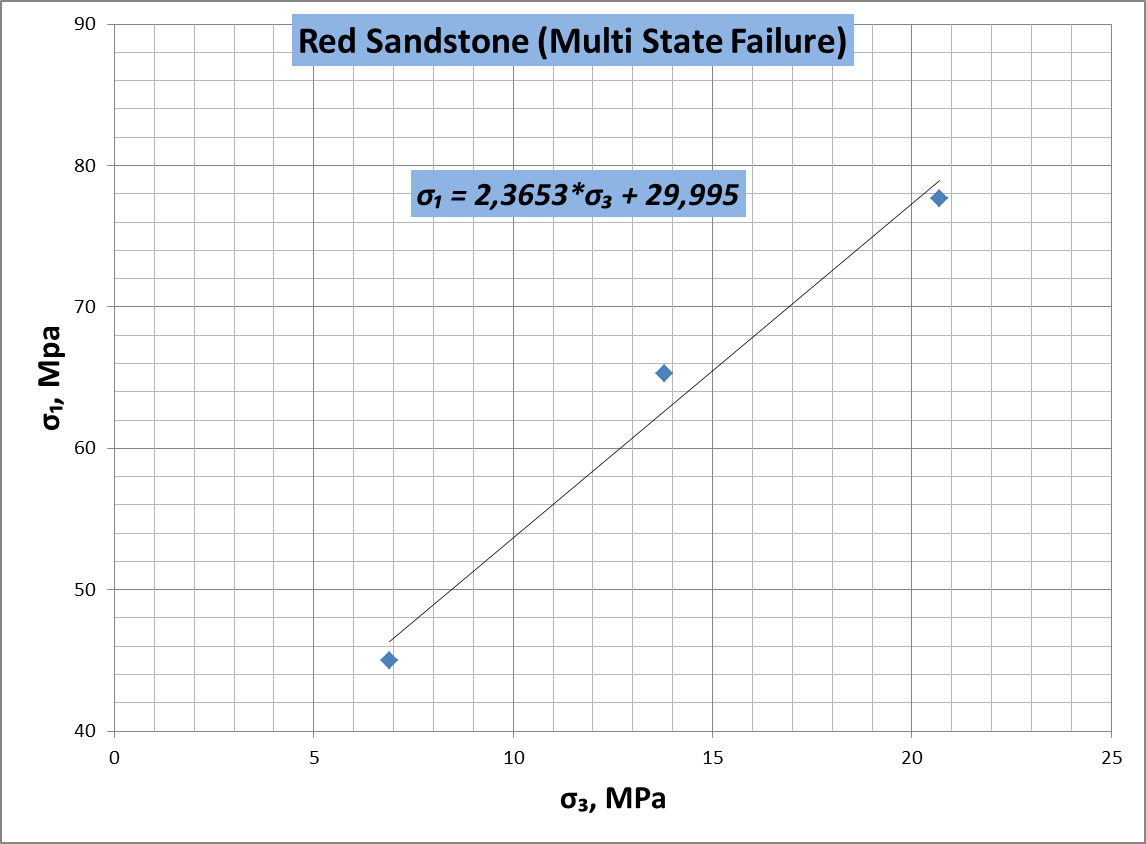
Figure 18. Relationship between for red sandstone (Multi State Failure)