

|
Institute of Petroleum Engineering Heriot-Watt Approved Support Centre TPU Msc Reservoir evaluation and Management 2013-2014 |

Rock mechanics laboratory testing report
Ilya I. Alekhin
Contents:
ROCK MECHANICS LABORATORY TESTING 1
Contents: 2
Introduction 3
Uniaxial compressive strength (UCS) test 4
Brazilian test 5
Elastic constants test 7
Triaxial strength testing 9
Acoustic travel time test 16
Conclusion 18
References 19
POROPLASTICITY 20
Introduction
The reservoir stress state measurements have application in several spheres of the field development: drilling engineering, production engineering and reservoir engineering. Using rock elastic properties and failure criteria, swelling characteristics, well orientation and in-situ stress state it is possible to determinate well stability (sand and shale). Also failure criteria, in-situ stress state, fracture toughness and contrast in contiguous strata properties can help to derive hydraulic fracture orientation and height, sand production.
Finally, one of the most important applications is reservoir calculation, reservoir description, defining compaction, fault activation and enhanced reservoir simulation with stress state sensitivity which is obtained by means of rock elastic properties, compressibility, permeability sensitivity, that changes in stress state, and pore fluid chemistry [1].
The main objectives of this exercise are analysis the results that are derived from sample testing and determination following rock properties: unconfined compressive strength, tensional strength, modulus of elasticity and Poisson’s ratio, cohesion and triaxial stress factor.
This work has assumption that all tests were performed with required preparation:
The sample geometry must be appropriate to evaluate the actual stress distribution that is obtained due to testing;
Tolerances of Sample geometry must be appropriate in terms of the International Society of Rock Mechanics;
Different radial expansion of platens and specimen was minimized;
Movement of platens during loading is prevented;
Machine must have stiffness greater than 2500 kN/mm to control crack propagation;
For displacement controlled tests – loading rate is approximately 1 mm/s. For stress rate controlled tests – 0.7 N/mm2 per second.
Temperature of drying samples is approximately 105⁰ [1].
Uniaxial compressive strength (ucs) test
According to introduction this test is carried out on sample that satisfies all conditions discussed above. So the sample is dry and has cylindrical form. Because of the heterogeneous nature of rock, the length over which the strains are measured should be as large as possible, but should not reach to d/2 of the end sample ends where d is the diameter [1]. The sample is placed between two steel platens of the machine. These platens have the same diameter as specimen (Figure 1).
|
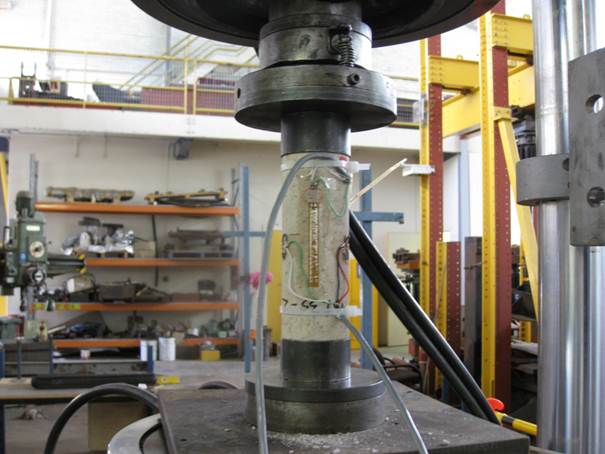
Figure 1. Machine with mounted specimen that uses in UCS test
The sample is
fallen
under increasing axial load with constant rate. The axial load and
time is fixed
during testing. If uniaxial compressive strength alone is required
the load
 will be noted. Next step is determination cross-section area of the
sample named A. Then uniaxial compressive strength can be obtained
from next equation:
will be noted. Next step is determination cross-section area of the
sample named A. Then uniaxial compressive strength can be obtained
from next equation:
|
(1) |

From this test it can possible to take only one failure point. Other points are needed if a strength criterion is required [1]. Also this test can be used for determination of porosity because of relationship with ambient porosity.
Results of test with several samples are represented on Figure 2. The relationship between axial displacement and axial load should be linear for perfectly elastic material and the slop of this line is equal to modulus of elasticity. But there is no perfectly elastic rock in reality. Because of this tested relationship have curve shape. This shape depends on conditions of testing. That is why it is better that results will be qualified by quoting test conditions [1]. The calculation uniaxial compressive strength is represented at the table 1.
№ of samples |
R, m |
Area,
|
Maximum of , N |
|
R1 |
0.019 |
0.0011335 |
14531.25 |
12.819 |
R2 |
12187.5 |
10.752 |
||
W1 |
68906.25 |
60.789 |
||
W2 |
116250 |
102.555 |

 ,
Mpa
,
MpaTable 1. Results of determination uniaxial compressive strength during UCS testing
|
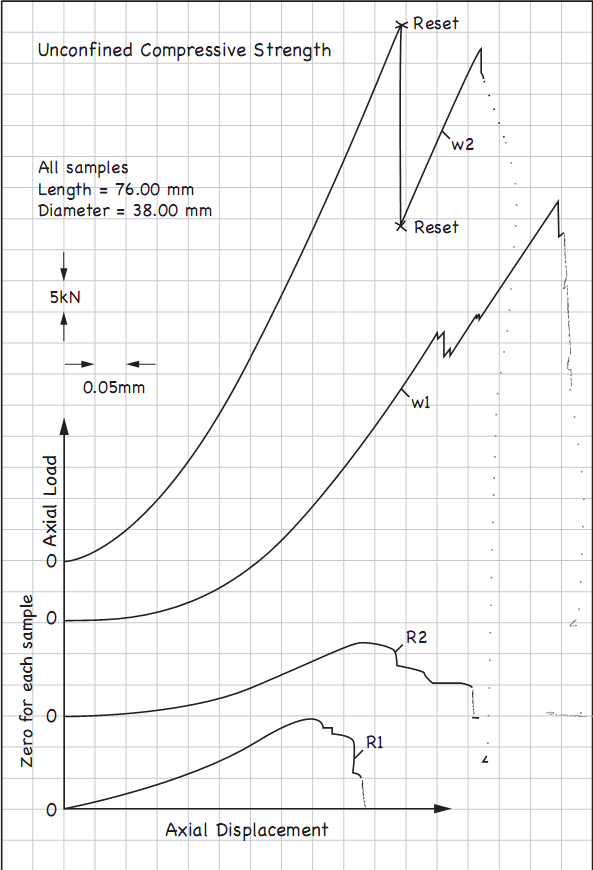
Figure 2. Noted axial displacement and axial load due to UCS testing