

Satisfaction
Adapted from Anderson, Fornell, and Lehmann (1994)
11-point scale: totally dissatisfied totally satisfied (cf. Wirtz and Lee, 2003)
Please indicate the extent to which you are satisfied or dissatisfied with your toothpaste/day cream/soft drink/DVD player.
Loyalty
Adapted from Zeithaml, Berry and Parasuraman (1996)
9-point Likert scale: extremely unlikely extremely likely
Please indicate how likely it is that you would…
Say positive things about your toothpaste/day cream/soft drink/DVD player to other people.
Recommend your toothpaste/day cream/soft drink/DVD player to someone who seeks your advice.
Encourage friends and relatives to buy this toothpaste/day cream/soft drink/DVD player.
Consider this toothpaste/day cream/soft drink/DVD player your first choice to buy toothpaste/day cream/soft drink/DVD player.
Buy this toothpaste/day cream/soft drink/DVD player again when you need toothpaste/day cream/soft drink/DVD player.
Doubt about buying this toothpaste/day cream/soft drink/DVD player again.
Demographics
Gender
Age
Monthly net family income
References
Agarwal, Sanjeev, and R. Kenneth Teas (2001), “Perceived Value: Mediating role of Perceived Risk.” Journal of Marketing Theory and Practice 9 (Fall), 1-14.
Anderson, Eugene W., Claes Fornell, and Donald R. Lehmann (1994), “Customer Satisfaction, Market Share, and Profitability: Findings from Sweden.” Journal of Marketing 58 (July), 53-66.
Anderson, James C., and James A. Narus (2004), Business Market Management: Understanding, Creating, and Delivering Value. New Jersey: Prentice Hall.
Babakus, Emin, Carol C. Bienstock, and James R. Van Scotter (2004), “Linking Perceived Quality and Customer Satisfaction to Store Traffic and Revenue Growth.” Decision Sciences 35 (September), 713-737.
Baker, Julie, A. Parasuraman, Dhruv Grewal, and Glenn B. Voss (2002), “The Influence of Multiple Store Environment Cues on Perceived Merchandise Value and Patronage Intentions.” Journal of Marketing 66 (April), 120-141.
Bolton, Ruth N., and James H. Drew (1991), “A Multistage Model of Customers' Assessments of Service Quality and Value.” Journal of Consumer Research 17 (March), 375–384.
Bottomley, Paul A., John R. Doyle, and Rodney H. Green (2000), “Testing the Reliability of Weight Elicitation Methods: Direct Rating versus Point Allocation.” Journal of Marketing Research 37 (November), 508-513.
Bourdeau, Laurent, Jean-Charles Chebat, and Christian Couturier (2002), “Internet Consumer Value of University Students: E-mail-vs.-Web Users.” Journal of Retailing and Consumer Services 9 (March), 61-69.
Butz Jr., Howard E., and Leonard D. Goodstein (1996), “Measuring Customer Value: Gaining the Strategic Advantage.” Organizational Dynamics 24 (Winter), 63-77.
Caruana, Albert, and Noel Fenech (2005), “The Effect of Perceived Value and Overall Satisfaction on Loyalty: A Study among Dental Patients.” Journal of Medical Marketing 5 (July), 245-255.
Celsi, Richard L., and Jerry C. Olson (1988), “The Role of Involvement in Attention and Comprehension Processes.” Journal of Consumer Research 15 (September), 210-224.
Chen, Zhan, and Alan J. Dubinsky (2003), “A Conceptual Model of Perceived Customer Value in E-commerce: A Preliminary Investigation.” Psychology and Marketing 20 (April), 323-347.
Claeys, C., A. Swinnen, and P. Vanden Abeele (1995), “Consumer's Means-end Chains for “Think” and “Feel” Products.” International Journal of Research in Marketing 12 (October), 193-208.
Cronin Jr., J. Joseph, Michael K. Brady, and G. Tomas M. Hult (2000), “Assessing the Effects of Quality, Value, and Customer Satisfaction on Consumer Behavioral Intentions in Service Environments.” Journal of Retailing 76 (Summer), 193-218.
Diamantopoulos, Adamantios, and Heidi M. Winklhofer (2001), “Index Construction With Formative Indicators: An Alternative to Scale Development.” Journal of Marketing Research 38 (May), 269-277.
Dodds, William B., Kent B. Monroe, and Dhruv Grewal (1991), “Effects of Price, Brand, and Store Information on Buyers' Product Evaluations.” Journal of Marketing Research 28 (August), 307-319.
Flint, Daniel J., Robert B. Woodruff, and Sarah Fisher Gardial (2002), “Exploring the Phenomenon of Customers' Desired Value Change in a Business-to-business Context.” Journal of Marketing 66 (October), 102-117.
Fornell, Claes, and David F. Larcker (1981), “Evaluating Structural Equation Models with Unobservable Variables and Measurement Error.” Journal of Marketing Research 18 (February), 39-50.
Gale, Bradley T. (1994), Managing Customer Value: Creating Quality and Service that Customers Can See. New York: The Free Press.
Gallarza, Martina G., and Irene Gil Saura (2006), “Value Dimensions, Perceived Value, Satisfaction and Loyalty: An Investigation of University Students’ Travel Behaviour.” Tourism Management 27 (June), 437-452.
Graeff, Timothy R. (1997), “Comprehending Product Attributes and Benefits: The Role of Product Knowledge and Means-end Chain Inferences.” Psychology and Marketing 14 (March), 163-183.
Gutman, Jonathan (1982), “A Means-end Chain Model Based on Consumer Categorization Processes.” Journal of Marketing 46 (Spring), 60-72.
Gutman, Jonathan (1997). “Means-end Chains as Goal Hierarchies.” Psychology and Marketing 14 (September), 545-560.
Hallowell, Roger (1996), “The Relationships of Customer Satisfaction, Customer Loyalty, and Profitability: An Empirical Study.” International Journal of Service Industry Management 7 (4), 27-42.
Henseler, Jörg, Bradley Wilson, Oliver Götz, and Caspar Hautvast (2007), “Investigating the Moderating Role of Fit on Sports Sponsoring and Brand Equity.” International Journal of Sports Marketing and Sponsorship 8 (July), 321-329.
Hirschman, Elizabeth C. (1980). “Attributes of Attributes and Layers of Meaning.” Advances in Consumer Research 7 (January), 7-12.
Hirschman, Elizabeth C., and Morris B. Holbrook (1982), “Hedonic Consumption: Emerging Concepts, Methods and Propositions.” Journal of Marketing 46 (Summer), 92-101.
Holbrook, Morris B. (1999), Consumer Value: a Framework for Analysis and Research. London: Routledge.
Holbrook, Morris B. (2006), “Consumption Experience, Customer Value, and Subjective Personal Introspection: An Illustrative Photographic Essay.” Journal of Business Research 59 (June), 714-725.
Iacobucci, Dawn, Doug Grisaffe, Adam Duhachek, and Alberto Marcati (2003), “FAC-SEM: A Methodology for Modeling Factorial Structural Equations Models, Applied to Cross-Cultural and Cross-Industry Drivers of Customer Evaluations.” Journal of Service Research 6 (August), 3-23
Jarvis, Cheryl Burke, Scott B. MacKenzie, and Philip M. Podsakoff (2003), “A Critical Review of Construct Indicators and Measurement Model Misspecification in Marketing and Consumer Research.” Journal of Consumer Research 30 (September), 199-218.
Jöreskog, Karl Gustav (1971), “Statistical Analysis of Sets of Congeric Tests.” Psychometrika, 36 (June), 109-133.
Kamakura, Wagner A., Vikas Mittal, Fernando de Rosa, and José Afonso Mazzon (2002), “Assessing the Service-Profit Chain.” Marketing Science 21 (3), 294-317.
Karlis, Dimitris, Gilbert Saporta, and Antonis Spinakis (2003), “A Simple Rule for the Selection of Principal Components.” Communications in Statistics: Theory and Methods 32 (3), 643-666.
Keppel, Geoffrey (1991). Design and Analysis: A Researcher’s Handbook. Upper Saddle River, New Jersey: Prentice-Hall.
Lai, Fujun, Mitch Griffin, and Barry J. Babin (2009), “How Quality, Value, Image, and Satisfaction Create Loyalty at a Chinese Telecom.” Journal of Business Research 62 (October), 980-986.
Laitamäki, Jukka, and Raymond Kordupleski (1997), “Building and Deploying Profitable Growth Strategies Based on the Waterfall of Customer Value Added.” European Management Journal 15 (April), 158-166.
Lam, Shun Yin, Venkatesh Shankar, M. Krishna Erramilli, and Bvsan Murthy (2004), “Customer Value, Satisfaction, Loyalty, and Switching Costs: An Illustration from a Business-to-Business Service Context.” Journal of the Academy of Marketing Science 32 (July), 293-311.
Lin, Chien-Hsin, Peter J. Sher, and Hsin-Yu Shih (2005), “Past Progress and Future Directions in Conceptualizing Customer Perceived Value.” International Journal of Service Industry Management 16 (4), 318-336.
Loveman, Gary W. (1998), “Employee Satisfaction, Customer Loyalty, and Financial Performance: An Empirical Examination of the Service Profit Chain in Retail Banking.” Journal of Service Research 1 (August), 18-31.
Louviere, Jordan J., and Towhidul Islam (2008). “A Comparison of Importance Weights and Willingness-to-Pay Measures Derived from Choice-Based Conjoint, Constant Sum Scales and Best–Worst Scaling.” Journal of Business Research, 61(September), 903-911.
Lusch, Robert F., and Stephen L. Vargo (2006), The Service-Dominant Logic of Marketing: Dialog, Debate, and Directions. New York: M.E. Sharpe Inc.
MacKenzie, Scott B., Philip M. Podsakoff, and Cheryl Burke Jarvis (2005), “The Problem of Measurement Model Misspecification in Behavioral and Organizational Research and Some Recommended Solutions.”Journal of Applied Psychology 90 (July), 710-730
Mittal, Banwari (1989), “Must Consumer Involvement Always Imply More Information Rearch.” Advances in Consumer Research 16 (January), 167-172.
Morwitz, Vicki G., and David Schmittlein (1992), “Using Segmentation to Improve Sales Forecasts Based on Purchase Intent: Which “Intenders” Actually Buy?” Journal of Marketing Research 29 (November), 391-405.
Mulvey, Michael S., Jerry C. Olson, Richard L. Celsi, and Beth A. Walker (1994), “Exploring the Relationships Between Means-End Chains and Involvement.” Advances in Consumer Research 21 (1) 51-57.
Oliver, Richard L. (1997), Satisfaction: A Behavioral Perspective on the Consumer. New York: McGraw-Hill.
Overby, Jeffrey W., Sarah Fisher Gardial, and Robert B. Woodruff (2004), “French versus American Consumers’ Attachment of Value to a Product in a Common Consumption Context: A Cross-National Comparison.” Journal of the Academy of Marketing Science 32 (September), 437-460.
Park, C. Whan, and Banwari Mittal (1985), “A Theory of Involvement in Consumer Behavior: Problems and Issues.” In Research in Consumer Behavior, ed. Jagdish N. Sheth, 201-231. Greenwich, CT: JAI Press.
Park, C. Whan, and S. Mark Young (1983), “Types and Levels of Involvement and Brand Attitude Formation.” Advances in Consumer Research 10 (January), 320-324.
Petrick, James F. (2002), “Development of a Multi-Dimensional Scale for Measuring the Perceived Value of a Service.” Journal of Leisure Research 34 (2), 119-134.
Preacher, Kristopher, and Andrew Hayes (2008), "Asymptotic and Resampling Strategies for Assessing and Comparing Indirect Effects in Multiple Mediator Models." Behavior Research Methods 40 (3), 879-891.
Ratchford, Brian T. (1987), “New Insights About the FCB Grid.” Journal of Advertising Research 27 (August/September), 24–38.
Reinartz, Werner, Manfred Krafft, and Wayne D. Hoyer (2004), “The Customer Relationship Management Process: Its Measurement and Impact on Performance.” Journal of Marketing Research 41 (August), 293-305.
Rintamäki, Timo, Hannu Kuusela, and Lasse Mitronen (2007), “Identifying Competitive Customer Value Propositions in Retailing.” Managing Service Quality 17 (6), 621-634.
Ruiz, David Martin, Dwayne D. Gremler, Judith H. Washburn, and Gabriel Cepeda Carrión (2008), “Service Value Revisited: Specifying a Higher-Order, Formative Measure.” Journal of Business Research 61 (December), 1278-1291.
Sánchez-Fernández, Raquel, and M. Ángeles Iniesta-Bonillo (2007), “The Concept of Perceived Value: A Systematic Review of the Research.” Marketing Theory 7 (December), 427-451.
Sánchez-Fernández, Raquel, M. Ángeles Iniesta-Bonillo, and Morris B. Holbrook (2009), “The Conceptualisation and Measurement of Consumer Value in Services.” International Journal of Market Research 51 (January), 93-113.
Seiders, Kathleen, Glenn B. Voss, Dhruv Grewal, and Andrea L. Godfrey (2005), “Do Satisfied Customer Buy More? Examining Moderating Influences in a Retailing Context.” Journal of Marketing 69 (October), 26-43.
Setijono, Djoko, and Jens J. Dahlgaard (2007), “Customer Value as a Key Performance Indicator (KPI) and a Key Improvement Indicator (KII).” Measuring Business Excellence 11 (June), 44-61.
Slater, Stanley F. (1997), “Developing a Customer Value-Based Theory of the Firm.” Journal of The Academy of Marketing Science 25 (March), 162-167.
Slater, Stanley F., and John C. Narver (2000), “Intelligence Generation and Superior Customer Value.” Journal of the Academy of Marketing Science 28 (January), 120-127.
Strauss, Anselm L., and Juliet M. Corbin (1998), Basics of Qualitative Research: Techniques and Procedures for Developing Grounded Theory. London: Sage Publications.
Sweeney, Jillian C., and Geoffrey N. Soutar (2001), “Consumer Perceived Value: The Development of a Multiple Item Scale.” Journal of Retailing 77 (Summer), 203-220.
Teas, R. Kenneth, and Sanjeev Agarwal (2000), “The Effects of Extrinsic Product Cues on Consumers’ Perceptions of Quality, Sacrifice, and Value.” Journal of the Academy of Marketing Science 28 (March), 278-290.
Ulaga, Wolfgang, and Samir Chacour (2001), “Measuring Customer-Perceived Value in Business Markets.” Industrial Marketing Management 30 (August), 525-540.
Vargo, Stephen L., and Robert F. Lusch (2004), “Evolving to a New Dominant Logic for Marketing.” Journal of Marketing 68 (January), 1-17.
Vargo, Stephen L., Paul P. Maglio, and Melissa Archpru Akaka (2008). “On Value and Value Co-Creation: A Service Systems and Service Logic Perspective.” European Management Journal 26 (June), 145-152.
Vaughn, Richard (1980), “How Advertising Works: A Planning Model.” Journal of Advertising Research 20 (October), 27-33.
Wang, Yonggui, Hing Po Lo, Renyong Chi, and Yongheng Yang (2004), “An Integrated Framework for Customer Value and Customer-Relationship-Management Performance: a Customer-Based Perspective from China.” Managing Service Quality 14 (2/3), 169-182.
Wilson, Bradley, and Jörg Henseler (2007). Modeling Reflective Higher-Order Constructs using Three Approaches with PLS Path Modeling: A Monte Carlo Comparison. Paper presented at the Australian and New Zealand Marketing Academy Conference. Otago, Australia, December 3-5.
Wirtz, Jochen, and Meng Chung Lee (2003), “An Examination of The Quality and Context-Specific Applicability of Commonly Used Customer Satisfaction Measures.” Journal Of Service Research 5 (May), 345-355.
Woodruff, Robert B. (1997), “Customer Value: The Next Source for Competitive Advantage.” Journal of The Academy Of Marketing Science 25 (March), 139-153.
Woodruff, Robert B., and Sarah Fisher Gardial (1996), Know Your Customer: New Approaches To Understanding Customer Value and Satisfaction. Cambridge, MA: Blackwell Publications.
Young, Martin R., Wayne S. DeSarbo, and Vicki G. Morwitz (1998), “The Stochastic Modeling of Purchase Intentions and Behavior.” Marketing Science, 44 (2), 188-202.
Zar, Jerrold H. (1996) Biostatistical Analysis. New Jersey: Prentice-Hall.
Zeithaml, Valerie A. (1988), “Consumer Perceptions of Price, Quality, and Value: A Means-End Model and Synthesis of Evidence.” Journal of Marketing 52 (July) 2-22.
Zeithaml, Valerie A., Leonard L. Berry, and A. Parasuraman (1996), “The Behavioral Consequences of Service Quality.” Journal of Marketing 60 (April) 31-46.
Table 1
Differences between Measurement Methods
|
Dodds et al. (1991) |
Gale (1994) |
Woodruff and Gardial (1996) |
Holbrook (1999) |
1. Approach |
One-dimensional |
Multi-dimensional |
Multi-dimensional |
Multi-dimensional |
2. Nature of costs/benefits |
n.a. |
Attributes |
Consequences |
Attributes and consequences |
3. Competition |
No |
Yes |
No |
No |
Table 2
Summary of Correlations, Means and Standard Deviations for the Dodds Method
Think |
|
Feel |
||||||||||||||||||||
|
VAL |
SAT |
REP |
WOM |
M |
SD |
|
|
VAL |
SAT |
REP |
WOM |
M |
SD |
||||||||
VAL |
― |
|
.48** |
.47** |
.45** |
6.65 |
1.28 |
|
VAL |
― |
|
.32** |
.27** |
.35** |
6.24 |
1.46 |
||||||
SAT |
.34** |
― |
|
.52** |
.56** |
7.78 |
1.64 |
|
SAT |
.41** |
― |
|
.64** |
.50** |
8.26 |
1.23 |
||||||
REP |
.33** |
.43** |
― |
|
.73** |
6.41 |
1.65 |
|
REP |
.33** |
.55** |
― |
|
.58** |
7.29 |
1.53 |
||||||
WOM |
.42** |
.38** |
.52** |
― |
|
6.26 |
1.75 |
|
WOM |
.34** |
.57** |
.55** |
― |
|
6.84 |
1.48 |
||||||
M |
5.89 |
|
7.91 |
|
7.14 |
|
6.07 |
|
|
|
|
M |
5.56 |
|
8.38 |
|
7.60 |
|
6.44 |
|
|
|
SD |
1.06 |
|
1.42 |
|
1.56 |
|
1.81 |
|
|
|
|
SD |
1.59 |
|
1.24 |
|
1.38 |
|
1.95 |
|
|
|
Note. Correlations for the high involvement offerings are presented above the diagonal, and correlations for the low involvement offerings are presented below the diagonal. Means and standard deviations for the high involvement offerings are presented in the vertical columns, and means and standard deviations of the low involvement offerings are presented in the horizontal rows. VAL = value; SAT = Satisfaction; REP = Repurchase Intentions; WOM = Word-of-Mouth. *p < .05 **p < .01 |
||||||||||||||||||||||
Table 3
Summary of Correlations, Means and Standard Deviations for the Gale Method
Think |
|
Feel |
||||||||||||||||||||||||||||||||
|
|
|
|
|
|
|
|
|
|
|
|
|
|
|
|
|
|
|
|
|
|
|
|
|
|
|
||||||||
|
MPQ |
MPP |
SAT |
REP |
WOM |
M |
SD |
|
|
MPQ |
MPP |
SAT |
REP |
WOM |
M |
SD |
||||||||||||||||||
MPQ |
― |
|
-.35** |
.43** |
.51** |
.58** |
6.15 |
1.12 |
|
MPQ |
― |
|
-.36** |
.45** |
.45** |
.46** |
6.78 |
1.26 |
||||||||||||||||
MPP |
-.44** |
― |
|
-.13 |
|
-.14* |
-.18** |
3.88 |
1.51 |
|
MPP |
-.15* |
― |
|
-.15* |
-.14 |
|
-.12 |
|
4.08 |
1.69 |
|||||||||||||
SAT |
.46** |
-.17* |
― |
|
.59** |
.69** |
7.80 |
1.71 |
|
SAT |
.37** |
-.18* |
― |
|
.65** |
.55** |
8.46 |
1.28 |
||||||||||||||||
REP |
.37** |
.00 |
|
.59** |
― |
|
.62** |
6.30 |
1.55 |
|
REP |
.35** |
-.05 |
|
.46** |
― |
|
.57** |
7.44 |
1.43 |
||||||||||||||
WOM |
.49** |
-.15* |
.54** |
.61** |
― |
|
6.25 |
1.90 |
|
WOM |
.49** |
-.07 |
|
.47** |
.50** |
― |
|
6.90 |
1.57 |
|||||||||||||||
M |
6.28 |
|
4.21 |
|
8.31 |
|
7.24 |
|
6.30 |
|
|
|
|
M |
6.61 |
|
4.33 |
|
8.69 |
|
7.79 |
|
6.78 |
|
|
|
||||||||
SD |
1.14 |
|
1.32 |
|
1.27 |
|
1.65 |
|
1.96 |
|
|
|
|
SD |
1.06 |
|
1.76 |
|
1.00 |
|
1.23 |
|
1.62 |
|
|
|
||||||||
Note. Correlations for the high involvement offerings are presented above the diagonal, and correlations for the low involvement offerings are presented below the diagonal. Means and standard deviations for the high involvement offerings are presented in the vertical columns, and means and standard deviations of the low involvement offerings are presented in the horizontal rows. MPQ = Market-Perceived Quality; MPP = Market-Perceived Price; SAT = Satisfaction; REP = Repurchase Intentions; WOM = Word-of-Mouth. *p < .05 **p < .01 |
||||||||||||||||||||||||||||||||||
Table 4
Summary of Correlations, Means and Standard Deviations for the Woodruff Method
Think |
|
Feel |
|||||||||||||||||||||||||||||||||
|
|
|
|
|
|
|
|
|
|
|
|
|
|
|
|
|
|
|
|
|
|
|
|
|
|
|
|||||||||
|
BEN |
SAC |
SAT |
REP |
WOM |
M |
SD |
|
|
BEN |
SAC |
SAT |
REP |
WOM |
M |
SD |
|||||||||||||||||||
BEN |
― |
|
-.22** |
.65** |
.48** |
.70** |
6.58 |
1.08 |
|
BEN |
― |
|
-.34** |
.59** |
.50** |
.70** |
7.16 |
1.25 |
|||||||||||||||||
SAC |
-.33** |
― |
|
-.14* |
-.17* |
-.15* |
4.00 |
1.74 |
|
SAC |
-.27** |
― |
|
-.24** |
-.17* |
-.32** |
4.19 |
2.33 |
|||||||||||||||||
SAT |
.50** |
-.34** |
― |
|
.55** |
.68** |
7.70 |
1.69 |
|
SAT |
.61** |
-.02 |
|
― |
|
.53** |
.54** |
8.35 |
1.26 |
||||||||||||||||
REP |
.43** |
-.01 |
|
.51** |
― |
|
.65** |
6.28 |
1.66 |
|
REP |
.52** |
-.06 |
|
.60** |
― |
|
.59** |
7.40 |
1.44 |
|||||||||||||||
WOM |
.51** |
-.18** |
.46** |
.55** |
― |
|
6.43 |
1.81 |
|
WOM |
.50** |
-.19** |
.56** |
.53** |
― |
|
7.03 |
1.40 |
|||||||||||||||||
M |
6.28 |
|
4.73 |
|
7.96 |
|
7.07 |
|
5.98 |
|
|
|
|
M |
6.19 |
|
5.27 |
|
8.16 |
|
7.50 |
|
6.33 |
|
|
|
|||||||||
SD |
1.26 |
|
1.87 |
|
1.30 |
|
1.61 |
|
1.81 |
|
|
|
|
SD |
1.10 |
|
2.19 |
|
1.22 |
|
1.35 |
|
1.79 |
|
|
|
|||||||||
|
|
|
|
|
|
|
|
|
|
|
|
|
|
|
|
|
|
|
|
|
|
|
|
|
|
|
|||||||||
Note. Correlations for the high involvement offerings are presented above the diagonal, and correlations for the low involvement offerings are presented below the diagonal. Means and standard deviations for the high involvement offerings are presented in the vertical columns, and means and standard deviations of the low involvement offerings are presented in the horizontal rows. BEN = benefits; SAC = Sacrifices; SAT = Satisfaction; REP = Repurchase Intentions; WOM = Word-of-Mouth. *p < .05 **p < .01 |
|||||||||||||||||||||||||||||||||||
Table 5
Summary of Correlations, Means and Standard Deviations for the Holbrook Method
Think |
||||||||||||||||||
|
AEST |
EFF |
EXC |
PLAY |
SOC |
SAT |
REP |
WOM |
M |
SD |
||||||||
AEST |
― |
|
.02 |
|
.47** |
.55** |
.25** |
.34** |
.23** |
.33** |
5.36 |
1.90 |
||||||
EFF |
.10 |
|
― |
|
.08 |
|
-.12 |
|
-.33** |
.24** |
.22** |
.11 |
|
6.90 |
1.31 |
|||
EXC |
.51** |
.18** |
― |
|
.35** |
.09 |
|
.54** |
.47** |
.53** |
5.96 |
1.46 |
||||||
PLAY |
.69** |
-.05 |
|
.30** |
― |
|
.44** |
.14* |
.02 |
|
.21** |
4.46 |
1.69 |
|||||
SOC |
.49** |
-.27** |
.04 |
|
.57** |
― |
|
-.08 |
|
-.13 |
|
-.01 |
|
2.06 |
1.59 |
|||
SAT |
.41** |
.29** |
.70** |
.23** |
.03 |
|
― |
|
.54** |
.56** |
7.94 |
1.34 |
||||||
REP |
.36** |
.23** |
.73** |
.16* |
-.09 |
|
.67** |
― |
|
.63** |
6.15 |
1.49 |
||||||
WOM |
.52** |
.10 |
|
.69** |
.42** |
.23** |
.59** |
.59** |
― |
|
6.19 |
1.69 |
||||||
M |
5.61 |
|
6.96 |
|
6.67 |
|
4.30 |
|
2.71 |
|
8.01 |
|
7.18 |
|
6.10 |
|
|
|
SD |
1.79 |
|
1.25 |
|
1.47 |
|
2.14 |
|
1.90 |
|
1.73 |
|
1.70 |
|
1.82 |
|
|
|
Feel |
||||||||||||||||||
|
AEST |
EFF |
EXC |
PLAY |
SOC |
SAT |
REP |
WOM |
M |
SD |
||||||||
AEST |
― |
|
.16* |
.60** |
.56** |
.26** |
.49** |
.46** |
.52** |
6.52 |
1.67 |
|||||||
EFF |
-.19** |
― |
|
.05 |
|
-.06 |
-.35** |
.20** |
.21** |
.06 |
|
6.97 |
1.36 |
|||||
EXC |
.22** |
-.12 |
|
― |
|
.40** |
.23** |
.67** |
.57** |
.52** |
6.72 |
1.36 |
||||||
PLAY |
.52** |
-.17* |
.35** |
― |
|
.48** |
.31** |
.30** |
.43** |
5.60 |
1.92 |
|||||||
SOC |
.59** |
-.33** |
.09 |
|
.40** |
― |
|
.07 |
|
.04 |
|
.26** |
3.27 |
1.97 |
||||
SAT |
.13 |
|
.02 |
|
.66** |
.25** |
-.01 |
|
― |
|
.76** |
.58** |
8.21 |
1.21 |
||||
REP |
-.04 |
|
-.07 |
|
.53** |
.16* |
-.11 |
|
.55** |
― |
|
.67** |
7.39 |
1.50 |
||||
WOM |
.24** |
-.03 |
|
.51** |
.42** |
.15* |
.59** |
.61** |
― |
|
6.81 |
1.56 |
||||||
M |
2.59 |
|
6.39 |
|
6.82 |
|
4.29 |
|
2.14 |
|
8.38 |
|
7.51 |
|
6.08 |
|
|
|
SD |
1.93 |
|
1.45 |
|
1.65 |
|
2.13 |
|
1.72 |
|
1.36 |
|
1.58 |
|
2.29 |
|
|
|
Note. Correlations for the high involvement offerings are presented above the diagonal, and correlations for the low involvement offerings are presented below the diagonal. Means and standard deviations for the high involvement offerings are presented in the vertical columns, and means and standard deviations of the low involvement offerings are presented in the horizontal rows. AEST = Aesthetics; EFF = Efficiency; EXC = Excellence; PLAY = Play; SOC = Social Value; SAT = Satisfaction; REP = Repurchase Intentions; WOM = Word-of-Mouth. *p < .05 **p < .01 |
||||||||||||||||||
Table 6
Comparison between the Coefficients of Determination
|
|
Satisfaction |
|
|
Word-of-Mouth |
|
|
Repurchase Intentions |
|||||||||
|
|
|
|
|
|
|
|
|
|
|
|
|
|
|
|
|
|
|
|
D |
G |
W |
H |
|
|
D |
G |
W |
H |
|
|
D |
G |
W |
H |
toothpaste |
D |
|
|
|
|
|
D |
|
|
|
|
|
D |
|
|
|
|
Think - Low involv |
G |
|
.46(.21) |
|
** |
|
G |
|
.61(.37) |
|
* |
|
G |
|
.62(.38) |
|
** |
|
W |
|
|
.56(.31) |
** |
|
W |
|
|
.63(.40) |
|
|
W |
|
|
.62(.38) |
** |
|
H |
|
** |
** |
.71(.50) |
|
H |
|
* |
|
.72(.52) |
|
H |
|
** |
** |
.78(.61) |
|
|
|
|
|
|
|
|
|
|||||||||
|
|
|
|
|
|
|
|
|
|
|
|
|
|
|
|
|
|
|
|
D |
G |
W |
H |
|
|
D |
G |
W |
H |
|
|
D |
G |
W |
H |
soft drink |
D |
.47(.22) |
|
** |
** |
|
D |
.60(.36) |
|
|
|
|
D |
.63(.39) |
|
|
|
Feel - Low involv |
G |
|
.38(.14) |
** |
** |
|
G |
|
.58(.33) |
|
|
|
G |
|
.55(.31) |
|
|
|
W |
** |
** |
.74(.55) |
|
|
W |
|
|
.59(.35) |
|
|
W |
|
|
.67(.45) |
|
|
H |
** |
** |
|
.67(.45) |
|
H |
|
|
|
.62(.39) |
|
H |
|
|
|
.64(.40) |
|
|
|
|
|
|
|
|
|
|||||||||
|
|
|
|
|
|
|
|
|
|
|
|
|
|
|
|
|
|
|
|
D |
G |
W |
H |
|
|
D |
G |
W |
H |
|
|
D |
G |
W |
H |
DVD player |
D |
|
|
|
|
|
D |
|
|
|
|
|
D |
|
|
|
|
Think - High involv |
G |
|
.43(.19) |
** |
** |
|
G |
|
.76(.58) |
|
** |
|
G |
|
.69(.48) |
|
|
|
W |
|
** |
.73(.54) |
* |
|
W |
|
|
.76(.58) |
** |
|
W |
|
|
.61(.38) |
|
|
H |
|
** |
* |
.62(.38) |
|
H |
|
** |
** |
.62(.38) |
|
H |
|
|
|
.61(.37) |
|
|
|
|
|
|
|
|
|
|||||||||
|
|
|
|
|
|
|
|
|
|
|
|
|
|
|
|
|
|
|
|
D |
G |
W |
H |
|
|
D |
G |
W |
H |
|
|
D |
G |
W |
H |
day cream |
D |
.42(.18) |
|
** |
** |
|
D |
.56(.32) |
|
** |
|
|
D |
.65(.43) |
|
|
* |
Feel - High involv |
G |
|
.45(.20) |
* |
** |
|
G |
|
.60(.36) |
* |
|
|
G |
|
.73(.53) |
|
|
|
W |
** |
* |
.62(.38) |
|
|
W |
** |
* |
.73(.54) |
|
|
W |
|
|
.67(.45) |
|
|
H |
** |
** |
|
.68(.47) |
|
H |
|
|
|
.64(.41) |
|
H |
* |
|
|
.77(.60) |
|
|
|
|
|
|
|
|
|
|
|
|
|
|
|
|
|
|
Note: This table displays the R-values with the R²-values in parenthesis. D = Dodds; G = Gale; W = Woodruff and Gardial; H = Holbrook. *p < .10 **p < .05 |
|||||||||||||||||
Table 7
FAC-SEM Hypotheses
Woodruff and Gardial vs. Gale |
|
Main effect involvement (H1) |
|
Main effect think/feel (H2) |
|
Interaction effect (H3) |
|
Holbrook vs. Gale |
|
Main effect involvement (H1) |
|
Main effect think/feel (H2) |
|
Interaction effect (H3) |
|
Holbrook vs. Woodruff and Gardial |
|
Main effect involvement (H1) |
|
Main effect think/feel (H2) |
|
Interaction effect (H3) |
|
Table 8
FAC-SEM Results
Woodruff and Gardial vs. Gale |
Satisfaction |
Word-of-Mouth |
Repurchase Intentions |
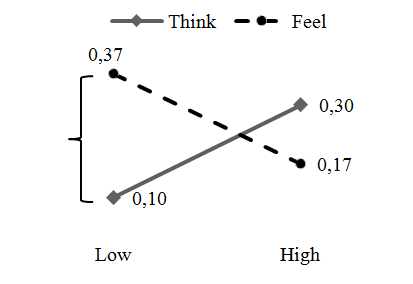
Interaction effect involvement * think/feel |
[-.59; -.23] |
[.02; .25] |
ns |
|
|
|
|
Main effect involvement |
ns |
ns |
ns |
Main effect think/feel |
ns |
ns |
ns |
Summary hypotheses tests |
H3 supported in opposite direction (disordinal interaction) |
H3 supported (disordinal interaction) |
H3, H2, H1 not supported
|
Holbrook vs. Gale |
Satisfaction |
Word-of-Mouth |
Repurchase Intentions |
Interaction effect involvement * think/feel |
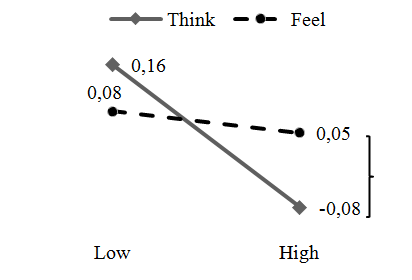
ns |
[.11; .38] |
[.07; .33] |
|
|
|
|
Main effect involvement |
ns |
ns |
ns |
Main effect think/feel |
ns |
ns |
ns |
Summary hypotheses tests |
H3,H2,H1 not supported
|
H3 supported (disordinal interaction) |
H3 supported (disordinal interaction) |


Additional analysis |
|
|
|
Holbrook vs. Woodruff and Gardial |
Satisfaction |
Word-of-Mouth |
Repurchase Intentions |
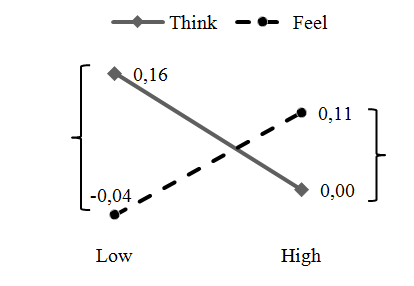
Interaction effect involvement * think/feel |
[.24; .59] |
ns |
[.17; .43] |
|
|
|
|
Main effect involvement |
ns |
[-.31; -.06] |
ns |
Main effect think/feel |
ns |
ns |
ns |
|
|
|
|

Note: The differences indicated with an accolade are significant at the .05-level.
1 In this study, we use the terms conceptualization, measurement method and operationalization interchangeably.
2 In line with Gale's (1994) measurement method, we asked respondents to rate the importance of each attribute. Because the number of attributes was considerably large, a point allocation was not an option, so we used a Likert scale instead and normalized the weights (Bottomley, Doyle, and Green, 2000).