

кейси для індивідуальної роботи 2014 н.р. / Visa Inc. and Visa Europe in Consumer Finance
.pdfSTRATEGIC EVALUATION
COMPETITIVE POSITIONING
MARKET ASSESSMENT
CATEGORY AND GEOGRAPHIC OPPORTUNITIES
BRAND STRATEGY
RECOMMENDATIONS

CATEGORY AND GEOGRAPHIC OPPORTUNITIES
The Latin American landscape
Along with impressive economic growth, many Latin American countries have extended financial services and products to unbanked consumers through open loop pre-paid cards and increased access to payment infrastructure. In Mexico and Argentina, the majority of the open loop pre-paid cards are comprised of Government benefit cards with 53% and 99% of the total segment, respectively. In Brazil, the distribution of government benefits via pre-paid cards is in part done to increase a sense of financial inclusion for lower-income brackets that do not have access to traditional financial services. The Visa Vale programme started in 2003 that allows employers to distribute food benefits on pre-paid cards has achieved considerable success with 3.2 million employees registered. However, despite broader distribution of pre-paid cards, first-time financial cards consumers are more likely to use the card as a cash access device rather than to use it for payment. In addition, Visa has partnered with issuing banks and governments promoting greater POS terminal distribution and use throughout Latin America; the largest gain taking place in Columbia (20% y-o-y)
Latin America: POS Terminals 2011
|
POS terminal |
Number of POS |
|
Country |
2010-2011 |
||
terminals (‘000) |
|||
|
% y-o-y growth |
||
|
|
||
|
|
|
|
Columbia |
20 |
189 |
|
|
|
|
|
Brazil |
14 |
4,001 |
|
|
|
|
|
Argentina |
5 |
1,055 |
|
|
|
|
|
Mexico |
1 |
481 |
|
|
|
|
|
Chile |
-12.4 |
78 |
|
Latin America: Government Benefit Cards 2011 |
|||
|
|
|
|
Country |
% open loop |
Number of cards in |
|
cards |
circulation (‘000) |
||
|
|||
|
|
|
|
Brazil |
24.4 |
1,765 |
|
|
|
|
|
Mexico |
52.7 |
6,713 |
|
|
|
|
|
Argentina |
98.6 |
3,633 |
|
© Euromonitor International |
CONSUMER FINANCE: VISA INC. AND VISA EUROPE |
PASSPORT 22 |

CATEGORY AND GEOGRAPHIC OPPORTUNITIES
Beyond China in Asia Pacific
China has clearly established itself as the largest card payment market in Asia Pacific, accounting for 47% of the region’s total card payment value. China’s regional share is projected to increase to
55% by 2016. However, with China UnionPay’s monopoly of domestic renminbi transactions, the market has limited opportunity for international operators. Of the four fastest projected growth markets in the region (excluding China) by card payment value, Visa is not the leading operator in three of them. In the Philippines and Malaysia,
MasterCard leads, while Visa’s share of total card payment value in each of these two markets has declined by one percentage point from 2006 to 2010. In the fastest projected growth market, Vietnam, the domestic scheme accounts for the majority of transactions, and gaining share there could hinge on greater liberalisation of the cards market. The greatest potential in absolute terms is in the Indian cards market, which in addition to growing at a 20% CAGR for card payments value over 2006-2011, has a predicted a CAGR of 17% from 2011 to 2016.
Asia Pacific: Other Key Card Payment Markets
|
Card |
Card Payment |
Visa % |
|
|
share of |
|||
|
Payment % |
Absolute Value |
||
Country |
card |
|||
CAGR 2011- |
growth US$ mn |
|||
|
payment |
|||
|
2016 |
2011-2016 |
||
|
value 2010 |
|||
|
|
|
|
|
Vietnam |
21.3 |
11,021 |
5.7 |
|
|
|
|
|
|
Philippines |
19.5 |
20,211 |
13.2 |
|
|
|
|
|
|
India |
17.0 |
32,147 |
74.3 |
|
|
|
|
|
|
Malaysia |
14.6 |
30,359 |
43.4 |
|
|
|
|
|
|
Card Payment Value: China vs Rest of Asia |
|
|||||||||
|
|
|
|
|
|
Pacific 2011/2016 |
|
||||
|
5,000,000 |
|
|
|
|
|
|
|
|
|
|
|
|
|
|
|
|
|
|
|
|
||
million |
4,000,000 |
|
|
|
|
|
|
|
|
|
|
|
|
|
|
|
|
|
|
|
|||
3,000,000 |
|
|
|
|
|
|
|
|
|
|
|
US$ |
|
|
|
|
|
|
|
|
|
|
|
2,000,000 |
|
|
|
|
|
|
|
|
|
|
|
|
|
|
|
|
|
|
|
|
|
|
|
|
1,000,000 |
|
|
|
|
|
|
|
|
|
|
|
|
|
|
|
|
|
|
|
|
||
|
0 |
|
|
|
|
|
|
|
|
|
|
|
|
|
|
|
|
|
|
|
|
|
|
|
2011 |
2016 |
|
||||||||
|
|
|
|
|
|
Rest of Asia Pacific |
|
|
|
China |
|
|
|
|
|
|
|
|
|
|
|||
|
|
|
|
|
|
|
|
|
|||
© Euromonitor International |
CONSUMER FINANCE: VISA INC. AND VISA EUROPE |
PASSPORT 23 |

CATEGORY AND GEOGRAPHIC OPPORTUNITIES
Advancing financial literacy
It is in Visa’s best interest to increase the level of financial literacy in emerging markets and has established programmes, materials and funding in a variety of efforts. These include programmes that target the unbanked, but emphasise the functionality of cards and provide tools for consumers to avoid unsustainable personal debt levels. As of 2011, Visa operated financial literacy programmes across the globe, and tailored programmes based on the region. Converting the first-time financial consumers’ mentality that cards are cash access devices to payment instruments has been a constant challenge for the largest international operators to fully unlock card payment potential in emerging markets. The two regions most resistant to the transition to card payments are Eastern Europe and Middle East and Africa, where 83% and 71% respectively, of total card transaction value is cash withdrawn from ATMs; in sharp contrast, the same figure in the US is 15%. Asia Pacific and Latin America had the highest reductions in the percentage of cash withdrawn from ATMs of all card transaction value from 2006 to 2011, by 8% and 7%, respectively.
Cash from ATM Withdraws as a % of All Card Transaction Value by Region 2011
100% |
|
|
|
|
|
|
|
|
|
|
|
|
|
|
|
|
|
|
|
|
|
|
|
|
|
|
|
|
|
|
|
|
|
||
90% |
|
|
|
|
|
|
|
|
|
|
|
|
|
|
|
|
|
|
|
|
|
|
|
|
|
|
|
|
|
|
|
|
|
||
80% |
|
|
|
|
|
|
|
|
|
|
|
|
|
|
|
|
Payment |
|
|
|
|
|
|
|
|
|
|
|
|
|
|
|
|||
70% |
|
|
|
|
|
|
|
|
|
|
|
|
|
|
|
|
|
|
|
|
|
|
|
|
|
|
|
|
|
|
|
|
|
||
|
|
|
|
|
|
|
|
|
|
|
|
|
|
|
|
||
|
|
|
|
|
|
|
|
|
|
|
|
|
|
|
|
|
|
60% |
|
|
|
|
|
|
|
|
|
|
|
|
|
|
|
|
|
|
|
|
|
|
|
|
|
|
|
|
|
|
|
|
|
||
50% |
|
|
|
|
|
|
|
|
|
|
|
|
|
|
|
|
|
|
|
|
|
|
|
|
|
|
|
|
|
|
|
|
|
||
40% |
|
|
|
|
|
|
|
|
|
|
|
|
|
|
|
|
ATM |
|
|
|
|
|
|
|
|
|
|
|
|
|
|
|
|||
30% |
|
|
|
|
|
|
|
|
|
|
|
|
|
|
|
|
|
|
|
|
|
|
|
|
|
|
|
|
|
|
|
|
|
||
|
|
|
|
|
|
|
|
|
|
|
|
|
|
|
|
|
|
20% |
|
|
|
|
|
|
|
|
|
|
|
|
|
|
|
|
|
|
|
|
|
|
|
|
|
|
|
|
|
|
|
|
|
||
10% |
|
|
|
|
|
|
|
|
|
|
|
|
|
|
|
|
|
|
|
|
|
|
|
|
|
|
|
|
|
|
|
|
|
||
0% |
|
|
|
|
|
|
|
|
|
|
|
|
|
|
|
|
|
|
|
Eastern Europe |
|
MEA |
|
Latin America |
|
Asia Pacific |
|
Western Europe |
|
North America |
|||||
|
|
|
|
|
|
|
|
||||||||||
© Euromonitor International |
CONSUMER FINANCE: VISA INC. AND VISA EUROPE |
PASSPORT 24 |

CATEGORY AND GEOGRAPHIC OPPORTUNITIES
The US consumer
The effects of the financial crisis on the US consumer were pronounced and are illustrated by the increased unemployment rate and declining levels of revolving debt. The decline in revolving debt was a function of consumers having a heightened sense of uncertainty about the economic future as well as increased consumer defaults resulting from unemployment. The peak of unemployment in the current cycle was the fourth quarter of 2009 and has steadily been declining into 2011. As the unemployment rate drops, consumer spending levels should return to pre-recession levels. In the US in 2011 consumer revolving debt levels edged up reversing the trend of decline that started during the financial crises suggesting consumer spending patterns are returning to normalised levels. The long-term effects of the recession on consumer spending habits have been the increased popularity of debit and open loop pre-paid cards in place of credit and charge products. In addition, migration towards cards has increased as consumers and companies seek to maximise rewards for spending.
US Unemployment and Revolving Credit Statistics 2009-2011
Revolving debt US$ billion
900 |
|
|
|
|
|
|
|
|
|
|
|
10.0% |
|
|
|
|
|
|
|
|
|
|
|
||||
880 |
|
|
|
|
|
|
|
|
|
|
|
|
|
|
|
|
|
|
|
|
|
|
9.8% |
||||
|
|
|
|
|
|
|
|
|
|
|
|||
860 |
|
|
|
|
|
|
|
|
|
|
|
|
|
|
|
|
|
|
|
|
|
|
9.6% |
||||
840 |
|
|
|
|
|
|
|
|
|
|
|||
|
|
|
|
|
|
|
|
|
|
|
9.4% |
||
820 |
|
|
|
|
|
|
|
|
|
|
|
||
|
|
|
|
|
|
|
|
|
|
||||
800 |
|
|
|
|
|
|
|
|
|
|
|
9.2% |
|
|
|
|
|
|
|
|
|
|
|
||||
780 |
|
|
|
|
|
|
|
|
|
|
|
|
|
|
|
|
|
|
|
|
|
|
9.0% |
||||
760 |
|
|
|
|
|
|
|
|
|
|
|||
|
|
|
|
|
|
|
|
|
|
|
|
|
|
|
|
|
|
|
|
|
|
|
8.8% |
||||
740 |
|
|
|
|
|
|
|
|
|
|
|||
|
|
|
|
|
|
|
|
|
|
|
|
|
|
720 |
|
|
|
|
|
|
|
|
|
|
|
8.6% |
|
|
|
|
|
|
|
|
|
|
|
|
|||
|
|
2009Q4 |
2010Q1 |
2010Q2 |
|
2010Q3 |
2010Q4 |
2011Q1 |
2011Q2 |
2011Q3 |
2011Q4 |
||
|
|
|
|
|
|
Revolving Debt |
|
Unemployment Rate |
|
|
|
|
|
|
|
|
|
|
|
|
|
|
|
|
|||
|
|
|
|
|
|
|
|
|
|
|
|||
Unemployment rate
© Euromonitor International |
CONSUMER FINANCE: VISA INC. AND VISA EUROPE |
PASSPORT 25 |
CATEGORY AND GEOGRAPHIC OPPORTUNITIES
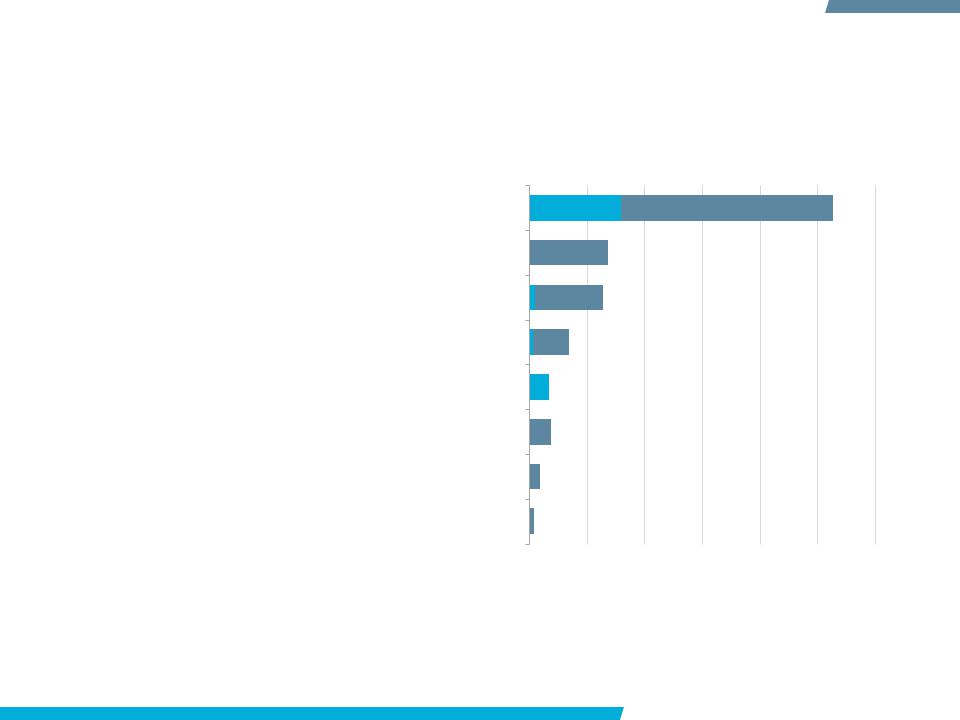
Building m-commerce capability
Visa has invested significant resources into the development of it m-commerce processing capabilities and is positively positioned to benefit from the increases in the developed world over the forecast period. The largest market for m- commerce in the world is Japan with US$26.3 billion in 2011. However, the US is projected to surpass Japan by 2016 with US$135 billion. This sizable payment opportunity is targeted by the leading international operators as well as nonconventional payment companies in the technology space. To maintain its leading position in payments Visa should continue to build its m-commerce platform by increasing its accessibility and security. In addition, companies are recognising the potential value with smartphone adoption and m-commerce in the ability to present locational discounts from merchants directly to consumers. By increasing the merchant to consumer relationship, the company that can best present this value proposition could gain significant advertising revenue as well as marketing intelligence data.
m-Commerce: Value by Leading Markets 2006/2011
Japan
USA
France
India
UK
China
Germany
Brazil
0 |
5,000 |
10,000 |
15,000 |
20,000 |
25,000 |
30,000 |
||||
|
|
|
|
|
US$ million |
|
|
|
|
|
|
|
|
|
2006 |
|
|
|
2011 |
|
|
|
|
|
|
|
|
|
||||
|
|
|
|
|
|
|
||||
© Euromonitor International |
CONSUMER FINANCE: VISA INC. AND VISA EUROPE |
PASSPORT 26 |

CATEGORY AND GEOGRAPHIC OPPORTUNITIES
E-commerce strategy
Visa’s acquisition of CyberSource was significant beyond its price tag of US$2 billion. It gave Visa a leading position in online processed transactions. CyberSource reached nearly 1.1 billion transactions in Q3 2011. The value of each transaction is relatively small, but there is a much larger opportunity as more consumers turn to online purchases. A key driver of online purchases has been the widespread adoption of mobile smartphones; the enhanced capabilities have increased the simplicity and speed of online shopping from mobile phones. In 2010, smartphones made up 22% of all mobile phones globally, up from only 3% in 2005. Visa is not alone among operators in increasing its online processing capabilities. MasterCard acquired European online payment processor DataCash, while American Express acquired Accertify. The emphasis on the online payment space will continue through the forecast period as the leading operators position to have the most complete and secure processing platform.
CyberSource: Processed Transactions
2009Q3-2011Q3
1,200
million |
1,000 |
|
800 |
||
|
||
Transactions |
600 |
|
400 |
||
|
||
|
200 |
|
|
0 |
2009 |
2009 |
2010 |
2010 |
2010 |
2010 |
2011 |
2011 |
2011 |
Q3 |
Q4 |
Q1 |
Q2 |
Q3 |
Q4 |
Q1 |
Q2 |
Q3 |
|
|
|
|
Global Mobile Phones 2005-2015 |
|
||||||||||
|
1,800 |
|
|
|
|
|
|
|
|
|
|
|
60% |
|
|
|
|
|
|
|
|
|
|
|
|
|
|
||||
|
1,600 |
|
|
|
|
|
|
|
|
|
|
|
|
|
|
|
|
|
|
|
|
|
50% |
|
|||||||
|
1,400 |
|
|
|
|
|
|
|
|
||||||
Mn of phones |
|
|
|
|
|
|
|
|
|
|
|
|
|
Smartphones |
|
|
|
|
|
|
|
|
|
|
|
|
|
||||
1,200 |
|
|
|
|
|
|
|
|
|
|
|
40% |
|||
|
|
|
|
|
|
|
|
|
|
||||||
1,000 |
|
|
|
|
|
|
|
|
|
|
|
|
|
||
|
|
|
|
|
|
30% |
|||||||||
800 |
|
|
|
|
|
|
|
||||||||
|
|
|
|
|
|
|
|
|
|
|
|
|
|||
|
|
|
|
|
|
20% |
|||||||||
600 |
|
|
|
|
|
|
|
||||||||
400 |
|
|
|
|
|
|
|
|
|
|
|
|
|
||
|
|
|
|
|
|
|
|
|
|
|
|
|
|
|
|
|
|
|
|
|
|
|
10% |
|
|||||||
|
200 |
|
|
|
|
|
|
|
|
||||||
|
|
|
|
|
|
|
|
|
|
|
|
|
|
|
|
|
|
|
|
|
|
|
|
|
|
|
|
|
|
||
|
0 |
|
|
|
|
|
|
|
|
|
|
|
0% |
|
|
|
|
|
|
|
|
|
|
|
|
|
|
|
|
||
|
2005 |
2010 |
2015 |
|
|
|
|
||||||||
|
|
|
|
|
|
Mobile phones |
% Smart phones |
|
|||||||
|
|
|
|
|
|
|
|||||||||
|
|
|
|
|
|
|
|||||||||
© Euromonitor International |
CONSUMER FINANCE: VISA INC. AND VISA EUROPE |
PASSPORT 27 |

CATEGORY AND GEOGRAPHIC OPPORTUNITIES
Reducing losses to fraud
The US is one of the largest fraud markets for card payments in the world, and Visa has invested in acquisitions for technology to curb this trend, as well as planning for a transition in the US toward more secure EMV technology. Of the 46 markets Euromonitor International covers, the US has the 7th highest fraud rate as a percentage of all card transactions, and in absolute value terms is by far the leader with US$6 billion lost to fraud in 2011. The next closest in absolute value terms of fraud is the UK with US$549 million, followed by France with US$410 million. In addition, while most markets have decreased the share of fraudulent transactions, the US has increased from .13% to
.16% over 2006-2011. The acquisition of CyberSource by Visa will reduce the amount of online fraud that is experienced on Visa cards. However, the general global trend toward EMV chip cards over magnetic strips largely explains the reduction in the majority of markets. Visa taking the initiative and starting implementation of EMV before it is required by regulation demonstrates the company’s commitment to reduce fraud.
Fraud % of Card Payment Value 2006/2011
Country |
Fraud % |
Fraud % |
Value US$ |
|
2006 |
2011 |
mn 2011 |
||
|
||||
|
|
|
|
|
Venezuela |
1.17 |
.66 |
376 |
|
|
|
|
|
|
Greece |
.33 |
.43 |
43 |
|
|
|
|
|
|
India |
.18 |
.26 |
69 |
|
|
|
|
|
|
South Africa |
.26 |
.20 |
68 |
|
|
|
|
|
|
Mexico |
.23 |
.19 |
117 |
|
|
|
|
|
|
Spain |
.19 |
.17 |
258 |
|
|
|
|
|
|
USA |
.13 |
.16 |
5,971 |
|
|
|
|
|
|
Vietnam |
.15 |
.15 |
10 |
|
|
|
|
|
|
Israel |
.2 |
.13 |
65 |
|
|
|
|
|
|
Saudi Arabia |
.08 |
.11 |
25 |
|
|
|
|
|
|
UAE |
.08 |
.11 |
15 |
© Euromonitor International |
CONSUMER FINANCE: VISA INC. AND VISA EUROPE |
PASSPORT 28 |

STRATEGIC EVALUATION
COMPETITIVE POSITIONING
MARKET ASSESSMENT
CATEGORY AND GEOGRAPHIC OPPORTUNITIES
BRAND STRATEGY
RECOMMENDATIONS

BRAND STRATEGY
International recognition
Visa maintains one of the strongest brands globally and has high recognition across emerging and developed regions due to its targeted marketing, sponsorship and philanthropic activities. Visa has effectively leveraged its international recognition to gain acceptance to markets where its international competitors have struggled. Visa supports a variety of financial literacy efforts across regions and cooperates with local government agencies and issuing banks to maximise impact. In addition to educational campaigns, Visa partners with various organisations on poverty reduction, microfinance and disaster relief programmes. In terms of sponsorship, Visa has exclusive card acceptance rights for the Olympic and Paralympic Games to 2020, the FIFA World Cup through 2014 and selected NFL events and teams. As a share of total expenses, marketing decreased in 2011 to 23% from 28% in 2010, while total value declined from US$964 million in 2010 to US$870 million in 2011. Total marketing spend for Visa is far greater than for its international operator competitors and peaked in 2008, at over US$1 billion.
Visa: Marketing Expenditure 2006-2011
Marketing spend US$ million
1,200 |
|
|
|
|
|
|
|
|
30% |
|
|
|
|
|
|
|
|
||||
1,000 |
|
|
|
|
|
|
|
|
25% |
|
|
|
|
|
|
|
|
||||
800 |
|
|
|
|
|
|
|
|
20% |
|
|
|
|
|
|
|
|
||||
600 |
|
|
|
|
|
|
|
|
15% |
|
|
|
|
|
|
|
|
||||
400 |
|
|
|
|
|
|
|
|
10% |
|
|
|
|
|
|
|
|
||||
200 |
|
|
|
|
|
|
|
|
5% |
|
|
|
|
|
|
|
|
||||
0 |
|
|
|
|
|
|
|
|
0% |
|
|
|
|
|
|
|
|
|
|||
2006 |
2007 |
2008 |
2009 |
2010 |
2011 |
|
|
|||
|
|
|
|
|
Marketing Spend |
Marketing as % of Total Expenses |
|
|
|
|
|
|
|
|
|
|
|
|
|||
|
|
|
|
|
|
|
|
|||
Marketing % of total expenses
© Euromonitor International |
CONSUMER FINANCE: VISA INC. AND VISA EUROPE |
PASSPORT 30 |