

кейси для індивідуальної роботи 2014 н.р. / Visa Inc. and Visa Europe in Consumer Finance
.pdfVisa Inc. and Visa Europe in Consumer Finance (World)
January 2012

SCOPE OF THE REPORT
Scope
This report covers the following categories:
Consumer Finance
Financial Cards
Consumer Payments
Consumer Lending
Disclaimer
Much of the information in this briefing is of a statistical nature and, while every attempt has been made to ensure accuracy and reliability, Euromonitor International cannot be held responsible for omissions or errors.
Figures in tables and analyses are calculated from unrounded data and may not sum. Analyses found in the briefings may not totally reflect the companies’ opinions, reader discretion is advised.
Visa is the leading international operator by payment value with the largest merchant acceptance network globally. With regulatory challenges in the developed markets Visa has expanded its presence in emerging markets. Visa has invested significant resources in its m-commerce processing platform and will be competing against the largest operators for the leading position in the US.
© Euromonitor International |
CONSUMER FINANCE: VISA INC. AND VISA EUROPE |
PASSPORT 2 |

STRATEGIC EVALUATION
COMPETITIVE POSITIONING
MARKET ASSESSMENT
CATEGORY AND GEOGRAPHIC OPPORTUNITIES
BRAND STRATEGY
RECOMMENDATIONS

STRATEGIC EVALUATION
Key company facts
Visa Inc. and Visa Europe |
|
|
|
|
||||
|
|
|
|
|
|
|
||
Headquarters |
|
California, USA |
|
|
||||
|
|
|
|
|
|
|
|
|
Regional Involvement |
|
Global |
|
|
|
|||
|
|
|
|
|
|
|
||
Category Involvement |
|
Financial cards |
|
|
||||
|
|
|
|
|
|
|
||
World Card Payment Value |
39.8% |
|
|
|
||||
Share (2010) |
|
|
|
|
|
|||
|
|
|
|
|
|
|
||
World Card Payment Value |
13.3% |
|
|
|
||||
growth (2010) |
|
|
|
|
|
|||
|
|
|
|
|
||||
|
|
|
Visa: Card Payment Value 2006-2010 |
|||||
|
4,500,000 |
|
|
|
|
|
|
|
|
|
|
|
|
|
|
||
|
4,000,000 |
|
|
|
|
|
|
|
|
|
|
|
|
|
|
||
|
3,500,000 |
|
|
|
|
|
|
|
|
|
|
|
|
|
|
||
million |
3,000,000 |
|
|
|
|
|
|
|
|
|
|
|
|
|
|||
2,500,000 |
|
|
|
|
|
|
|
|
US$ |
|
|
|
|
|
|
|
|
2,000,000 |
|
|
|
|
|
|
|
|
|
|
|
|
|
|
|
|
|
|
1,500,000 |
|
|
|
|
|
|
|
|
|
|
|
|
|
|
||
|
1,000,000 |
|
|
|
|
|
|
|
|
|
|
|
|
|
|
||
|
500,000 |
|
|
|
|
|
|
|
|
|
|
|
|
|
|
||
|
0 |
|
|
|
|
|
|
|
|
|
|
|
|
|
|
|
|
|
2006 |
2007 |
2008 |
2009 |
2010 |
|
||
Visa has consistently been the leading operator by processed card payment value, merchant acceptance and issuing partnerships. Throughout 2010 and 2011 Visa has ramped up investment in maintaining the leading position and created a more innovative profile to compete in the emerging m-commerce space. Visa’s US$2 billion acquisition of CyberSource in 2010 is unlikely to be matched in the near future by the company given the size of the acquisition. However, Visa did acquire online payment networks PlaySpan and Fundamo in 2011 as well as increased issuing partnerships globally. Visa global card payment value increased 13% in 2010 to reach an almost 40% market share of all global card payment value. In 2011 the company announced the release of its online payment platform V.me, to be released in 2012, and is a partner in the joint venture m-payment platform Isis. Competing platforms do present risks for Visa and developing a complete online and mobile payment product offering will ultimately determine if the company will maintain its leading position going forward.
© Euromonitor International |
CONSUMER FINANCE: VISA INC. AND VISA EUROPE |
PASSPORT 4 |

STRATEGIC EVALUATION
Financial assessment: Balance sheet
Visa continued to grow during the financial crisis largely due to the momentum in payments moving from paper to cards which was partially offset from the declines in total consumer spending brought on by limited economic growth. However, the increases in 2010 and 2011 in revenue and net income reflect the return of consumer spending to pre-financial crisis levels. The consistent profitability is impressive considering the US$2.3 billion the company invested in acquisitions but illustrate the soundness of its balance sheet. In 2011 Visa reported net income of US$3.5 billion from total revenue of US$9.2 billion. This represents an increase of 14% and 22% for revenue and net income respectively. Visa is strictly an operator, and does not issue cards as some of its competitors resulting in comparatively lower asset levels. The company does face significant threats in pending litigation both in the US and abroad concerning its competitive practices. In 2008 and 2009 Visa settled legal challenges with Discover and American Express that cost the company billions of dollars.
Visa: Key Financial Data |
|
2010 |
2011 |
|||||||||||||||||||
(US$ million) |
|
|
|
|
|
|
|
|
|
|
|
|||||||||||
|
|
|
|
|
|
|
|
|
|
|
|
|
|
|
|
|||||||
|
|
|
|
|
|
|
|
|
|
|
|
|
|
|
|
|
|
|
|
|||
Net operating revenue |
|
8,065 |
|
9,188 |
||||||||||||||||||
|
|
|
|
|
|
|
|
|
|
|
|
|
|
|
|
|
|
|
|
|
||
Revenue growth |
|
|
|
|
|
17% |
14% |
|||||||||||||||
|
|
|
|
|
|
|
|
|
|
|
|
|
|
|
|
|
|
|
|
|||
Net income |
|
|
|
|
|
2,887 |
|
3,528 |
||||||||||||||
|
|
|
|
|
|
|
|
|
|
|
|
|
|
|
|
|
|
|
|
|
||
Net income growth |
|
36% |
22% |
|||||||||||||||||||
(year-on-year) |
|
|
|
|
|
|||||||||||||||||
|
|
|
|
|
|
|
|
|
|
|
|
|
|
|
|
|||||||
|
|
|
|
|
|
|
|
|
|
|
|
|
|
|
|
|
|
|
|
|||
Total assets |
|
|
|
|
|
33,408 |
|
34,760 |
||||||||||||||
|
|
|
|
|
|
|
|
|
|
|
|
|
|
|
|
|
|
|
||||
|
Visa: Revenue and Operating Margin |
|
||||||||||||||||||||
|
|
|
|
|
|
|
2007-2011 |
|
|
|
|
|
|
|
|
|||||||
|
10,000 |
|
|
|
|
|
|
|
|
|
|
|
|
|
|
|
|
|
70% |
|
||
|
|
|
|
|
|
|
|
|
|
|
|
|
|
|
|
|
|
|||||
billionUS$Revenue |
8,000 |
|
|
|
|
|
|
|
|
|
|
|
|
|
|
|
60% |
|
||||
|
|
|
|
|
|
|
|
|
|
|
|
|
|
|
|
|
|
|
|
marginOperating |
||
|
|
|
|
|
|
|
|
|
|
|
|
|
|
50% |
||||||||
2,000 |
|
|
|
|
|
|
|
|
|
|
|
|
|
|
|
|||||||
|
|
|
|
|
|
|
|
|
|
|
|
|
|
|
|
|
|
|||||
|
6,000 |
|
|
|
|
|
|
|
|
|
|
|
|
|
|
|
|
|
|
|
|
|
|
|
|
|
|
|
|
|
|
|
|
|
|
|
|
40% |
|
||||||
|
|
|
|
|
|
|
|
|
|
|
|
|
|
|
|
|
|
|||||
|
4,000 |
|
|
|
|
|
|
|
|
|
|
|
|
|
|
|
|
30% |
|
|||
|
|
|
|
|
|
|
|
|
|
|
|
|
|
|
|
20% |
|
|||||
|
|
|
|
|
|
|
|
|
|
|
|
|
|
|
|
|
|
|||||
|
|
|
|
|
|
|
|
|
|
|
|
|
|
|
|
|
|
|
|
|
|
|
|
|
|
|
|
|
|
|
|
|
|
|
|
|
|
|
|
10% |
|
||||
|
0 |
|
|
|
|
|
|
|
|
|
|
|
|
|
|
|
|
|
0% |
|
||
|
|
|
|
|
|
|
|
|
|
|
|
|
|
|
|
|
|
|
|
|
||
|
2007 |
|
|
2008 |
|
|
2009 |
2010 |
|
|
2011 |
|
|
|
|
|||||||
|
|
|
|
|
|
|
|
Revenue |
|
Operating Margin |
|
|||||||||||
|
|
|
|
|
|
|
|
|
|
|||||||||||||
|
|
|
|
|
|
|
|
|
|
|||||||||||||
© Euromonitor International |
CONSUMER FINANCE: VISA INC. AND VISA EUROPE |
PASSPORT 5 |
STRATEGIC EVALUATION
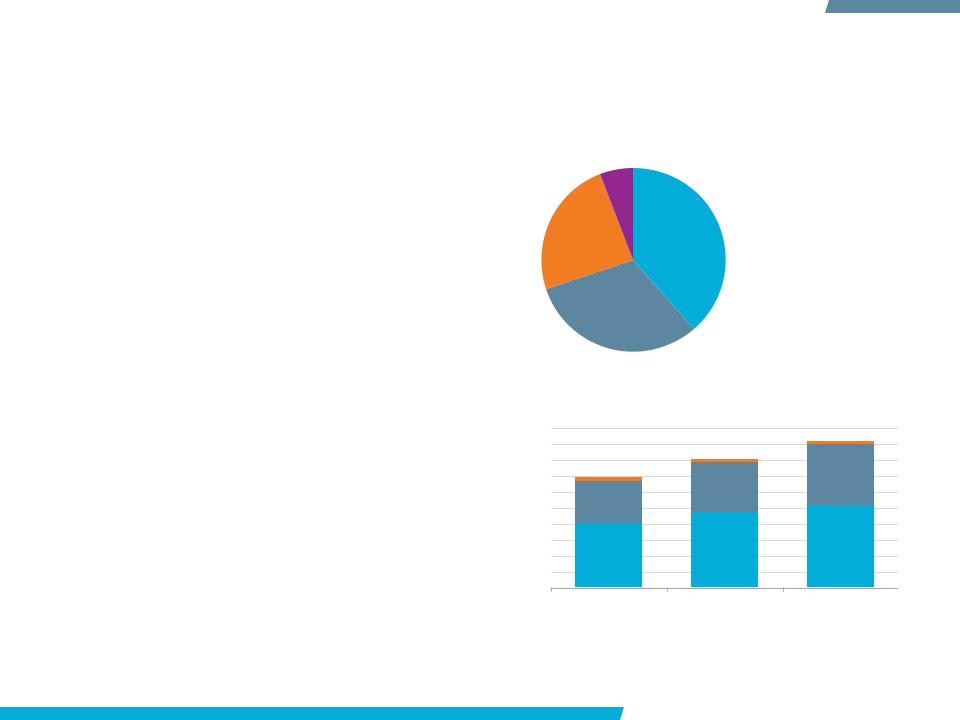
Financial assessment: Revenue analysis
Visa segments its revenue into four categories: service fees, data processing fees, international transaction fees and other revenues. Service fees is the largest segment, with 38% of total revenue in 2011. The debit interchange reform from the Durbin Amendment to the Dodd-Frank financial reform bill reduced the maximum allowed interchange rate that can be charged on debit card transactions by nearly 50%. Although the fee operators collect from a transaction is separate, issuing banks looking to recoup costs may seek the lowest cost operator or to renegotiate the rate allocated to their existing operator which could potentially drive down
Visa’s revenue over the forecast period. In addition, the five leading US issuers have considerable negotiating power as they account for 20% of Visa’s revenue. Visa has set the target of generating 50% of its revenue outside the US by 2013, as the developed world continues limited growth and emerging markets exceed expectations. In 2011, the US accounted for 56% of total revenue, down from 58% in 2009.
Visa: Revenue by Segment 2011
 Service
 Data processing
 International
transaction
 Other revenues
Visa: Revenue by Geography 2009-2011
|
10,000 |
|
|
9,000 |
|
|
8,000 |
|
|
7,000 |
|
million |
6,000 |
|
5,000 |
||
|
||
US$ |
4,000 |
|
3,000 |
||
|
2,000
1,000
0
2009 |
|
|
2010 |
2011 |
|||
|
|
Europe |
|
|
RoW |
|
US |
|
|
|
|
||||
|
|
|
|
||||
© Euromonitor International |
CONSUMER FINANCE: VISA INC. AND VISA EUROPE |
PASSPORT 6 |

STRATEGIC EVALUATION
Visa: legal matters impacting income
Due to Visa’s position as the leading international card operator in a comparatively consolidated industry, the company has been the target of a slew of legal challenges. Regulations in the US and Western Europe have sought to directly determine the appropriate fees operators are permitted to charge merchants as card payment has gained in popularity and merchant acceptance became expected from consumers.
Visa settled litigation with Discover as well as American Express, for a combined US$3.5 billion and still has pending cases regarding aspects of its pricing structure and exclusivity arrangements. The legal cases are either brought by merchants, government competitive organisations or groups of merchants.
Visa currently has pending legal challenges in Canada with the Canadian Competition Bureau, the ACCC of Australia and the supreme court in Venezuela. Despite these challenges, total payments for settled legal matters declined substantially in 2011 for Visa, to US$302 million, from US$1.2 billion in 2010.
US$ million
Visa: Payments on Settled Matters 2007-2011
2,500
2,000
1,500
1,000
500
0
2007 |
2008 |
2009 |
2010 |
2011 |
© Euromonitor International |
CONSUMER FINANCE: VISA INC. AND VISA EUROPE |
PASSPORT 7 |

STRATEGIC EVALUATION
Visa Europe
Like Visa International before the US IPO in 2007, Visa Europe is a financial institution membership association of 3,745 banks and other payment service providers across 36 European countries. The establishment of the Single European Payments Area (SEPA) in 2009 is aimed at reducing cross-border transaction costs and establish uniform interchange rates within the Eurozone. The initial implementation has boosted international operators’ share over domestic schemes as the benefits of scale are realised. However, in 2010, Visa Europe settled with the EU over antitrust charges on debit card fees - limiting debit interchange to 0.2% of a transactions value. MasterCard settled a similar case in 2009, with interchange fees set at 0.2% for debit and 0.3% for credit. As of 2012 the European Commission was still investigating Visa Europe’s credit interchange fees of 0.5-1.5% of a transaction. Since Visa Europe is accountable to the regional financial institutions, fees collected that are not reinvested in the payment infrastructure are redistributed to the banks; in 2010, 18% of total revenue was reimbursed to members.
Largest Western Europe Domestic Operating Schemes: Share of Domestic Market by Card Payment Value 2001-2010
80%
70%
60%
50%
40%
30%
20%
10%
0%
2001 |
|
|
2006 |
2010 |
||
|
|
Italy (ABI) |
|
Germany (ZKA) |
|
France (GCB) |
|
|
|
|
|||
© Euromonitor International |
CONSUMER FINANCE: VISA INC. AND VISA EUROPE |
PASSPORT 8 |

STRATEGIC EVALUATION
Visa continues acquisition strategy
Visa: Key Corporate Actions 2010-2011 |
|
|||
|
|
|
|
|
Company |
Year |
Type |
US$ mn |
|
|
|
|
|
|
Shopkick |
2011 |
Partnership |
N/A |
|
|
|
|
|
|
Fundamo |
2011 |
Acquisition |
110 |
|
|
|
|
|
|
PlaySpan |
2011 |
Acquisition |
190 |
|
|
|
|
|
|
United |
|
Exclusive payment |
|
|
2011 |
network partnership for |
N/A |
||
Continental |
||||
|
co-branded cards |
|
||
|
|
|
||
|
|
|
|
|
|
|
Mutual global |
|
|
2011 |
acceptance – Google |
N/A |
||
Wallet and Visa |
||||
|
|
|
||
|
|
PayWave |
|
|
|
|
|
|
|
|
|
Increased commercial |
|
|
Monitise |
2011 |
partnership for |
N/A |
|
|
|
m-payments |
|
|
CyberSource |
2010 |
Acquisition |
2,000 |
|
In 2011 Visa continued its aggressive acquisitions and partnership expansion to build on its technology offerings and increase its global reach. The acquisition of Fundamo increases Visa’s presence in emerging markets where mobile phones have moved to fill the gap in providing financial services where financial infrastructure is lacking. Fundamo allows for P2P payments, mobile phone top ups, bill payments and branchless banking services. The company is present in 27 emerging markets and has over five million customers.
Visa also acquired virtual good monetising platform PlaySpan, which primarily serves video gamers.
© Euromonitor International |
CONSUMER FINANCE: VISA INC. AND VISA EUROPE |
PASSPORT 9 |

STRATEGIC EVALUATION
Executive structure and key changes
Group CEO and Chairman:
Joseph Saunders
(2007)
Global Chief |
Group |
|
|
|
Marketing, |
Group |
|
||
President of |
Group |
|||
Strategy and |
Executive of |
|||
APCEMEA: |
President of |
|||
Development |
North |
|||
Elizabeth |
the Americas: |
|||
Officer: |
America: |
|||
|
||||
Buse |
Bill Sheedy |
|||
Antonio Lucio |
Oliver Jenkyn |
|||
(3/2011) |
|
|||
(3/2011) |
(3/2011) |
(3/2011) |
||
|
||||
|
|
|
Date indicates when appointed
Executive leadership
Visa’s Chairman and CEO since its IPO in 2007 has been Joseph Saunders. Saunders’ prior experience as head of card issuer Providian has served Visa well as he successfully managed Visa through its IPO and the financial crisis.
Key executive changes
Visa underwent a period of executive restructuring in March 2011 and largely drew internally to fill senior positions. Antonio Lucio was made the Global Chief Marketing, Strategy and Development officer in March 2011 after holding the previous post of Global Chief Marketing Officer. Elizabeth Buse was made Group President of Asia Pacific, Central Europe and the Middle East and Africa from the previous position of Group Executive of Visa International. Oliver Jenkyn was promoted to Executive of North America from the position of Global Head of Strategy and Corporate Development for Visa. Bill Sheedy was also promoted internally to Group President of the Americas from the position of President of North America.
© Euromonitor International |
CONSUMER FINANCE: VISA INC. AND VISA EUROPE |
PASSPORT 10 |