

AnalysisoftheCompanysFinancialStrategy
.pdf20
Table 2.1.2
FrieslandCampina income statement analysis
|
2013 |
2014 |
2015 |
|
|
|
|
Cost of goods |
72.8% |
81.9% |
84.6% |
|
|
|
|
Commercial costs |
19.9% |
17.2% |
22.2% |
|
|
|
|
Gross profit |
27.2% |
18.1% |
15.4% |
|
|
|
|
The negative impact of embargo was obvious from the first glance. In 2015 the revenue slumped 2 times. Another negative moment was the increased share of production costs: cost of goods in 2013 was 72.8%, in 2014 81.9%, in 2015 84.6%. Because of that the share of gross profit fell too from 27.2% to 18.1% in 2014 and to 15.4% in 2015. Within present conjuncture, the commercial costs were decreased from 19.9% in 2013 to 17.2% in 2014, yet their percentage ratio in 2015 increased by 22.2%. High production costs, disproportionate reduction of commercial costs led to negative sales profit. Among the other items that must be admitted were the growth of other incomes and other costs.
The amount of equity in 2015 increased due to shareholdings and added capital. This gives a warning of parent company’s financial support. In 2015, the net balance of cash flows was positive, just like in 2013. The cause was the significant increase of financing cash flow and the capital infusion from the parent company. Operating cash flow decreased more than 55% but remained negative: the payments for current liabilities overcome incomes and the net balance increased 5 times. Another interesting point is the reduction of salaries by 21.6% in 2015 which witnessed the staff reduction for cost saving. The net investing cash flow balance also remained negative and increased 6 times due to incomes item drop and expenses item growth.
Due to the fact that the company is non-public, and all the values are commercial secrets, all the cash flows meanings are omitted within this thesis.
Electronic copy available at: https://ssrn.com/abstract=3194478
21
Nevertheless, they were also analyzed, and relative values are as follows. In 2015, the operating cash flow was negative and 5 time as more in 2014. The major reason of that was the drop-in incomes from sales. Compared to 2014, it was 3 times lower. Meanwhile, the payments dropped only twice. For that reason, the OCF occurred to be negative.
Investing cash flow was also negative three times as much as the previous year’s value. In the same way as for OCF, the outcome flows exceeded income ones which led to negative ICF. The incomes also dropped 5 times and payments increased 6 times. Financing cash flow was positive and more than 20 times higher than previous meaning. The main reason for that was support from parent company.
The first method for solvency evaluation is the balance liquidity estimation through the comparison of different assets and liabilities group.
Assets can be classified into following groups:
1)A1 – the quickest assets (monetary assets and short-term investments);
2)A2 – quick assets (short-term accounts receivables and other current assets);
3)A3 – slow assets (inventory, tax value added for purchased goods, longterm accounts receivables);
4)A4 – sticky assets (fixed assets).
The first 3 groups belong to current assets of the company.
Liabilities can be divided by the payback period into following parts:
1)L1 – accrued liabilities (accounts payable, dividends payout, other short-term liabilities and loans weren’t payed back in time);
2)L2 – short-term liabilities (short-term bank loans and other loans which must be paid back within 12 months);
3)L3 – long-term liabilities (long-term bank loans and other long-term liabilities);
Electronic copy available at: https://ssrn.com/abstract=3194478
22
4) L4 – constant liabilities (shareholders’ funds). The first 3 groups are the company’s external liabilities.
For indicating the company’s balance liquidity, I compared the amount of each group. The balance can be named as absolutely fluid if the following conditions are met:
А1 > L1
А2 > L2
А3 > L3
А4 < L4
The inequation А1 > L1 can be considered as the witness of enterprise’s solvency and that they have enough absolutely quick assets for covering accrued liabilities. The inequation А2 > L2 can be estimated as a solvency in short-term period and ability to cover short-term loans in case of receiving accounts from debtors’. The comparison of these groups also helps to identify the current accounting liquidity (or insolvency) in short-term perspective.
A3 > L3 inequation means that the future solvency of the company in case of well-timed accounts receivables achievement within the period equal to the average current assets turnover. A3 and L3 comparison shows the perspective liquidity on which the future long-term solvency is based.
If the first 3 inequations met, in other words current assets overcome external liabilities, the last inequation met too. It considered as an ownership of the company working capital and as the crucial financial capability sign. The terms mentioned above met within FrieslandCampina balance, so it can be totally considered as an absolutely fluid one. The liquidity, profitability and activity coefficients were analyzed within financial comparative analysis of FrieslandCampina and Valio.
Electronic copy available at: https://ssrn.com/abstract=3194478

23
Accounts receivable is the most important aspect of financial performance indicated liabilities which clients are in charge for but within the company’s access to. The analysis of this indicator is extremely vital as the constant growth of this meaning not only shows the insolvency of debtors, but also lead to insurance revocation.
The total receivables generally halved in current receivables and overdue ones. If the clients properly pay for the products they purchased according to the conditions agreed upon beforehand in contract, the current receivables equal total. Otherwise it flows into overdue ones. There are multiple reasons for that from problems with delivery documents and set off on out to payments for services waited by clients. Nevertheless, these delays cannot pass unheeded and must be analyzed.
For analyzing this, I collected total receivables data from 2014 to 2015. Within 20 considered periods (Figure 2.1.1 and 2.1.2).
100%
98%
96%
94%
92%
90%
88%
86%
84%
82%
80%
Current and overdue accounts receivable from total accounts receivable in 2014, %
 Overdue
 Current
Figure 2.1.1 Shares of current and overdue receivables of FrieslandCampina in 2014, %
Electronic copy available at: https://ssrn.com/abstract=3194478

24
100%
98%
96%
94%
92%
90%
88%
86%
84%
82%
80%
Current and overdue accounts receivable from total accounts receivable in 2015, %
 Overdue
 Current
Figure 2.1.2 Shares of current and overdue receivables of FrieslandCampina in 2015, %
The graphs above indicate the share of current and overdue receivables in 2014 and 2015. It is obvious that in 2015 clients paid worse for purchased goods compared to 2014. I can also admit the solvency improvement in 3rd quarter of 2015. It can be caused by the switch from paper to electronic workflow.
For the dairy branch normal limits for AR turnover is 61 and less days. The growth of this coefficient signalizes not only the increase of insolvent clients but also softer debtors’ reconciliations policy (switch from prepayments to payments delay according to different expiration dating period). The higher AR turnover, the lower necessity in working capital for sales amount. In 2013, this meaning was 68.8 days, in 2014 63 days. In 2015 this meaning was 74.8 it is worse than the 2013 and 2014 meanings. The meaning is also beyond normal limits. The most optimal instrument for acceleration AR turnover is the introduction of electronic workflow32. In this case, the exchange with legally valid documents through providers not only helps to provide clients with well-timed and on a full-scale documentary, but also
32 34.Koussisc, N., & Agliardia, E. (2013). Optimal Capital Structure and the Impact of Time-to-Build. Finance Research Letters, 10(3), 124-130. doi:10.1016/j.frl.2013.02.002
Electronic copy available at: https://ssrn.com/abstract=3194478

25
eliminate quickly problematic documents blocked for pay. It also allows reducing mail and delivery service expenses. The development of electronic exchange with legally valid documentary and compulsory EUTD (electronic universal transfer document) introduction in July 2017 stated by the government allow all the companies to achieve well-timed payments for sold goods. Beside this, in order to accelerate accounts payable, there must be introduced electronic service acceptance acts and invoices. The last step may seem doubtful, yet it is a well-known fact that retailers generally tend to detain payments for products until you pay back for marketing and commercial service33.
For conducting cost analysis, I collected data of the whole-embargo years from 2014 to 2015. In general, 47 types of costs were collected for each year and the sample size contained 94 meanings. I estimated the necessity to reduce costs by the symbioses of ABC and XYZ analysis and also from the perspective of managing type and the allowance to reduce.
ABC analysis. For accomplish this, I evaluate each cost item share and according to this, assign them values A, B or C. If the share is higher than 10%, cost item gets A mark. With the share from 1 to 10% cost item belongs to B group. Finally, if the share is less than 1% in total cost amount, this item gets C mark. In 2015, 14 items belong to A group, 18 - to B group, 15 - to C group. In 2015, A-group reduced significantly: only 2 items got there. B group also downscaled from 18 to 12. The C group doubled its’ size amount to 33 values.
XYZ analysis. For that procedure, I calculated the covariation of each meaning by dividing preliminarily calculated standard deviation for each cost item and their mean values. If the covariation is less than 10%, the item goes to X group.
33 10.Avdasheva, S., & Shastitko, A. (2011, November 7). Russian Antitrust Policy: Power of Enforcement versus Quality of Rules. Post-Communist Economies , 23(4), 493-505. doi:10.1080/14631377.2011.622571
Electronic copy available at: https://ssrn.com/abstract=3194478

26
If the covariation is between 10 and 25%, it belongs to Y group. Otherwise, it has Z mark.
Analysis based on manageable type. This type of analysis allows identifying which cost items have to be reduced significantly and which one must not be changed not by a fraction34. All the costs were split into 3 main groups: manageable, partly manageable and non-manageable. There are 16 manageable costs, 31 partly manageable and 6 non-manageable costs.
Based on every cost analysis made above, I composed a matrix from ABC and XYZ-analysis symbioses. Group AX consists of costs with the large share and low covariation. It means that it has a stable amount and easily predictable. Group AY is almost the same except for the fact that covariation is higher, and they are harder to predict. AZ supposes large costs which fluctuate, hard to forecast and for that reason must be reduced. BX group has medium share but low fluctuation. BY and is almost the same with AY except for the share which is lower. BZ has medium share and high fluctuations. The CX, CY and CZ groups are unnecessary to describe as it is obvious. Taking into account manageable characteristics, I advocate that 44.3% of costs may be reduced significantly which may lead to significant profit growth.
For anti-crisis strategy appliance, there must be several assumptions35. In case of estimated company, there first one was profit loss. Nevertheless, there must be another strong factor leading to anti-recession strategy acceptance. That is why it was decided to evaluate the probability of bankruptcy. In order to conduct such estimation, I opted for the most popular bankruptcy forecast methods. It was decided that if one model shows the probability of bankruptcy, the anti-crisis model will be used. The results are presented at the Table below.
3452.Womer, N. (1989). Cost Analysis: A Methodological Statement. Journal of Cost Analysis, 7(1), 27-41.
3521.Chizh, V., & Gavrylenko, V. (2016). Models of Crisis Management in a Changing Environment. Periodyk Naukowy Akademii Polonijnej, 18(3). doi:10.23856/1812
Electronic copy available at: https://ssrn.com/abstract=3194478
27
Table 2.1.3
Bankruptcy probability estimation of FrieslandCampina, 2015
|
Model Offered by |
|
|
|
Formula |
|
|
Meaning |
|
|
Bankruptcy |
|
|
|
|
|
|
|
|
|
Probability |
|
|||
|
|
|
|
|
|
|
|
|
|
|
|
|
|
|
|
|
|
|
|
|
|
|
|
|
|
|
|
|
|
|
|
|
|
|
|
|
|
|
|
|
|
|
Z = 1 – 0.98Х1 – 1.8Х2 – 1.83Х3 – 0.28Х4 |
|
|
|
|
|
|
|
|
|
|
|
|
X1 |
- Working Capital / Current Assets |
|
|
|
|
|
|
|
|
|
|
|
X2 |
- Working Capital / Average Current |
|
|
|
|
|
|
|
|
Savitskaya |
|
|
Assets |
|
|
-6.97 |
|
|
Low |
|
|
|
|
|
|
X3 |
- Equity / Total Assets |
|
|
|
|
|
|
|
|
|
|
|
X4 |
- Equity / Average Current Assets |
|
|
|
|
|
|
|
|
|
|
|
Z ≤ 0 stable financial situation |
|
|
|
|
|
|
|
|
|
|
|
|
|
|
|
|
|
|
|
|
|
|
|
|
|
|
|
|
|
|
|
|
|
|
|
|
|
|
Z = 0.53X1 + 0.13X2 + 0.18X3 + 0.16X4 |
|
|
|
|
|
|
||
|
|
|
|
X1 |
- Profit Before Tax / Current Liabilities |
|
|
|
|
|
|
|
|
|
|
|
X2 |
- Current Assets / Total Liabilities |
|
|
|
|
|
|
|
|
|
|
|
X3 |
- Current Liabilities / Total Assets |
|
|
|
|
|
|
|
|
Taffler and Tisshaw |
|
|
X4 - No-credit Interval |
-0.05 |
|
|
High |
||||
|
|
|
|
No-credit Interval = (Immediate Assets - |
|
|
|
|
|
|
||
|
|
|
|
Current Liabilities) / (Operating Costs - |
|
|
|
|
|
|
||
|
|
|
|
Depreciation) |
|
|
|
|
|
|
||
|
|
|
|
(-∞; 0.2) bankruptcy company |
|
|
|
|
|
|
||
|
|
|
|
|
|
|
|
|
|
|
||
|
|
|
|
|
|
|
|
|
|
|
|
|
|
|
|
|
Z = 0.717X1 + 0.847X2 + 3.107X3 + |
|
|
|
|
|
|
||
|
|
|
|
|
|
|
|
|
|
|||
|
|
|
|
0.42X4 + 0.995X5 |
|
|
|
|
|
|
||
|
|
|
|
X1 |
- Working Capital / Total Assets |
|
|
|
|
|
|
|
|
|
|
|
X2 |
- Retained Earnings / Total Assets |
|
|
|
|
|
|
|
|
Altman |
|
|
X3 - Earnings Before Interest and Taxes / Total |
3.65 |
|
|
Low |
||||
|
|
|
|
Assets |
|
|
|
|
|
|
||
|
|
|
|
Х4 - Shareholders’ Equity / Liabilities |
|
|
|
|
|
|
||
|
|
|
|
X5 |
- Sales / Total Assets |
|
|
|
|
|
|
|
|
|
|
|
Z > 1.23 low probability of bankruptcy |
|
|
|
|
|
|
||
|
|
|
|
|
|
|
|
|
|
|
||
|
|
|
|
|
|
|
|
|
|
|
|
|
|
|
|
|
Z = 1.03X1 + 3.07X2 + 0.66X3 + 0.4X4 |
|
|
|
|
|
|
|
|
|
|
|
|
X1 |
- Working Capital / Total Assets |
|
|
|
|
|
|
|
|
|
|
|
X2 |
- Earnings Before Interest and Taxes / Total |
|
|
|
|
|
|
|
|
Springate |
|
|
Assets |
|
|
-0.3 |
|
|
High |
|
|
|
|
|
X3 - Earnings Before Taxes / Current Liabilities |
|
|
|
|
|
||||
|
|
|
|
|
|
|
|
|
|
|
||
|
|
|
|
X4 |
- Sales / Total Assets |
|
|
|
|
|
|
|
|
|
|
|
Z <0.862 classified as potential company |
|
|
|
|
|
|
|
|
|
|
|
|
bankrupt. |
|
|
|
|
|
|
|
|
|
|
|
|
|
|
|
|
|
|
|
|
|
|
|
|
|
|
|
|
|
|
|
|
|
|
The 2 out of 4 models highlighted the probability of bankruptcy. The conducted analysis proved that the strategy which must be used is anti-crisis strategy to evaluate present financial position of the company and improve it.
Electronic copy available at: https://ssrn.com/abstract=3194478
28
2.2Competitive analysis of dairy companies
2.2.1Competitive financial analysis of dairy companies
Another stage of company’s financial strategizing is financial analysis of its’ main competitors. For eliciting them, market research must be analyzed with a view to sales amount.
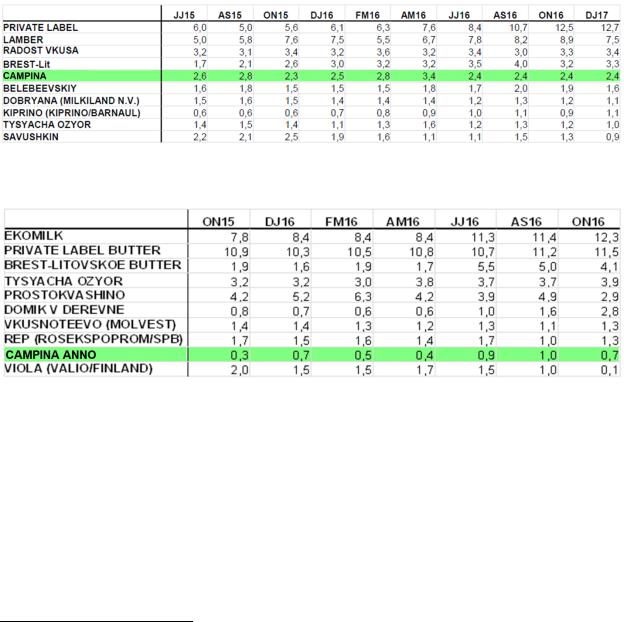
Table 2.2.1.1 Yellow cheese sales amount in 16 biggest Russian cities in 2016, thousands of kg36
Table 2.2.1.2 Butter sales amount in 16 biggest Russian cities in 2016, thousands of kg37
Tables above present yellow cheese and butter sales amount at Russian cities with a million plus population in 2016. Based on this analysis, I identified FrieslandCampina main competitors for financial analysis conducting:
1)Valio, LLC
2)Lactalis, LLC
3)Belebeevsky, LLC
3657.AC Nielsen market research. (2017). URL: www.nielsen.com
3757.AC Nielsen market research. (2017). URL: www.nielsen.com
Electronic copy available at: https://ssrn.com/abstract=3194478
29
4)Kiprino, LLC
5)Elansky, JSC
6)Ostankinsky, JSC
7)Savyshkin, LLC
8)Umalat, JSC
9)Univita, LLC
10)Ecomilk, LLC
Half of the companies mentioned above have a procedural and institutional form as limited liabilities. That means that their financial reports were hidden and are not allowed in free access. For that reason, in order to conduct such analysis, I used Kontur.Focus resource.
Table 2.2.1.3
Financial capability results of Russian dairy companies foods in 2014-2015
|
Equity-Assets |
Debt-Equity Ratio |
Working Capital to |
|||
|
Ratio |
Current Assets Ratio |
||||
Company |
|
|
||||
|
|
|
|
|
|
|
|
Meaning |
Meaning |
Meaning |
|||
|
2014 |
2015 |
2014 |
2015 |
2014 |
2015 |
Valio, LLC |
0.63 |
0.63 |
0.58 |
0.64 |
0.62 |
0.61 |
Lactalis, JSC |
0.49 |
0.46 |
1.05 |
1.2 |
0.37 |
0.29 |
Belebeyevsky, JSC |
0.46 |
0.61 |
1.18 |
0.64 |
0.22 |
0.45 |
Kiprino, LLC |
0.29 |
N/A |
2.43 |
N/A |
0.29 |
N/A |
Elansky, JSC |
0.03 |
0.04 |
28.29 |
22.55 |
-0.28 |
-0.69 |
Ostankinsky, JSC |
0.42 |
0.42 |
1.38 |
1.39 |
0.22 |
0.22 |
Savyshkin, LLC |
-0.02 |
-0.01 |
-53.41 |
-86.47 |
-0.03 |
-0.02 |
Umalat, JSC |
0.04 |
0.13 |
26.44 |
6.51 |
-0.55 |
-0.5 |
Univita, LLC |
N/A |
0.05 |
N/A |
17.49 |
N/A |
0.04 |
Ecomilk, LLC |
0.01 |
0.01 |
137.12 |
124.81 |
0.01 |
0.01 |
The most financially sound was Valio, which had the best coefficients (Table 2.2.1.3). I should also admit the financial leverage increase in 2015 with 0.06 p.p., which shows that the company fell back on additional borrowing in order to overcome imposed embargo. According to open source data, in 2016 Valio was going to continue of local production and manufacturing development in Russia,
Electronic copy available at: https://ssrn.com/abstract=3194478