

Static Testing
The next step in characterizing the gray-scale fiber aligner motion is to measure static movements intended to create motion along easily predictable patterns. The tests described below seek to characterize the range, flexibility, and hysteresis of fiber actuation. Such static movements will serve as the foundation for the auto-alignment algorithms discussed in later sections. Unless otherwise mentioned, tests described in this and the following sections utilize devices with a fiber cantilever length of L=12mm.
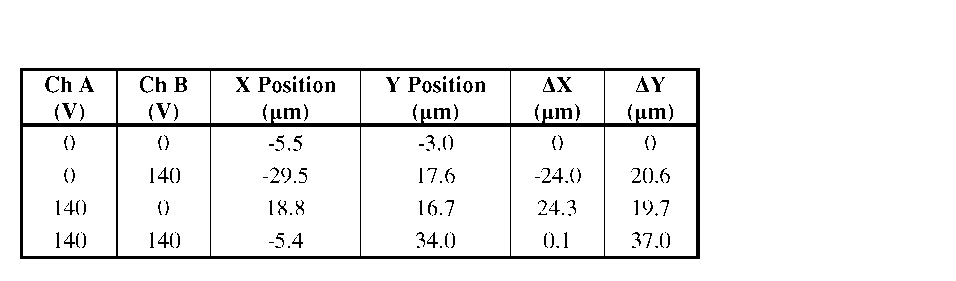
Table 6.3: Measured fiber locations for discrete actuation voltages. These 4 points form the corners of a diamond shaped alignment area.
“Diamond” Extents
The actuation mechanism of the gray-scale fiber aligner inherently defines a diamond-shaped area over which a fiber tip can be aligned, as described in Chapter 5. Thus, to establish the overall range of operation for this device, we must measure the size of this diamond-shaped area corresponding to the extreme movements of each alignment wedge. The voltage on either actuator was limited to 0-140V to avoid breakdown of the 2p,m buried oxide (based on experience), restricting the overall travel range.
 Four
discrete voltage combinations were applied to the two actuators to
move the fiber to the four corners of the diamond-shaped alignment
area. The location of the cleaved fiber tip was measured for each
case using the facet scanning capability described earlier (with
Gaussian fits). The voltage combinations, as well as absolute and
relative fiber locations for this device, are given in Table 6.3.
These four points, shown graphically in Figure 6.6,
create a relatively symmetric diamond. Fiber positions within the
diamond-shaped bounds of these measurements (37 ^m tall, 48 ^m wide)
should be achievable with the appropriate set of applied voltages.
The fiber tip displacements measured in Figure 6.6
are slightly larger than the fiber displacement at the alignment
wedges because the fiber tip extends beyond the wedges for ease of
testing, causing a small additional tip displacement. More
discussion on this subtle point is given in Appendix C.
Four
discrete voltage combinations were applied to the two actuators to
move the fiber to the four corners of the diamond-shaped alignment
area. The location of the cleaved fiber tip was measured for each
case using the facet scanning capability described earlier (with
Gaussian fits). The voltage combinations, as well as absolute and
relative fiber locations for this device, are given in Table 6.3.
These four points, shown graphically in Figure 6.6,
create a relatively symmetric diamond. Fiber positions within the
diamond-shaped bounds of these measurements (37 ^m tall, 48 ^m wide)
should be achievable with the appropriate set of applied voltages.
The fiber tip displacements measured in Figure 6.6
are slightly larger than the fiber displacement at the alignment
wedges because the fiber tip extends beyond the wedges for ease of
testing, causing a small additional tip displacement. More
discussion on this subtle point is given in Appendix C.
Power Mapping
The diamond extents test was simply a demonstration of large single movements.
Yet, we would also like to show that the gray-scale fiber aligner provides some of the same functionality as the electrostrictive XYZ stages. Using LabVIEW, we implemented a raster actuation routine to map the fiber-fiber coupled power as a function of applied voltages to channels A and B of the gray-scale fiber aligner. This scan is analogous to the 2-D facet scan performed by the electrostrictive stages.
Shown in Figure 6.7 are coupled power contours that are plotted vs. voltage
2
squared (since comb-drive force scales with V ). The concentric circular power contours clearly demonstrate that movements of each alignment wedge behave predictably and rather symmetrically. The single dominant coupling peak is a result of the fiber-fiber setup being used in this test; however optimizing coupling to devices with secondary peaks is always a concern during fiber alignment and will be discussed in later sections.