

Introduction
The previous chapter has introduced the design, modeling, and fabrication of a novel 2-axis optical fiber alignment platform, the gray-scale fiber aligner, for systems requiring in-package active fiber alignment. The development of this device is directly aimed towards addressing some of the primary challenges identified by ITRS in the area of optoelectronic packaging [77]. While the basic mechanical operation of this device was briefly demonstrated, the overriding purpose of this device is to optimize optical coupling between an optical fiber and a corresponding target (another fiber, waveguide, laser, etc). Therefore, this chapter is dedicated to the static and dynamic characterization of the gray-scale fiber aligner through multiple optical coupling configurations.
The development of an experimental setup for testing both fiber-fiber and fiber- waveguide coupling will first be discussed in Section 6.2. Static testing results will then be reviewed in Section 6.3, with particular emphasis on evaluating actuation range and controlling movement of the fiber tip. Section 6.4 will discuss auto-alignment algorithms for both coarse and fine alignment, with testing results focused on speed and resolution presented in Section 6.5. Discussion of testing results will be given in Section 6.6. Concluding remarks are provided in the final section.
Experimental Setup
All infrastructure and experimental testing discussed in this chapter was developed in the MEMS Sensors and Actuators Lab (MSAL) at UMD. The following sub-sections will describe both the hardware assembled for optical testing and some characterization of the system limitations.
Hardware
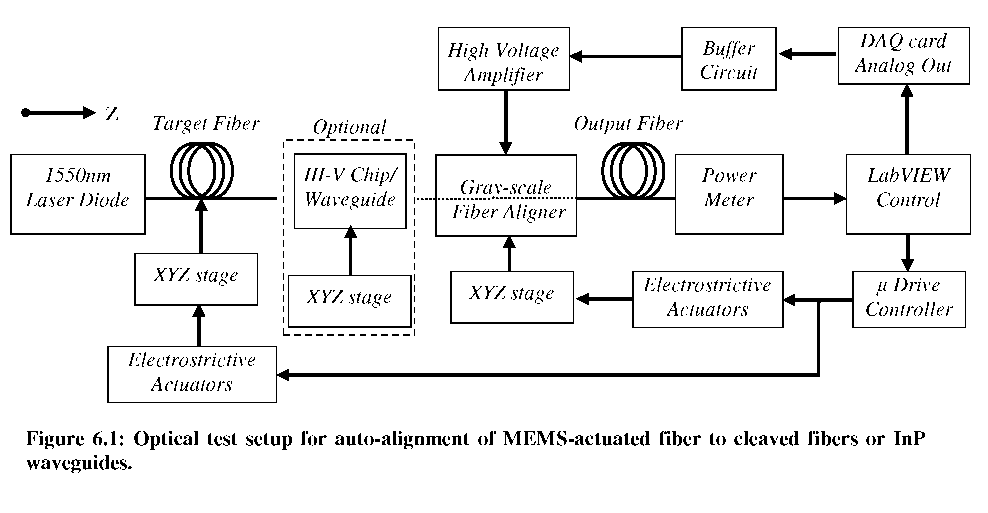
The optical setup developed to test the gray-scale fiber aligner is shown schematically in Figure 6.1. A 1550nm laser diode is used as the optical source. The target fiber is fixed on a calibrated electrostrictive XYZ stage controlled via LabVIEW. In some cases, the target fiber is aligned to an indium-phosphide (InP) chip with suspended waveguides [166, 167]. The gray-scale fiber aligner holds the output fiber and is fixed on a second electrostrictive XYZ stage. In general, the location of the gray-scale fiber aligner chip is not altered during alignment testing to avoid repositioning the electrical probes. The output fiber is connected directly to an optical power meter, which is sampled by LabVIEW. Actuation voltages for the gray-scale fiber aligner are provided through two analog-out channels on a data acquisition (DAQ) card and a high-voltage (HV) MEMS amplifier. The limited current output of the DAQ card (5 mA), coupled with the low input impedance of the HV amplifier (50Q), made it necessary to add an op- amp buffer circuit to increase current output in order to achieve high voltages (up to 200V). The primary components and associated model numbers are listed in Table 6.1.
Instrumentation Characterization and Limitations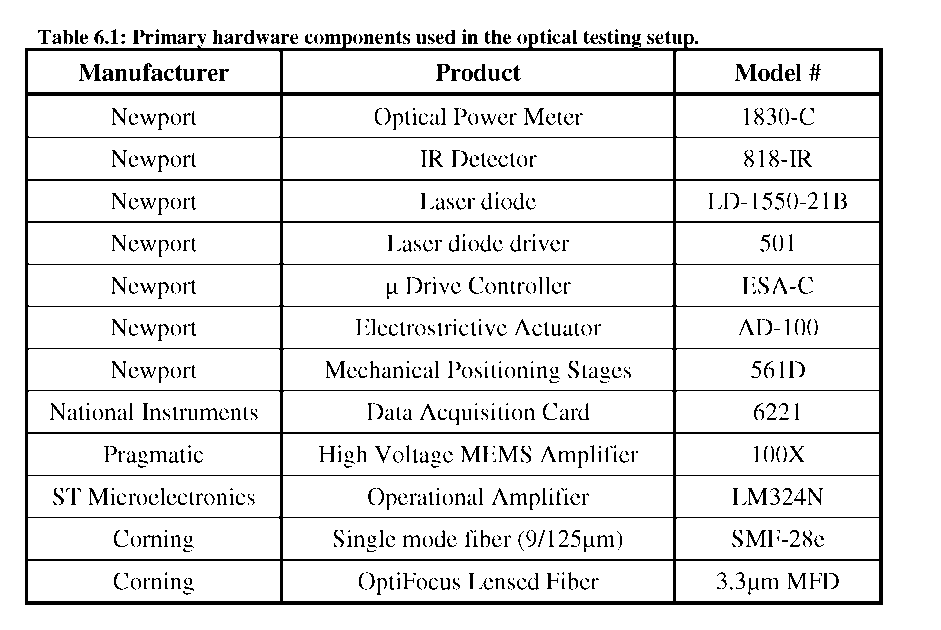
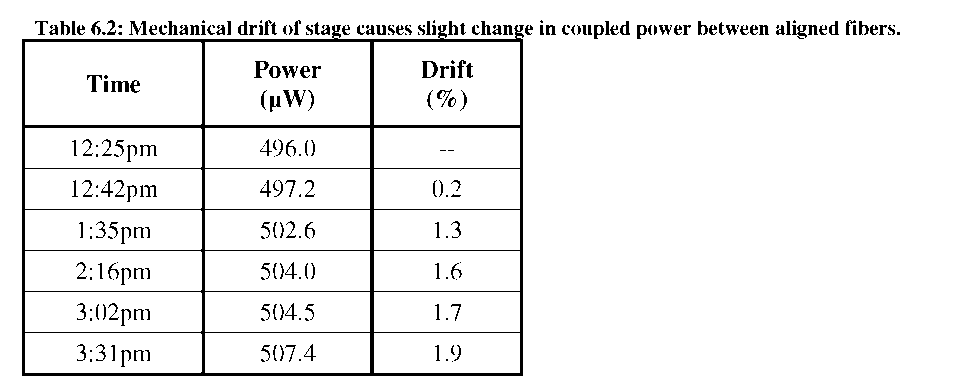
Prior to testing devices, it was necessary to characterize the limitations of the
experimental setup. Since optical coupling is position sensitive, mechanical drift between input and output was a particular concern. Two fibers were manually aligned with the XYZ stages to peak coupling and the power monitored over the course of a few hours. As shown in Table 6.2, slight drift between stages caused <2% change in coupled power over a 3 hour period. Since peak coupling could be restored using X-Y positioners, we concluded that negligible drift occurred along the Z-axis. This fact is important because the gray-scale fiber aligner already adjusts for X-Y position, but changes in separation would alter the peak power which must remain stable during alignment tests. Therefore, the stability of the peak power is limited by optical noise (source and detector variations) and mechanical vibrations in the system; estimated to be <1% for short coupling experiments.
 parameter
Gaussian fit to quantify the shape of the peak:
parameter
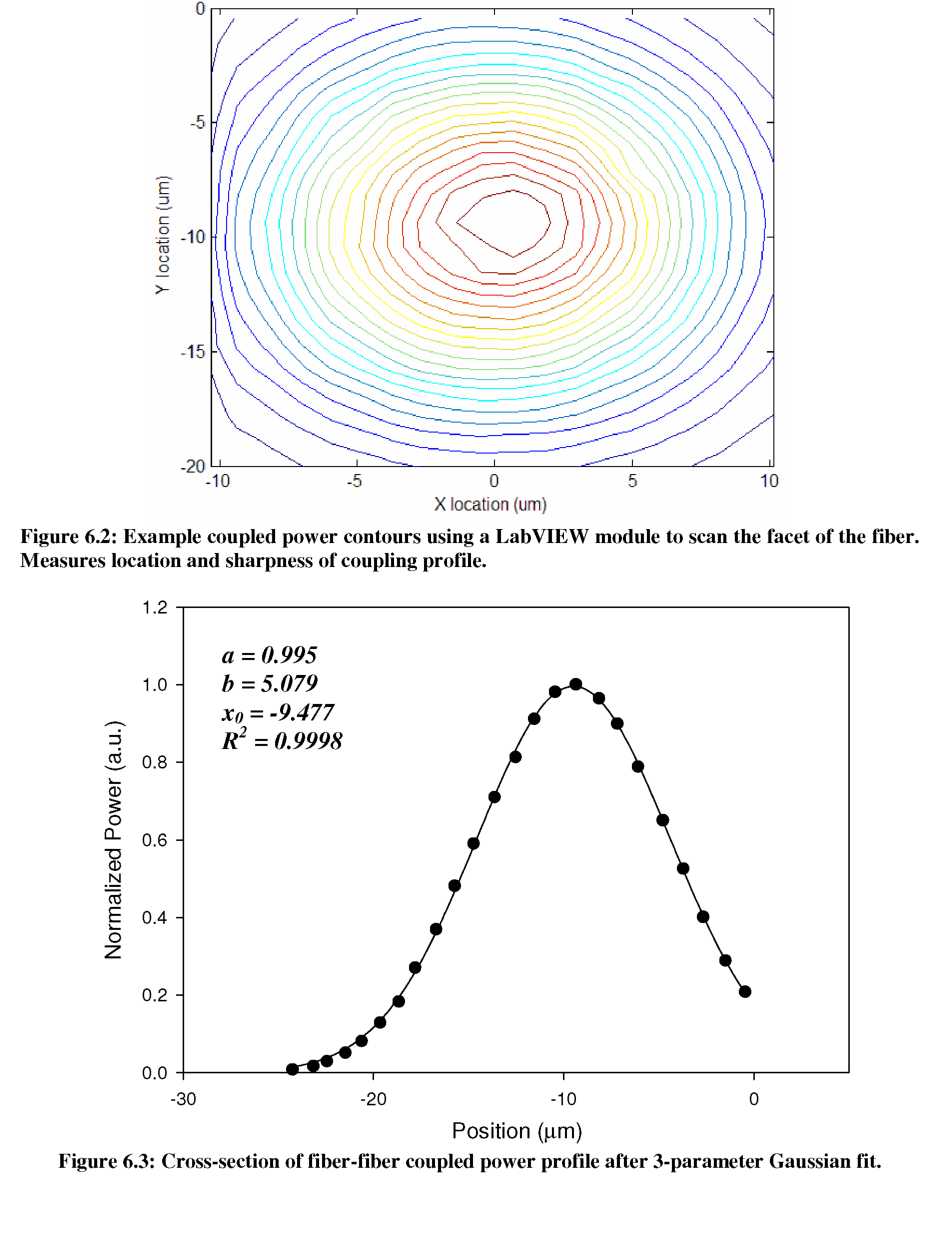
Gaussian fit to quantify the shape of the peak:This Gaussian fit is imperative for measuring the sharpness of the peak, as shown in Figure 6.3, which provides a numerical correlation between the coupled power and axial misalignment between input/output. As a worst case scenario estimate, the “true” peak power is inferred using the Gaussian width parameter by assuming the highest recorded power during the facet scan was 0.5pm misaligned (/ way between two points on the 1pm scan grid). If a higher power is observed during the alignment tests, potentially due to nearly “perfect” alignment or small noise fluctuations, the higher power is taken as the “true” peak power instead. Since the peak in Figure 6.3 is relatively wide, achieving alignment resolutions of ~1.5p,m will require final coupling thresholds close to 95% of the peak power.
First, transient fiber-fiber coupling experiments were conducted to evaluate the switching speed of the gray-scale fiber aligner. The optical power meter was temporarily replaced with a high-speed photoreceiver (New Focus 1811 IR-DC 125MHz Low Noise Photoreceiver). Note that this photoreceiver is noisy compared to the optical power meter and has a small dynamic range, making it ill-suited to alignment experiments but acceptable for assessing transients. The gray-scale fiber aligner was initially partially aligned with an output fiber such that a small amount of coupled power was received. The fiber was then actuated to a position of different coupling while recording the actuation voltage and photoreceiver output voltage simultaneously via the DAQ card.
Measurements of fiber aligner switching were taken during both “Up” and “Down” actuation trajectories (starting and ending voltage combinations), as shown in Figure 6.4. During the “Up” trajectory, the fiber was sometimes observed to slightly over-shoot the final position, possibly due to momentum carrying it off the surface of the alignment wedges. It is expected that the switching speed will depend slightly on the size and direction of the fiber trajectory, yet typical switching speeds of <1ms were observed.
Figure
6.4: Actuation speed of the gray-scale fiber aligner during (a)
“Up” and (b) “Down” actuation trajectories. In some “Up”
experiments, the fiber over-shoots the final position, as in (a).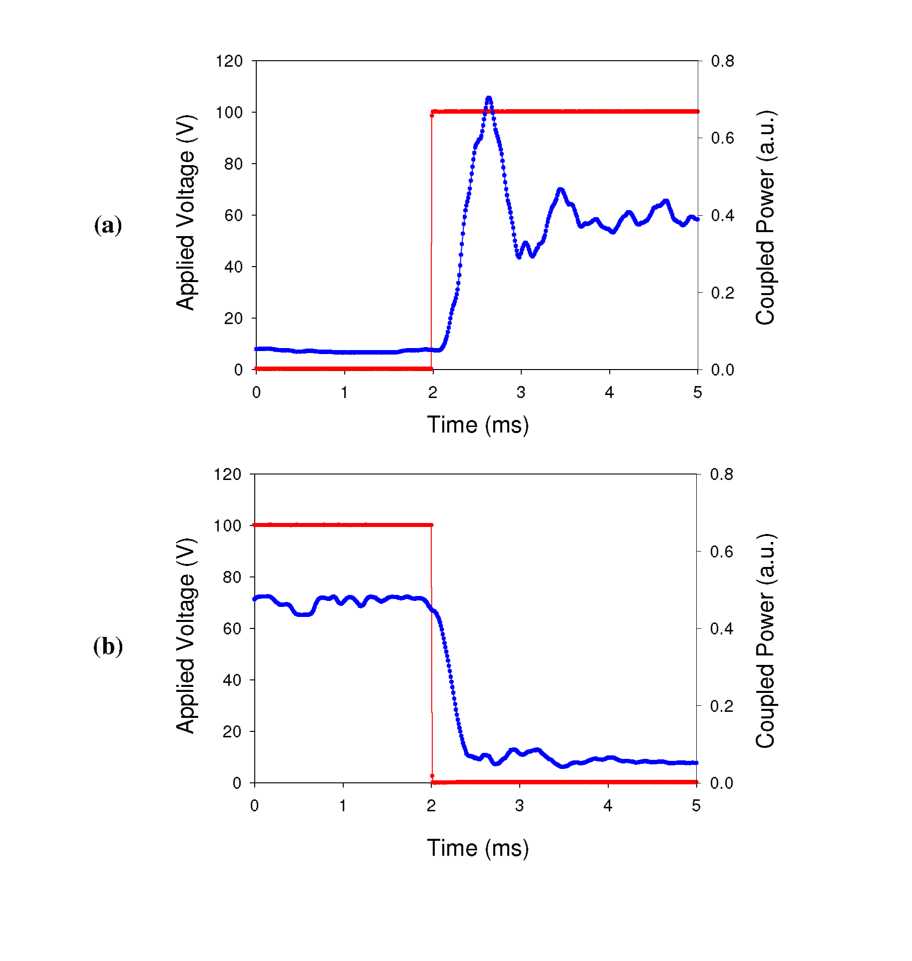
Since the fiber actuation occurs in ~1 millisecond, these tests confirm that the required settling time is limited by the LabVIEW control program and power meter. Although the optimum settling time for each fiber trajectory may be different, our results indicate that a universal settling time of at least 300ms should be used between fiber movements. While changes to the experimental setup could potentially increase this actuation speed, later fiber alignment tests will show that such speeds have still produced fast and reliable fiber alignment.