

Actuation Concept Demonstration
The proposed new fiber actuation mechanism was first evaluated using a white- light optical profiler (Veeco WYKO NT1100) to track both horizontal and vertical movement of the fiber caused by actuating the sloped wedges. In static mode, this profiler uses reflected light from horizontal surfaces to create a full-field 3-D height map in only a few seconds. Since an optical fiber is cylindrical, appreciable reflected light is only collected from a thin strip (1-2pm wide) representing the top of the fiber. The silicon actuators in the background serve as a vertical reference point, enabling changes in both the horizontal and vertical location of the fiber to be determined. Due to limited magnification available in the system and changing light conditions as a fiber is deflected, the accuracy of measurement is estimated at only <2pm. While this measurement method is clearly not intended to evaluate alignment to another fiber, it is adequate for demonstrating the principle of operation of the gray-scale fiber aligner.
Figure 5.17 shows the measured location of the optical fiber for different sets of applied voltages (up to 120V). Three primary actuation trajectories are shown.
Conclusion
This
chapter has introduced a new on-chip method for actuating an
optical fiber in
axes.
Opposing electrostatic comb-drives with integrated 3-D wedges
create a dynamic v-groove capable of altering the horizontal and
vertical alignment of an optical fiber
Figure
5.17: Fiber locations measured using an optical profiler for
different actuation voltage combinations. Each colored path
represents a trajectory caused by actuating either wedge by itself
(angled trajectories #1 and #3) or both wedges together (straight
up #2).
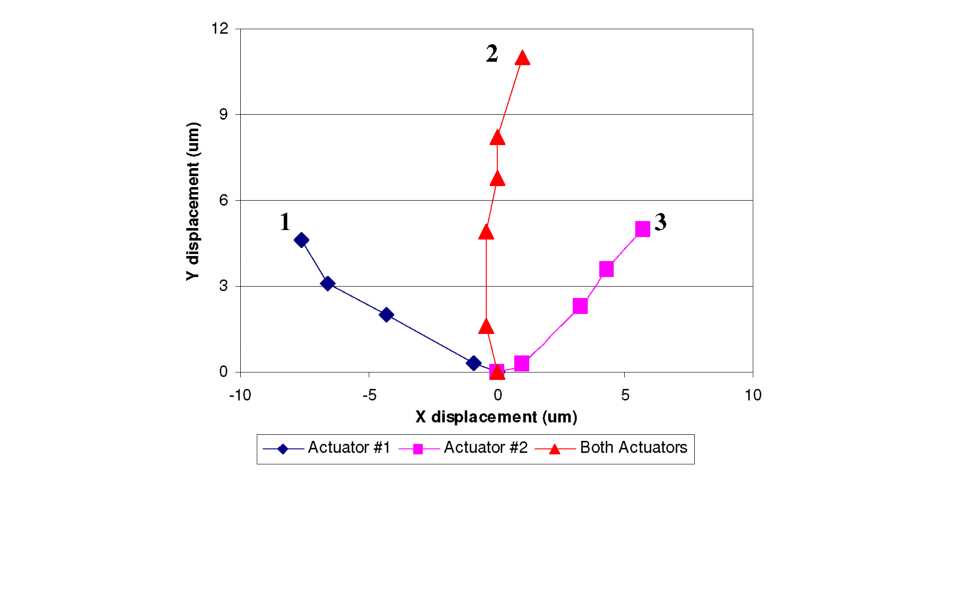 Actuating
each set of wedges independently (while holding the opposite set at
0V) results in points along two trajectories that are tilted with
respect to the X-Y axis (labeled #1 and #3 in the figure). Purely
vertical motion of the fiber is achieved by applying an identical
voltage to each actuator (#2 in the figure). Intermediate voltage
combinations should result in fiber positions within the
diamond-like bounds of these measurements. This test successfully
demonstrates the basic operation of our gray-scale fiber aligner,
where an optical fiber cantilever is deflected in both the
horizontal and vertical directions using coupled in-plane motion of
sloped silicon wedges.
Actuating
each set of wedges independently (while holding the opposite set at
0V) results in points along two trajectories that are tilted with
respect to the X-Y axis (labeled #1 and #3 in the figure). Purely
vertical motion of the fiber is achieved by applying an identical
voltage to each actuator (#2 in the figure). Intermediate voltage
combinations should result in fiber positions within the
diamond-like bounds of these measurements. This test successfully
demonstrates the basic operation of our gray-scale fiber aligner,
where an optical fiber cantilever is deflected in both the
horizontal and vertical directions using coupled in-plane motion of
sloped silicon wedges.
cantilever. All structural components of this new device can be fabricated in silicon using gray-scale technology, making it conducive to batch fabrication. This device is attractive for on-chip active alignment of fiber optics to edge-coupled optoelectronic devices.
Analysis of the primary sources of optical coupling loss between two fibers showed that 2-axis alignment is sufficient to eliminate the dominant source of loss (axial misalignment). However, the amount of angular misalignment introduced by bending the fiber cantilever must also be considered. The design and fabrication of the gray-scale alignment wedges showed that ~50 gray levels were able to produce a relatively smooth slope, which should result in nearly continuous fiber actuation (experimental results discussed in the following chapter). Simple actuation and measurement results clearly demonstrated the fundamental operation of the 2-axis gray-scale fiber aligner.
The following chapter will focus on evaluating the performance of gray-scale fiber aligners in an optical coupling setup. Of particular interest will be the fiber actuation range and resolution, as well as hysteresis behavior between the sloped wedges and optical fiber due to friction. Automated alignment algorithms will be developed as part of this evaluation process to demonstrate the flexibility of this device.
CHAPTER 6: GRAY-SCALE FIBER ALIGNER II: Optical Testing and Characterization