

Comb-drive Testing
The simulated static and dynamic behavior of comb-drive actuators incorporating variable height gray-scale features was confirmed by fabricating two comb-drives on a single wafer, where the only difference was either in the comb-finger profile or the suspension height.
Reduced Height Comb-fingers
For the case of reduced height comb-fingers using gray-scale technology, devices had identical suspensions (L=1000p.m, b=10p.m), gap (d=10jum), and number of fingers (N=100). Two comb-drive devices were fabricated, one planar device and one with a gray-scale notch (as shown in Figure 3.13). The deflection of these two devices was then measured under an optical microscope for various DC applied voltages to compare static deflection characteristics. The approximate spring constant for the suspension was extracted from the planar actuator using its measured actuator dimensions in silicon and analytical equations to estimate the force. The measured dimensions of the gaps/finger widths in silicon were also imported into the FEMLAB model to account for fabrication errors. Using the iterative technique described previously in Section 3.3.1, the displacement characteristics were simulated for comparison to experimental results.
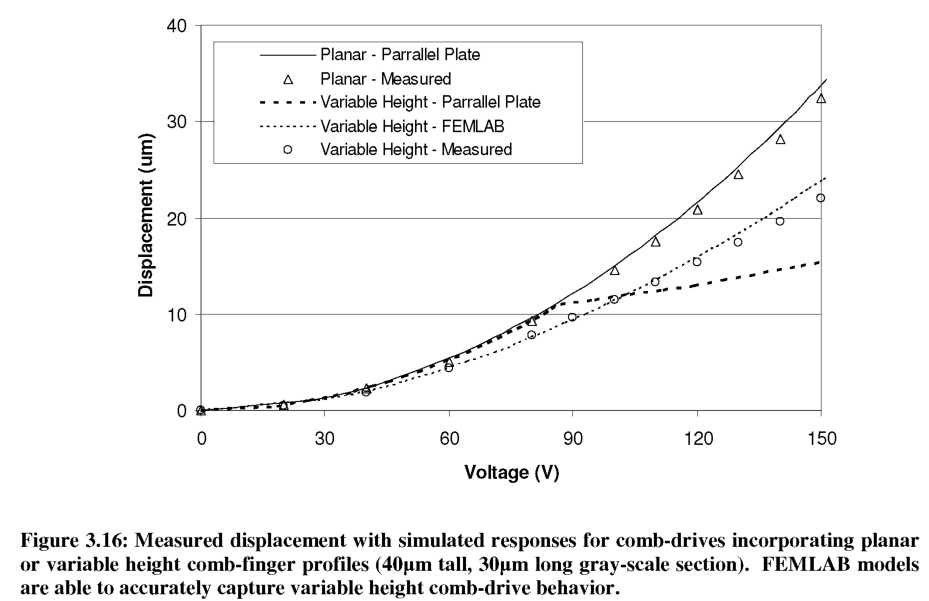
Figure 3.16 shows the measured displacement as a function of applied voltage for each of the two actuator types: planar and variable height (with gray level height of 40pm). The behavior of the planar actuator is accurately predicted using simple parallel plate approximations for the capacitance. For the variable height comb-finger case, we see that the parallel plate model first over-estimates, then under-estimates the actual displacement. However, the FEMLAB capacitance model along with the iterative
displacement calculation method was able to account for fringing fields and accurately predict the displacement behavior of the variable height device.
Reduced Height Suspensions
A second set of comb-drive actuators were designed and fabricated with identical
planar comb-finger layouts to investigate the effects of locally reducing the height of the suspension structure. By using gray-scale technology to reduce the suspension height, the spring constant should be reduced proportionally with the height. This modulation comes without effecting the generated comb-drive force, resulting in a net increase in displacement for a given voltage.
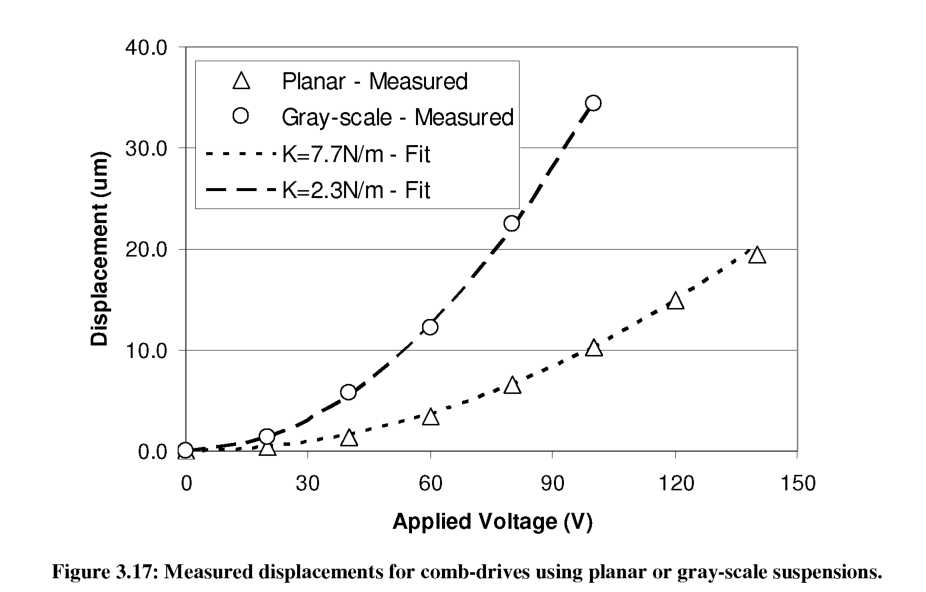
Static displacement measurements were made using DC applied voltages under a microscope for two devices with identical lengths (L=1000p.m) and widths (b=10/um), but different heights: h=100^m (planar) and h~30p.m (variations from gray-scale uniformity). The resulting static displacement measurements are shown in Figure 3.17.
Another consequence of a reduced height suspension design is that the dynamic behavior of the device also changes due to the reduced spring constant in Equation 48. A Veeco Wyko NT1100 Optical Profiler with DMEMS option was used to test the dynamic behavior of comb-drive devices. The Wyko uses stroboscopic white-light interferometry to measure the position of the comb-drive during a frequency sweep at a particular phase. This information was then transformed into an approximate displacement to extract the resonant frequency for each of the two devices discussed above, and the results are shown in Figure 3.18. (Note: more detail regarding the Wyko system will be given in
Chapter 4 which focuses on the dynamic characterization of tunable comb-drive resonators). Ignoring any change in resonator mass caused by reducing the suspension height (as explained earlier), the measured change in resonant peak (f0=1630Hz fo'=910Hz) corresponds well to the prediction made using the reduced spring constant and Equation 48 (f0'=891Hz).
One drawback of reducing the suspension height is that the spring constant in the vertical direction (out of the plane of the wafer) is significantly decreased, leading to difficulty releasing the buried oxide layer with wet etching. This problem could potentially be solved by using dry vapor-etch techniques [137].