- •Introduction
- •Picture 1. International trade in goods of the Russian Federation (the balance of payments methodology) [2]
- •It is worth noting that in 2012, compared with the period 2009-2011, the growth rate of foreign trade reduced significantly.
- •Picture 2. Balance of Trade of the Russian Federation [2]
- •Picture 3. The Structure of the Russian Federation’s export in 2010 [1]
- •Picture 4. The Structure of the Russian Federation’s export in 2011 [1]
- •If the government of the Russian Federation does not take measures to diversify the economy than, having lost its positions in the field of mineral products, the whole country will sink
- •List of references
Picture 2. Balance of Trade of the Russian Federation [2]
The trade surplus of the Russian Federation reached its historical record level of $193247 million in 2011.
According to the forecast of the HSBC-Bank Russian international trade will grow by 6% per year up to 2017, after 2017 – 7.56%. The authors of the forecast believe that the world trade will grow by 86% over the next 15 years and international trade in Russia will increase by 165.54%.
According to HSBC, the Russian foreign trade turnover will be increasing by 5.99% per year during the next 5 years. After that, from 2017 to 2021, the increase rate will be 7.56%. Average annual growth rate of international trade in the next 16 years will be 6.08% [3].
Now let us take a closer look at the structure of the Russia’s import and export.
The main export goods of the Russian Federation:
food and agricultural raw materials (other than textile);
mineral products;
chemicals, rubber;
raw leather, fur and articles thereof;
pulp, paper and wood products;
textiles, textile products and footwear;
metals, gems and articles thereof;
machinery, equipment and vehicles.
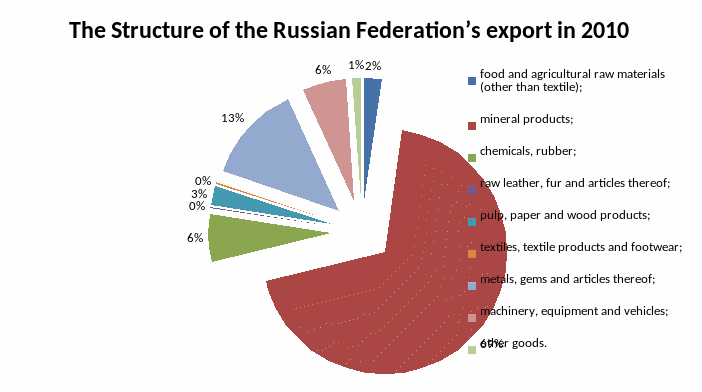
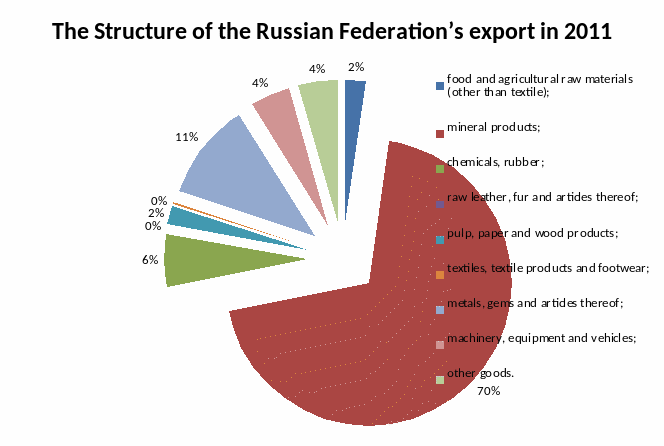
The pictures 3 and 4 represent the structure of Russia’s export. The lion’s share of it is the mineral production which is represented mostly by the fuel oil and petroleum products.

Picture 3. The Structure of the Russian Federation’s export in 2010 [1]
Russia is among the world leader exporters of:
Oil products, natural gas, nitrogen fertilizers, iron, steel semis, nickel, aluminum, round wood – 1st place;
oil, armament, timber, mixed fertilizers, ammonia – 2nd place;
coal, newsprint, synthetic rubber, potash – 3rd place [1].
But despite this Russia still remains a "one-sided" exporter. The total dependence of its foreign trade and economy on the export of the mineral products, in particular oil and gas, is known all over the world. It is thanks to this element of export that Russia has maintained a positive trade balance during since 1992.

Picture 4. The Structure of the Russian Federation’s export in 2011 [1]
The main problem of Russia’s export is the absence of the diversification. Alongside with the stagnation of the manufacturing, the military-industrial complex, the automotive industry and other industries that were highly developed in the Soviet Union, mineral products are the only force that keeps Russia afloat.
Most experts believe that this may not last long.
For example, according to the Federal Customs Service of Russia, at January-February 2013 Russia's gas export rates declined in comparison with the same period in the previous year in value terms by 12.2% - from $13.6 billion to $11.9 - and by 10.2% - in physical terms - of 38.2 billion m3 to 34.3 billion m3. There is every reason to believe that these trends will continue in the industry due to the slowdown of the economic growth of European countries and the rise of the energy efficiency of European countries and their policy to diversify energy sources.
