

Developing the Profit Targets or Entry Points of a Trading Range for the s90/Crossover
T
he S90/Crossover has levels within a trading range that may or may not be associ- ated with Fibonacci levels. As stated in Chapter 3, the S90/Crossover begins with either supports on the bottom side of an uptrend trading range or resistance areason the top side of a downtrend.
EXPLANATION OF LEVELS AND HOW THEY MAY BE INTERPRETED
Although all levels must be considered for targets and reversals, there are certain levels that have more importance than others. For example, in Table 4.1, the levels illustrate the number of S90/Crossovers that occurred during just one New York open. Notice that one level is duplicated on the different time compressions. The level 1.2809, which is highlighted in Table 4.1, is common from the five-minute time compression through the four-hour time compression, but it is not recognized on the daily or weekly chart. This level is a prime level for a reversal, provided that either traditional or modernistic signals are triggered. If signals are triggered toward the levels with proper confirmations, then the 1.2809 level would be interpreted as a possible target. If the market strikes that level and other confirmations are present for a reversal, then that level should generate safety for a bounce-type trade entry.
27
 TABLE
4.1 S90/Crossovers
during
Various
Time
Compressions
in
an
Uptrend
TABLE
4.1 S90/Crossovers
during
Various
Time
Compressions
in
an
Uptrend
5MIN UPTREND
10MIN UPTREND
30MIN UPTREND
60MIN UPTREND
2HR UPTREND
4HR UPTREND
DY UPTREND
WK UPTREND

1.2842 |
1.2834 |
1.2834 |
1.2834 |
1.2809 |
1.2809 |
|
1.2838 |
1.2828 |
1.2828 |
1.2809 |
1.2702 |
1.2702 |
|
1.2828 |
1.2811 |
1.2809 |
|
|||
1.2817 |
1.2809 |
|
||||
1.2811 |
1.2764 |
|
||||
1.2809 |
1.2736 |
|
||||
1.2764 |
1.2872 |
|
||||
1.2759 |
1.2820 |
|
||||
1.2677 |
|
|
||||
1.2672 |
|
|
||||
S90/CROSSOVER LEVELS ARE NOT THE SAME AS A PIVOT POINT
Although the S90/Crossover levels appear to be similar to traditional pivot points, they are not. Pivot points are generally known as levels of possible reversal entry points as well as profit targets. Although pivot points are awesome at times, the problem I have observed is that they are published on the Internet and may give clearing firms and banks the opportunity to herd traders into a position of taking massive stops from smaller traders. This may be considered swimming with the sharks, so to speak. These S90/Crossovers may sometimes, by coincidence, appear at the same level as a pivot point, but they are more consistent for reversals or targets, even during conflicting seasonal market times. Many traditional traders feel that the market is seasonal and therefore a signal that works this season may not work the next season. For example, in July 2006 many pivot traders suffered great losses, while those who understood how to accurately predict S90/Crossovers were able to avoid losses during this same time period.
I have a low opinion of pivot points, because they are published on the Internet where thousands of traders may trade them. It is very likely that traders follow daily pivot publications like sheep to the slaughter. They often have temporary wins, which build confidence, but then suddenly these traders with almost identical protective stops are taken out by the thousands by only one or two pips. It has been said by very famous authors and professional traders that trading with the crowd will ultimately lead to disas- ter, and it often seems that those who trade pivots eventually disappear from the market unless they have great sustaining power. To make profits in the market, you must learn to trade against the crowd. I believe that when the market direction is confirmed by River
Oscillator Indicator (ROI) oscillators, the S90/Crossover will help you trade against the crowd with success.
S-90 CROSSOVERS WITHIN A RANGE
Table 4.1 represents a trading range comprised of supports on the bottom side of an uptrend that is made up of previous historical S90/Crossovers within an approximate
200-pip trading range.
Educational Note: A gap present on an S90/Crossover increases the odds of suc- cess as a profit target and also as a new reversal entry. S90/Crossovers that occur in conjunction with a larger compression trend will also indicate a strong level for rever- sals or targets—provided additional confirmations exist to justify the entry. Also, when one level, as listed in Table 4.1, is found on numerous time compressions, this strength- ens its value within a trading range for a future reversal entry or a profit target if trading toward the duplicated level. It may often become a former historical S90/Crossover level where the level has been revived and duplicated. To reiterate the concept for clarity, this type of market development allows the duplicated level to become a stronger area for profit targets and also possible new reversal entries at the time of the strike.
Table 4.2 illustrates the levels that had appeared only on smaller time compressions, while larger compressions had no agreements in place. Only two time compressions were duplicated on the bear side of the markets. During this period of time, the market was in an overall uptrend, and therefore more S90/Crossovers appeared, as illustrated in Table
4.2. Should the market change direction and develop a new downtrend, then more new S90/Crossovers will gradually develop to match the larger S90/Crossover levels shown in Table 4.2. Currently, no larger compressions have duplicated levels in Table 4.2.
TABLE 4.2
S90/Crossovers during Various Time Compressions in a Downtrend
5MIN DNTREND
10MIN DNTREND
30MIN DNTREND
60MIN DNTREND
2HR DNTREND
4HR DNTREND
DY DNTREND
WK DNTREND


1.2504 |
1.2503 |
1.2472 |
1.2470 |
1.1758 |
1.1932 |
1.2470 |
1.2465 |
1.2464 |
1.2429 |
1.1622 |
1.1552 |
1.2465 |
1.2350 |
1.2282 |
1.1822 |
1.1430 |
0.9378 |
1.2422 |
1.2338 |
1.2125 |
1.1468 |
1.1322 |
|
|
1.2281 |
1.1941 |
1.1322 |
1.0143 |
|
|
|
1.1822 |
1.1112 |
1.1018 |
|
|
|
1.1538 |
|
0.0895 |
|
|
|
1.1528 |
|
0.8916 |
|
|
|
1.1468 |
|
0.8858 |
|

All of the levels shown in Table 4.2 were identified as legal crossovers (LCs) and must be respected as potential reversal levels if additional confirmations exist at the time of level arrivals. Notice the one duplicated level, which is a historical S90/Crossover area, but is also duplicated on other time compressions.
The reason that both uptrend and downtrend crossovers are listed in both Tables 4.1 and 4.2 is because crossovers may occur at the same time in both directions within the trending time compressions. Remember, trends within trends occur at the same time, depending on the time compression size that you’re observing. This sounds like an oxy- moron, so here’s an explanation: The five-minute time compression may show that an immediate downtrend is in progress, while the two-hour time compression has the ap- pearance of an immediate uptrend, and the weekly is in an uptrend or a downtrend. The point is that not all time compressions may agree with each other at the same time re- garding direction. Remember, it takes 2,016 five-minute candlesticks to form just one weekly candlestick. This means that with smaller time compressions, there may be a lot of trend activity with up or down directions going on while larger compressions may not acknowledge the activity of smaller compressions.
Trading ranges seem to change almost daily due to constantly changing mar- ket conditions. In any trading range—whether in 1−, 5−, 10−, or 30+−minute time compressions—the Fibonacci levels found within all trading ranges are known to be measured into infinity. If this is true, then would it not be true that pivot points and Fi- bonacci levels would occur in such massive numbers that you would be confused as to which level is the most important? This is the problem with pivots: Most traders can- not figure out which pivot is telling the truth. If an S90/Crossover just happens to be on the same pivot point, then you have a combination that produces a very strong level for targets or reversals.
When the legal S90/Crossover is combined with confirming signals from a legal gap, a trend wall, Fibonacci clusters, or an overlapping Fibonacci level, it becomes a power- ful reversal point for an entry or a target to trade toward. An explanation of the previ- ously mentioned confirming signals will be explored along with the applications in future chapters.
LEGAL AND ILLEGAL S90/CROSSOVERS
A legal crossover (LC) is a visual confirmation that you must observe to determine if a future profit strike or entry will be valid. These LCs occur every day in different currency combinations, and you should mark those LCs that can be trusted on charts immediately for future reference. Legal crossovers can be trusted in the market, and illegal crossovers cannot be trusted. Often, illegal crossovers are interpreted by many traders who use traditional signals such as pivots as an entry, frequently causing losses. Legal crossovers
usually are not associated with a traditional signal, and if they do appear at approxi- mately the same level, then it is most likely a coincidence.
Many traders never understand the methodology of the S90/Crossover and there- fore, without the help of proper data feed and software that identify ongoing fresh S90/Crossovers, the methodology may be useless. Two companies, Concorde Forex Group, Inc. (CFG) and Forex Producers Group, LLC (FP), now offer software for traders to view the S90/Crossovers that have the most significance for identifying in advance the most probable trading ranges on most currency combinations. When historical S90/Crossovers are bunched together as clusters, they become very powerful target con- firmations as well as exit points in the market. These historical S90/Crossovers are also possible reversal entry points.
The simplest application is to consider the S90/Crossovers on the first two levels as possible targets to trade toward or for reversal entries once the levels have been reached. The key is to have multiple time compression or trend wall clashes for possible market reversals as confirmations before entering the market.
Trend walls that have a clashing point with an S90/Crossover that happens to be relatively close to or exactly lines up with a horizontal extreme level will usually have other indicators also implying a reversal in the market.
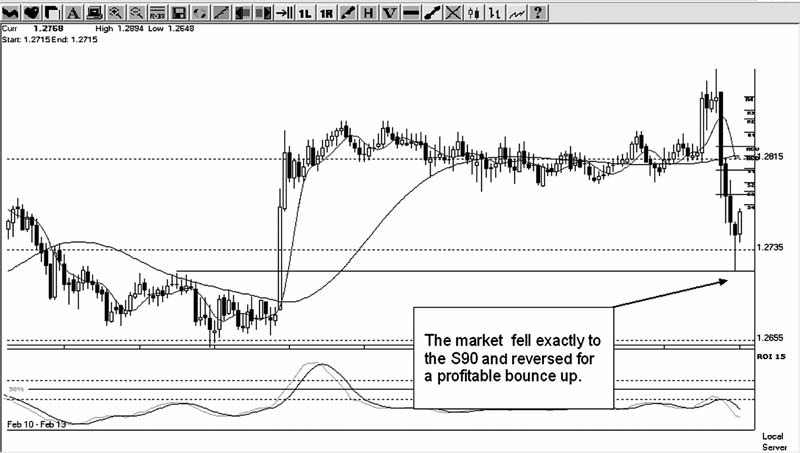
FIGURE 4.1 The S90/Crossover strike at its best. Courtesy of Concorde Forex Group, Inc.
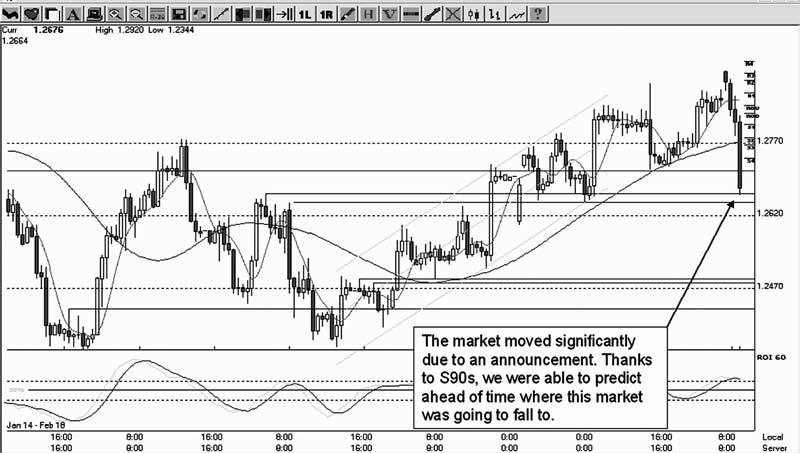
FIGURE 4.2 The S90/Crossover on the four-hour time compression. Courtesy of Concorde Forex Group, Inc.
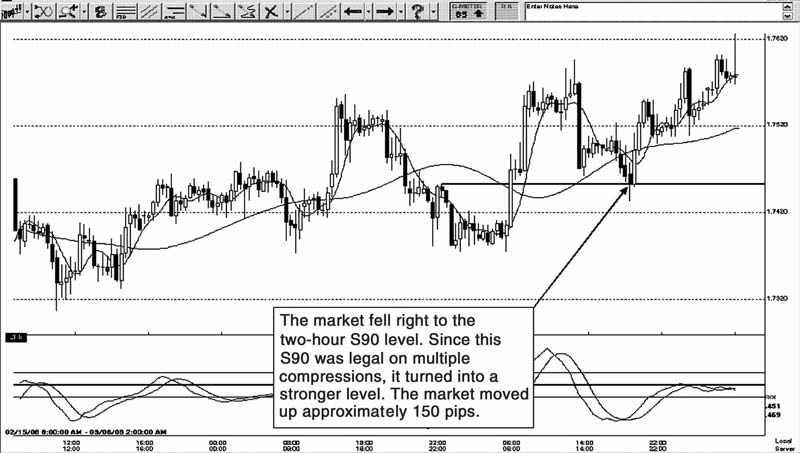
FIGURE 4.3 The S90/Crossover on the two-hour time compression. Courtesy of Concorde Forex Group, Inc.
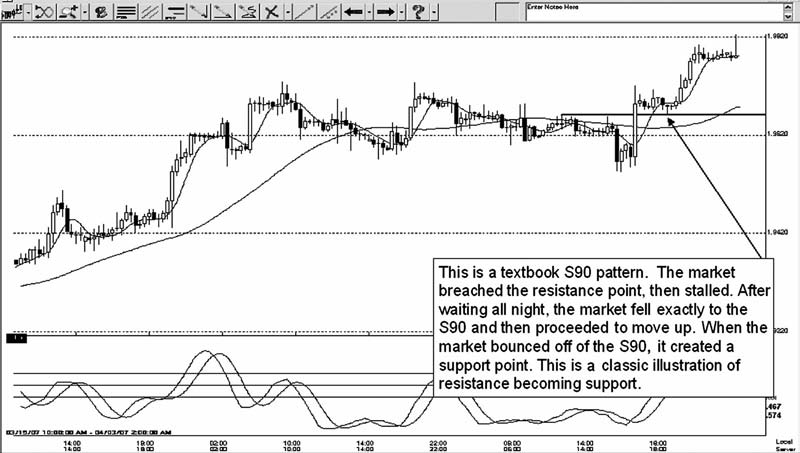
FIGURE 4.4 A textbook S90/Crossover pattern. Courtesy of Concorde Forex Group, Inc.
M I L L I O N - D O L L A R T I P
Multiple reasons to enter the market decrease your odds of a loss occurring. Hunches that the market will reverse for an entry increase your odds of a loss occurring.
Figure 4.1 shows the S90/Crossover strike at its best.
Figure 4.2 shows the S90/Crossover on the four-hour time compression, while
Figure 4.3 shows the S90/Crossover on the two-hour time compression.
Finally, Figure 4.4 shows a textbook S90/Crossover pattern.


C H A P T E R 5