

2. A) In small groups discuss criteria for a successful presentation and design a form of an evaluation sheet.
b) Share your ideas with other groups and make one common sheet that will be used during the presentations.
3. Listen and see some presentations. Using the evaluation sheet choose the most successful presentation. Be ready to prove your opinion. Describing trends
1. Have you dealt with graphics? Working in pairs, discuss the functions of graphics and their advantages in comparison with a text. Share your ideas with other students. (See appendix 4 for detailed information)


functions advantages
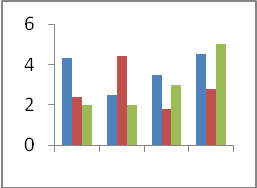
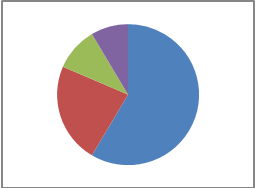
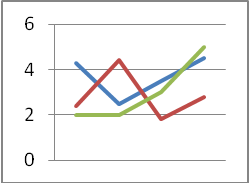
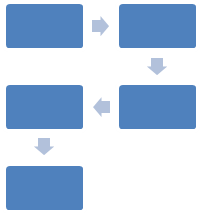
2. A) Match the picture with the type of a diagram.
flow chart line graph bar chart diagram pie chart

Match the chart(s) and the purpose of its use:
1. to show hierarchy
2. to show trends (changes over the period of time)
3. to show causes and results
4. to show the situation at one point in time
b) What type of graph would you use to present the following? Explain your choice.
the number of female and male students in the groups of your course
the annual number of road fatalities (the road toll) in your province or territory over the last 5 years
the level of inflation in Russia over the last 10 years
the total population of Russia, the provinces and territories
3. A) What kind of movement do the verbs below describe? Match them to the symbols. Then compare your answers with a partner. (Use some symbols more than once.)
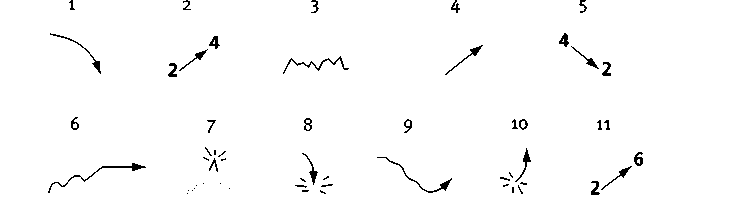
decline decrease dip double |
drop fall fluctuate halve |
improve increase increase tenfold level off |
peak plummet recover reduce
|
remain stable rise rocket stabilize triple |
b) Which of the above verbs also have noun forms? What are they?
for example, to increase - an increase.
4. Divide the adjectives into three groups.
constant sharp slight significant |
gradual noticeable sudden static |
steady dramatic considerable remarkable |
stable substantial slow rapid |
great change: |
small change: |
regular movement: |