

8. A) Usually business presentations contain a lot of numbers. Look at the numbers bellow. What categories do they belong to? Try to pronounce them.
24.10.2001 22.11.1996 1.3.1960 27.2.2010 5.5.2005 12.9.1867 |
7.05 3.45 4.15 9.35 12.30 3.55 |
$100 $501 $6,097 $ 10,045 1,000 yen $1,000,000 |
0.25 5.7 8.76 34.98 0.45 0.32 |
1/4 1/6 7/8 1/10 1/2 3/4 |
65% 21% 36% 100% 74% 18% |
b) Work in pairs. Look at your card and dictate the given numbers to your partner. Check each other.
Card A
$100,000 29.12.2004 |
11.20 p.m. 0.46 |
5/6 7.86 |
7.9 % 17.6.1948 |
Card B
15.8.2007 65.7 |
$99 0.56 |
19.9.1960 2.30 p.m |
2.43% 7/8 |
9. Complete the following sentences with the appropriate preposition(s). By to in at from of
a) Last year our sales were $5 million. This year our sales are $7 million.
1. Sales have increased ______ $5m ______ $7m.
2. Sales have increased ______ $2m.
3. There has been an increase ______ $2m in our sales.
4. Sales now stand ______ $7million.
5. Sales reached a peak _____ $7 million in July.
6. Sales reached a low point _____ $1 million in April.
b) 1. ____ 1992 ___ 1993 car registrations decreased ____ 13.5 million ____ 11.2 million.
2. Car registrations increased _____ 11.2 million ____ 1993 ____ 11.9 million ____ 1994.
3. Car registrations decreased _____ about 300,000, that is ____ a million _____ 700,000, ____ 1991 ____ 1997.
4. There was a decrease ____ about half a million ____ 1991 ____ 1996.
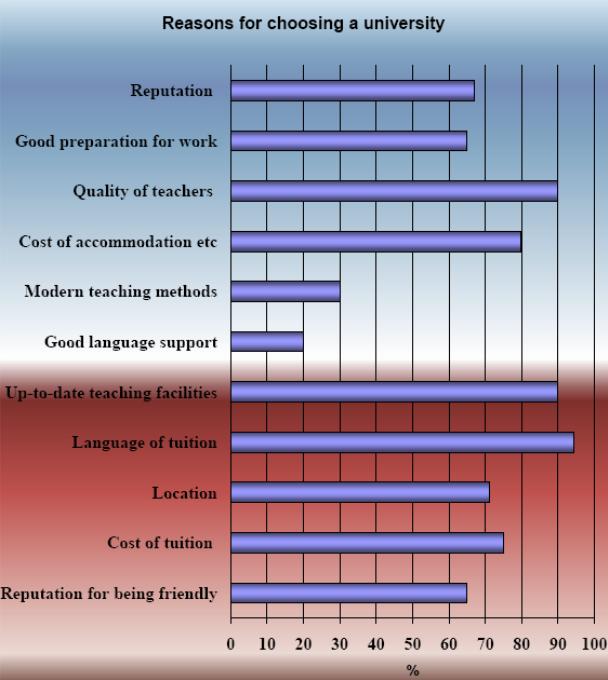
10. Study the chart below and add the phrases a-o in the appropriate spaces in the sentences 1-15, which follow.
List of phrases
A only 30 percent selected B reason behind students choosing C as opposed to 75 percent D can be divided E was carried out F was five percent more than G more students quoted H is given as
|
I is J with approximately K compared with modern teaching methods L at 95%, 90% and 90% respectively M reasons why N which influences students O bottom
|
1 The chart shows 11 __________ first year students from overseas chose a particular university.
2 Good language support comes __________ at 20 percent.
3 Language of tuition is top of the survey __________ 95%.
4 At 95 percent of the sample, Language of tuition is the main __________ a university.
5 The survey of 1,000 first year overseas students __________ at universities in the UK.
6 Good language support at 20% is the factor __________ least when making a choice about which university to attend.
7 Language of tuition __________ a reason by nearly five times as many students as Good language support, at 95% and 20% respectively.
8 The top three reasons are Language of tuition, Quality of teachers, Up-to-date teaching facilities, __________.
9 According to the graph, the main reason __________ the language of tuition.
10 The various factors __________ into two groups, namely those related to teaching and nonteaching related.
11 While around 95 percent of the students gave the language of tuition as the main reason for choosing a university, __________ modern teaching methods.
12 The cost of accommodation at 80 percent __________ the cost of tuition at around 75 percent.
13 Eighty percent of the sample mentioned the cost of accommodation as a reason for choosing a university __________ for the cost of tuition.
14 __________ the cost of accommodation and the cost of tuition than Location at 80% and 75% respectively.
15 Good language support was stated by only 20 percent of the sample as a reason for choosing a university __________ at 30 percent.
11. Describing graphs you needn’t always give exact numbers, you can make approximations. For example, if real sales figures for oranges rose from 4000 kilos to 7850 kilos, you can say that orange sales almost doubled.
Here are some useful words and phrases for making approximations. Match phrases with the same meaning.
1 just over a around
2 approximately b nearly
3 just under c slightly more than
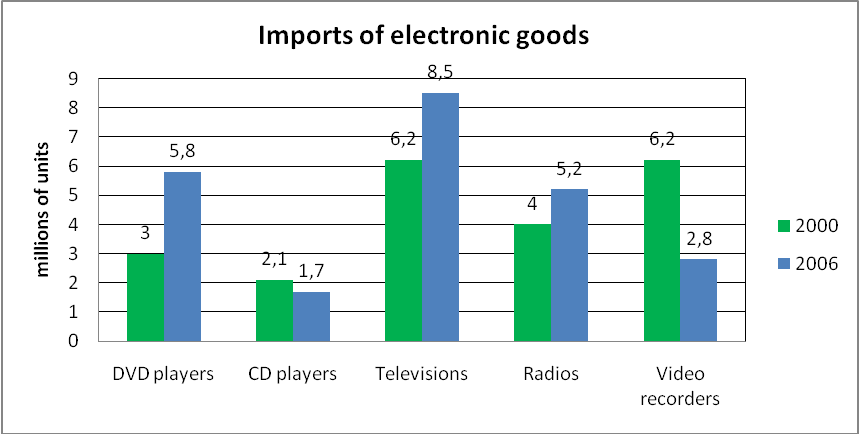
b) Now write sentences about the chart below, which shows changes in the quantities of imports of certain electronic goods. Use the words in the boxes.
a quarter a third doubled fell by halved rose by tripled |
|
just over approximately just under around nearly slightly more than |
1 (DVD players) _______________________________________________
2 (CD players) _______________________________________________
3 (Televisions) ________________________________________________
4 (Radios) ________________________________________________
5 (Video recorders) ______________________________________________
READING