

Internal Secondary Data
Data that have already been collected and exist inside the business firm or other organization are internal secondary data. These include product sales data and sales reports on customer calls.
External Secondary Data
Published data from outside the organization are external secondary data. The U.S. Census Bureau publishes a variety of useful reports. Best known is the Census 2000, which is a decennial count of the U.S. population containing detailed information on American households, such as the number of people per household and their age, sex, race/ethnic background, income, occupation, and education. Marketers use these data to identify characteristics and trends of ultimate consumers.
The Census Bureau also publishes other reports that are vital to business firms selling products and services to organizations. The Economic Census, which now encompasses the former U.S. Census of Manufacturers, U.S. Census of Retail Trade, and others, is conducted every five years. The 2002 Economic Census contains data on the number and size of establishments in the United States that produce a good or service on the basis of its North American Industry Classification (NAICS) and the new North American Product Classification System (NAPCS). The Current Industrial Reports are periodic studies that provide data on the production quantity and shipment value of selected products. Finally, trade associations, universities, and business periodicals provide detailed data of value to market researchers and planners. These data are now available online via the Internet, which can be identified and located using a search engine like Google. The Web Link provides examples.
WEB LINK
WEB LINK |
Online Databases and Internet Resources Useful for Marketers Information contained in online databases available via the Internet consists of indexes to articles in periodicals and statistical or financial data on markets, products, and organizations that are accessed either directly or via Internet search engines or portals through key word searches. Online databases of indexes, abstracts, and full-text information from periodicals include:
Statistical and financial data on markets, products, and organizations include:
Portals and search engines include:
Some of these websites are accessible only if your educational institution has paid a subscription fee. To see if you can access these sites for free, check with your institution’s website. |
A variety of marketing research organizations serves the needs of marketers. Specialized syndicated services provide a standard set of data on a regular basis, such as the Nielsen Media Research’s TV ratings or J. D. Powers with its automotive quality and customer satisfaction research. Other market research suppliers contract with clients to conduct complete marketing research projects.
Several data services provide comprehensive information on household demographics and lifestyle, product purchases, TV viewing behavior, and responses to coupon and free-sample promotions. Their principal advantage is the ability of one service to collect, analyze, interrelate, and present all this information. For consumer product firms like Procter & Gamble, sales data from various channels are critical to allocate scarce marketing resources. As a result, they use firms such as Information Resources’ Info-Scan and AC Nielsen’s ScanTrack to collect product sales and coupon/free-sample redemptions that have been scanned at the checkout counters of supermarket, drug, convenience, and mass merchandise retailers in the United States and other international markets. Campbell Soup, maker of Swanson frozen dinners, used the information from one of these single-source data providers to shift a TV ad campaign from a serious to a light theme, which increased sales of Swanson dinners by 14 percent.
Advantage and Disadvantages of Secondary Data
A general rule among marketing people is to obtain secondary data first and then collect primary data. Two important advantages of secondary data are (1) the tremendous time savings if the data have already been collected and published and (2) the low cost, such as free or inexpensive Census reports. Furthermore, a greater level of detail is often available through secondary data, especially U.S. Census Bureau data.
However, these advantages must be weighed against some significant disadvantages. First, the secondary data may be out of date, especially if they are U.S. Census data collected only every 5 or 10 years. Second, the definitions or categories might not be quite right for your project. For example, the age groupings might be wrong for your project. Finally, because the data are collected for another purpose, they may not be specific enough for your project. In such cases it may be
necessary to collect primary data.
-
Concept check
What is the difference between secondary and primary data?
What are some advantages and disadvantages of secondary data?
Primary Data
The two principal ways to collect new or primary data for a marketing study are by (1) observing people and (2) asking them questions.
Observational Data
Facts and figures obtained by watching, either mechanically or in person, how people actually behave is the way marketing researchers collect observational data. National TV ratings, such as those of Nielsen Media Research shown in Figure 4, are an example of mechanical observational data collected by a “people meter.” The people meter is a box that (1) is attached to TV sets, VCRs, cable boxes, and satellite dishes in over 6,000 homes across the country; (2) has a remote that operates the meter when a viewer begins and finishes watching a TV program; and (3) stores and then transmits the viewing information each night to Nielsen Media Research. Also, Nielsen Media Research employs a much larger sample of households in 210 TV markets in the United States to record their viewing behavior in TV diaries or booklets (not a mechanical but a manual measurement system) during the months of February, May, July, and November, which are known as “the sweeps.” On the basis of all this observational data, Nielsen Media Research then calculates the “rating” and “share” of each TV program. With 109.6 million TV households in the United States based on the 2000 U.S. Census, a single ratings point equals 1 percent, or 1,096,000 TV households. In TV viewing a share point is the percentage of TV sets in use tuned to a particular program. Because TV networks and cable sell more than $32 billion annually in advertising and set advertising rates to advertisers on the basis of those data, precision in the Nielsen data is critical. Thus, a change of one percentage point in a rating can mean gaining or losing up to $50 million in advertising revenue because advertisers pay rates on the basis of the size of the audience for a TV program.
FIGURE 4
Nielsen ratings of the top 10 national television programs
from September 27, 2004, through October 3, 2004
RANK |
PROGRAM |
NETWORK |
RATING |
SHARE |
1 |
Desperate Housewives |
ABC |
13.6 |
20.0 |
2 |
CSI: Miami |
CBS |
13.0 |
21.0 |
3 |
NFL Monday Night Football |
ABC |
13.0 |
22.0 |
4 |
CSI: NY |
CBS |
12.5 |
20.0 |
5 |
Everybody Loves Raymond |
CBS |
12.1 |
18.0 |
6 |
Survivor: Vanuatu |
CBS |
11.5 |
18.0 |
7 |
Two and a Half Men |
CBS |
10.9 |
16.0 |
8 |
CSI Special(s) |
CBS |
10.8 |
170 |
9 |
Lost |
ABC |
10.5 |
17.0 |
10 |
60 Minutes |
CBS |
10.2 |
17.0 |
So from Figure 4, we might expect to pay more for a 30-second TV ad on CSI: Miami than one on Survivor: Vanuatu. Broadcast and cable networks may change the time slot or even cancel a TV program if its ratings are consistently poor and advertisers are unwilling to pay a rate based on a higher guaranteed rating.
The people meter’s limitations - as with all observational data collected mechanically (or manually) - relate to how the measurements are taken. In 2003, Nielsen reported a 7 to 12 percent annual decline from 2002 in the prime-time TV watched by men from 18 to 34. This has caused chaos among networks and advertisers alike because of the size of this market segment. This is the very group most likely to watch TV at sports bars, on the treadmill at their athletic club, or on DVDs, or skip regular TV entirely to play videogames or surf the Web. Because of pressure to get more accurate viewing data, Nielsen is putting more technology into its people meter and increasing the sample of homes from 6,000 to 10,000 by 2006. In 2004, Nielsen also started collecting data from users of TiVo’s increasingly popular digital video recorders that allow viewers to pause live TV programming and to fast forward through commercials. This enables Nielsen to tell not only which TV commercials viewers skip but also whether they skip only 10 or 20 seconds into the commercial.
Nielsen//NetRatings also uses an electronic meter to record Internet user behavior. These data are collected by tracking the actual mouse clicks made by users from more than 100,000 individuals in 13 countries as they surf the Internet via a meter installed on their home or work computers. Nielsen//NetRatings identifies the top websites that have the largest unique audiences, the top advertising banners viewed, the top Internet advertisers, and global Internet usage for selected European and Asian countries. Figure 5, showing the top 10 Internet websites, gives interesting comparisons about Internet usage. For example, while eBay reaches about one-fourth fewer users than Google in a month, the typical eBay user spends more than three times the minutes per month than a Google user.
FIGURE 5
Nielsen//NetRatings of the top l 0 Internet websites for September, 2004
RANK |
PROPERTY |
UNIQUE AUDIENCE (OOOs) |
REACH % |
HOURS AND MINUTES PER PERSON PER WEEK |
1 |
Yahoo |
88,732 |
60.73 |
2:47 |
2 |
MSN |
88,630 |
60.66 |
1:39 |
3 |
Microsoft |
84,581 |
57.88 |
0:40 |
4 |
AOL |
70,487 |
48.24 |
6:48 |
5 |
61,897 |
42.36 |
0:29 |
|
6 |
eBay |
45,386 |
31.06 |
1:45 |
7 |
MapQuest |
31,142 |
21.31 |
0:12 |
8 |
Amazon |
29,868 |
20.44 |
0:19 |
9 |
Weather Channel |
29,730 |
20.35 |
0:21 |
10 |
Real |
29,428 |
20.14 |
0:38 |
Observational data can take some strange twists. Jennifer Voitle, a laid-off investment bank employee with four advanced degrees, responded to an Internet ad and found a new career: mystery shopper. Companies pay her to check on the quality of their products and services and write a detailed report on what she finds. She gets paid to travel to Mexican and Hawaiian hotels, eat at restaurants, play golf, test-drive new cars at auto dealerships, shop for groceries and clothes, and play arcade games. But her role posing as a customer gives her client unique marketing research information that can be obtained in no other way. Says Jennifer, “Can you believe they call this work?”
Watching consumers in person and videotaping them are other observational approaches. For example, Aurora Foods observes how consumers bake cakes in its
test kitchens to see if baking instructions on the cake box are understood and followed correctly. Gillette marketing researchers actually videotaped consumers brushing their teeth in their own bathrooms to see how they really brush - not just how they say they brush. The new-product result: Gillette’s new Oral-В CrossAction toothbrush that’s supposed to do a better job, at $4.99 each.
A specialized observational approach is ethnographic research, in which anthropologists and other trained observers seek to discover subtle emotional reactions as consumers encounter products in their “natural use environment,” such as in their home, car, or hotel. For example, Best Western International, Inc., a national hotel chain, paid couples to videotape themselves as they spent three to seven days on a cross-country car trip. From this, Best Western found that women usually decide when to pull off the road and where to stay - the reverse of focus group research. The result: target more promotional messages to women.
Personal observation is both useful and flexible, but it can be costly and unreliable when different observers report different conclusions in watching the same event. Also, although observation can reveal what people do, it cannot easily determine why they do it, such as why they are buying or not buying a product. This is the principal reason for using questionnaires.
Questionnaire Data
Questionnaire data are facts and figures obtained by asking people about their attitudes, awareness, intentions, and behaviors. Because so many questions might be asked in questionnaires, it is essential that the researcher concentrate on those directly related to the marketing problem being studied and potential marketing actions that might result.
General Mills did exploratory research to search for ideas about why Hamburger Helper didn’t fare too well with consumers when introduced. Initial instructions called for cooking a half pound of hamburger separately from the noodles or potatoes, which were later mixed with the hamburger. Individual interviews (a single researcher asking questions of one respondent) showed that consumers (1) didn’t think it contained enough meat and (2) didn’t want the hassle of cooking in two different pots. So the Hamburger Helper product manager changed the recipe to call for a full pound of meat and to allow users to prepare it in one dish; this converted a potential failure into a success.
Focus groups are informal sessions of 6 to 10 past, present, or prospective customers in which a discussion leader, or moderator, asks their opinions about the firm’s and its competitors’ products, how they use these products, and special needs they have that these products don’t address. Often video-recorded and conducted in special interviewing rooms with a one-way mirror, these groups enable marketing researchers and managers to hear and watch consumer reactions. The informality and peer support in an effective focus group uncover ideas that are often difficult to obtain with individual interviews.
In the mid-1990s, 3M sought ways to push further into the home-care business and decided to target the wool soap pads niche, which was dominated by giants SOS and Brillo. 3M ran eight focus groups around the United States and heard consumers complain that standard wool pads scratched their expensive cookware. These interviews led to 3M’s internationally successful Scotch-Brite® Never Scratch wool soap pad.
Finding “the next big thing” for consumers has become the obsession not only for consumer product firms but also for firms in many other industries. The result is that marketing researchers have come to rely on techniques that are far more basic— many would say bizarre - than more traditional individual or focus group interviews. These “fuzzy front end” methods attempt to identify elusive consumer tastes or trends far before typical consumers have recognized them themselves. Three examples of unusual ways to collect consumer data and their results include the following:
Having consumers take a photo of themselves every time they snack. This resulted in General Mills’ Homestyle Pop Secret popcorn, which delivers the real butter and bursts of salt in microwave popcorn that consumers thought they could only get from the stovetop variety.
Having teenagers complete a drawing. This is used by researchers at Teenage Research Unlimited (TRU) to help discover what teenagers like, wear, listen to, read, and watch. TRU surveys 2,000 teens twice a year to identify their lifestyles, attitudes, trends, and behaviors. With its Coolest Brand Meter™, TRU asks teens to specify the coolest brands within specific product categories, such as sneakers and clothing.
Hiring “cool hunters,” people with tastes far ahead of the curve. This is used to identify the next big things likely to sweep popular teen culture. Many marketers consult Look-Look, a marketing research firm that can call on up to 20,000 “field correspondents” who specialize in hunting for “trendsetters” for ideas, products, and fashions that are deemed to be “cool” in large cities around the world. Look-Look provides these field correspondents with digital cameras to send back uploaded images from parties, concerts, and sporting events. For example, Wet Seal uses this method to anticipate teenage girls’ fashions while Skechers uses it to spot footwear trends.
More conventional questionnaire studies use personal, mail, telephone, e-mail, fax, or Internet surveys of a large sample of past, present, or prospective consumers. In choosing between these alternatives, the marketing researcher must balance cost against the expected quality of information obtained. Personal interview surveys have a major advantage of enabling the interviewer to be flexible in asking probing questions or getting reactions to visual materials, but are very costly to conduct. Mail surveys are usually biased because those most likely to respond have had especially positive or negative experiences with the product or brand. While telephone interviews allow flexibility, they are increasingly difficult to complete because respondents may hang up on the interviewer. E-mail, fax, and Internet surveys are restricted to respondents having the technologies but are expanding rapidly.
The high cost of reaching respondents in their homes using personal interviews has led to a dramatic increase in the use of mall intercept interviews, which are personal interviews of consumers while on visits to shopping centers. These face-to-face interviews reduce the cost of personal visits to consumers in their homes while providing the flexibility to show respondents visual cues such as ads or actual product samples. However, a critical disadvantage of mall intercept interviews is that the people selected for the interviews may not be representative of the consumers targeted for the interviews, giving a biased result.
Figure 6 shows typical problems to guard against in wording questions to obtain meaningful answers from respondents. For example, in a question of whether you eat at fast-food restaurants regularly, the word regularly is ambiguous. Two people might answer “yes” to the question, but one might mean “once a day” while the other means “once or twice a month.” Both answers appear as “yes” to the researcher who tabulates them, but they suggest that dramatically different marketing actions be directed to each of these two prospective consumers. Therefore, it is essential that marketing research questions be worded precisely so that all respondents interpret the same question similarly.
FIGURE 6
Typical problems in wording questions
Problem |
Sample question |
Explanation of problem |
Leading question
|
Why do you like Wendy’s fresh meat hamburgers better than those of competitors? |
Consumer is led to make statement favoring Wendy’s hamburgers |
Ambiguous question |
Do you eat at fast-food restaurants regularly?
|
What is meant by word regularly - once a day, once a month, or what? |
Unanswerable question |
What was the occasion for eating your first hamburger?
|
Who can remember the answer? Does it matter? |
Two questions in one
|
Do you eat Wendy’s hamburgers and chili?
|
How do you answer if you eat Wendy’s hamburgers but not chili? |
Nonexhaustive question |
Where do you live?
|
What do you check if you live in an apartment? |
Nonmutually exclusive answers |
What is your age?
|
What answer does a 40-year-old check?
|
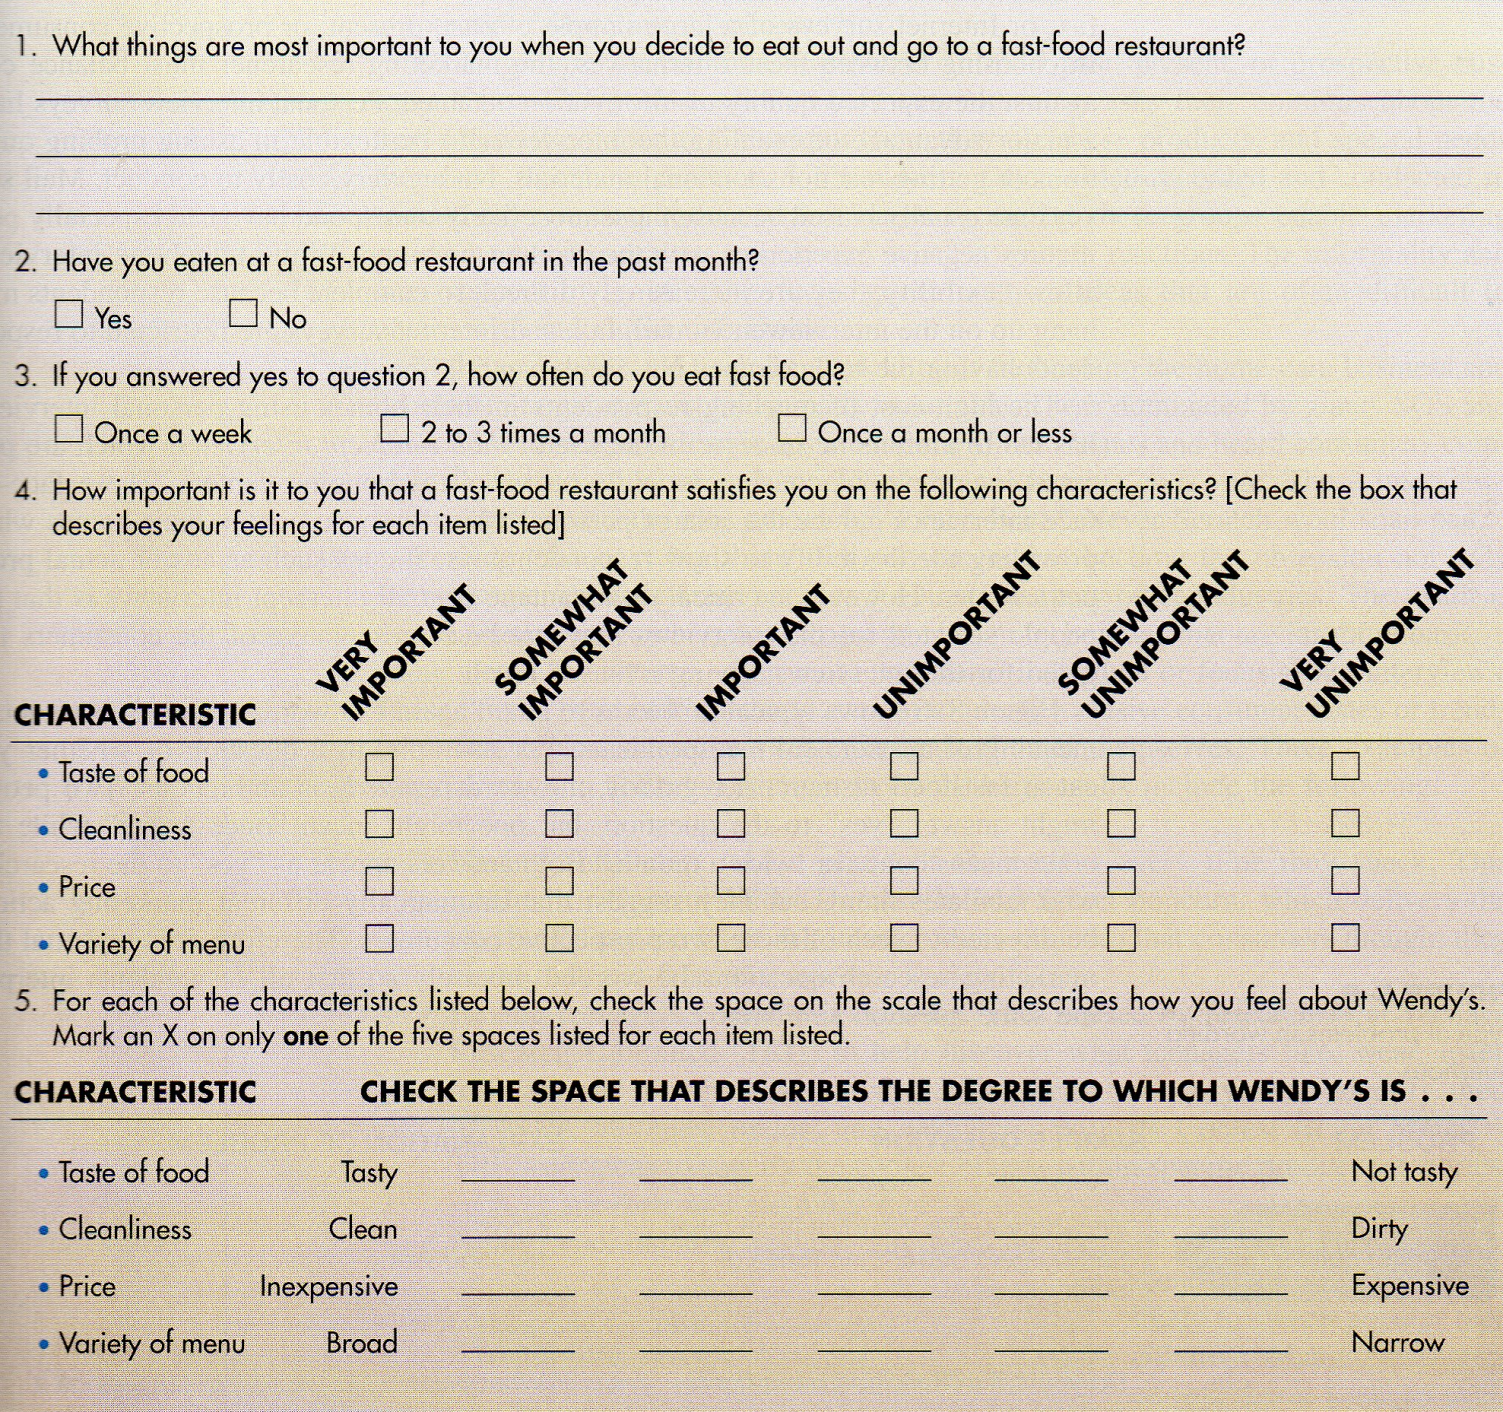
Figure 7 shows a number of different formats for questions taken from a Wendy’s survey that assessed fast-food restaurant preferences among present and prospective consumers. Question 1 is an example of an open-ended question, which allows respondents to express opinions, ideas, or behaviors in their own words without being forced to choose among alternatives that have been predetermined by a marketing researcher. This information is invaluable to marketers because it captures the “voice” of respondents, which is useful in understanding consumer behavior, identifying product benefits, or developing advertising messages. In contrast, closed-end or fixed alternative questions require respondents to select one or more response options from a set of predetermined choices. Question 2 is an example of a dichotomous question, the simplest form of a fixed alternative question that allows only a “yes” or “no” response.
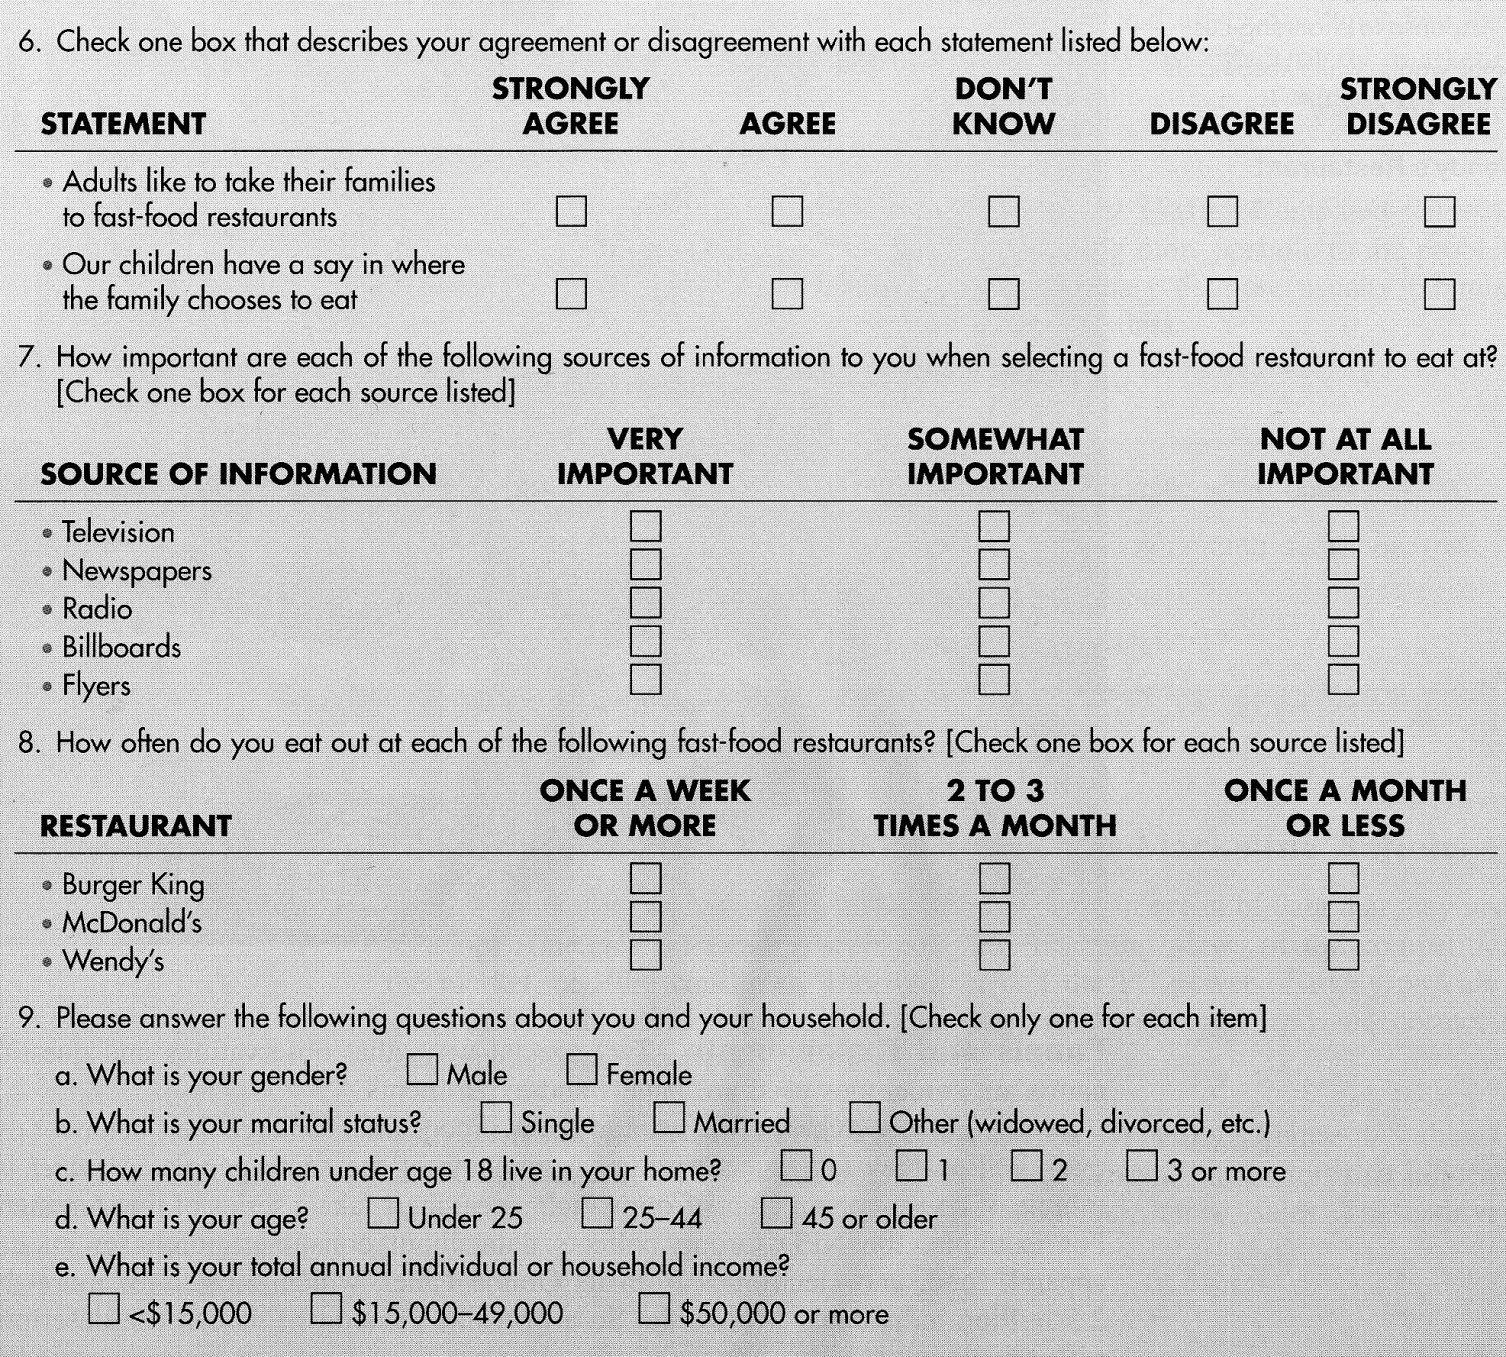
A fixed alternative question with three or more choices uses a scale. Question 5 is an example of a question that uses a semantic differential scale, a five-point scale in which the opposite ends have one- or two-word adjectives that have opposite meanings. For example, depending on how clean the respondent feels that Wendy’s is, he or she would check the left-hand space on the scale, the right-hand space, or one of the five intervening points. Question 6 uses a Likert scale, in which the respondent indicates the extent to which he or she agrees or disagrees with a statement.
The questionnaire in Figure 7 is an excerpt of a precisely worded survey that provides valuable information to the marketing researcher at Wendy’s. Questions 1 to 8 inform him or her about the likes and dislikes in eating out, frequency of eating out at fast-food restaurants generally and at Wendy's specifically, and sources of information used in making decisions about fast-food restaurants. Question 9 gives details about the personal or household characteristics, which can be used in trying to segment the fast-food market.
FIGURE 7
Sample questions from Wendy’s survey
Electronic technology has revolutionized traditional concepts of interviews or surveys. Today, respondents can walk up to a kiosk in a shopping center, read questions off a screen, and key their answers into a computer on a touch screen. Even fully automated telephone interviews exist: An automated voice questions respondents over the telephone, who then key their replies on a touch-tone telephone.
FIGURE 7
(continued)
Sample questions from Wendy’s survey
Panels and Experiments
Two special ways that observations and questionnaires are sometimes used are panels and experiments.
Marketing researchers often want to know if consumers change their behavior over time, and so they take successive measurements of the same people. A panel is a sample of consumers or stores from which researchers take a series of measurements. For example, the NPD Group collects data about consumer purchases such as apparel, food, and electronics from its Online Panel, which consists of more than 2.5 million individuals worldwide. So a firm like General Mills can use descriptive research - counting the frequency of consumer purchases - to measure switching behavior from one brand of its breakfast cereal (Wheaties) to another (Cheerios) or to a competitor’s (Kellogg’s Special K). A disadvantage of panels is that the marketing research firm needs to recruit new members continually to replace those who drop out. These new recruits must match the characteristics of those they replace to keep the panel representative of the marketplace.
An experiment involves obtaining data by manipulating factors under tightly controlled conditions to test cause and effect, an example of causal research. The interest is in whether changing one of the independent variables (a cause) will change the behavior of the dependent variable that is studied (the result). In marketing experiments, the independent variables of interest - sometimes called the marketing drivers - are often one or more of the marketing mix elements, such as a product’s features, price, or promotion (like advertising messages or coupons). The ideal dependent variable usually is a change in purchases (incremental unit or dollar sales) of individuals, households, or organizations. For example, food companies often use test markets, which is offering a product for sale on a limited basis in a defined area to help decide the likely effectiveness of potential marketing actions. So a test market is really a kind of marketing experiment to reduce risks. In 1988, Wal-Mart opened three experimental stand-alone supercenters to gauge consumer acceptance before deciding to open others. Today, Wal-Mart operates over 1,000 supercenters nationwide.
A potential difficulty with experiments is that outside factors (such as actions of competitors) can distort the results of an experiment and affect the dependent variable (such as sales). A researcher’s task is to identify the effect of the marketing variable of interest on the dependent variable when the effects of outside factors in an experiment might hide it.
Advantages and Disadvantages of Primary Data
Compared with secondary data, primary data have the advantage of being more specific to the problem being studied. The main disadvantages are that primary data are usually far more costly and time consuming to collect than secondary data.
-
Concept check
What is the difference between observational and questionnaire data?
Which survey provides the greatest flexibility for asking probing questions: mail, telephone, or personal interview?
What is the difference between a panel and an experiment?