- •Cfa Society of Russia
- •Appendix d - comparable companies
- •Appendix e – ftse value stock screening criteria
- •Appendix f - macroeconomic assumptions
- •Appendix h – main suppliers
- •Appendix I – customers
- •Appendix j – mostotrest’s acquisitions
- •In cfd mst operates through:
- •5 Branches and 1 factory in Moscow and Moscow region;
- •Appendix n – projects completed by mostotrest in 2009-2012
- •Appendix o – mostotrest’s current projects (1/2)
- •Appendix o – mostotrest’s current projects (2/2)
- •Appendix p - board of directors structure
- •Appendix r - сompliance with the requirements of the exchanges listing rules to corporate governance (2/3)
- •Appendix t – swot analysis
- •The likelihood of new entry
- •The costs of entry are high
- •Firms who have experience and reputation in the industry have major advantages
- •The major client in the industry is the government, consequently, the loyalty to the existing companies is very high
- •Rivalry determinants
- •There are a few companies that have major share of the market
- •The existing firms will fight hard in order to survive because they cannot easily transfer their resources elsewhere
- •There is a big brand loyalty, as well as the good political relations of the owners of the company
- •Competitive rivalry within an Industry
- •In fact there are many companies with which Mostotrest successfully cooperates.

CFA Institute Research Challenge
hosted by
Cfa Society of Russia
A-Team/ Lomonosov Moscow State University
|
A-TEAM 2 |
|||||||||||||||||||||||||||||||||||||||||||||||||||||||||||||||||||||||||||||||||||||||||||||||||||||||||||||||||||||||||||||||||||||||||||||||||||||||||||||||||||||||||||||||||||||||||||
BUY Current Price (28 January 2013) RUB193 Price Target (12-mth) RUB264 Upside/downside potential 45% |
CFA Institute Research Challenge
Mostotrest This report is published for education purposes only by students competing in the CFA Institute Research Challenge |
|||||||||||||||||||||||||||||||||||||||||||||||||||||||||||||||||||||||||||||||||||||||||||||||||||||||||||||||||||||||||||||||||||||||||||||||||||||||||||||||||||||||||||||||||||||||||||
Company Data
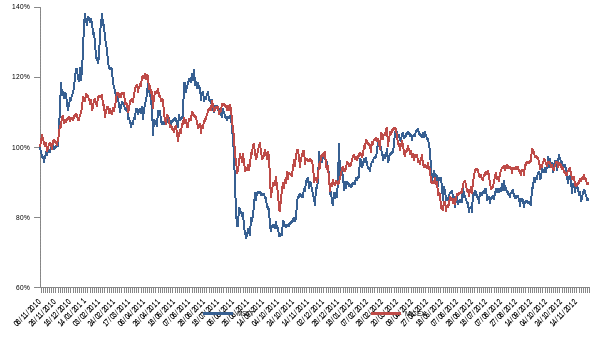
Source: Reuters, Finam, A-Team analysis Share price performance (rebased)
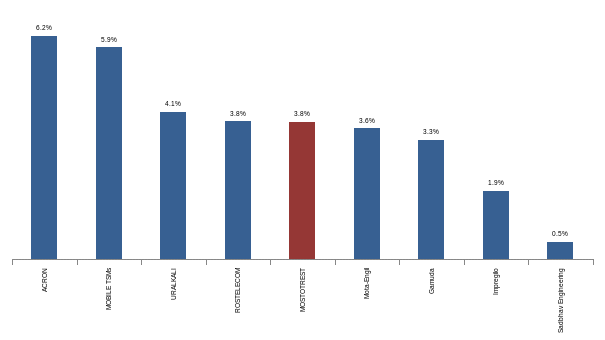
Source: Google Finance Top 5 non-O&G companies on MICEX and peers by dividend yield
Source: Reuters, Financial Times USD/RUB 30.11
Peers
|
H Source: Company data, A-team analysis  ighlights
We initiate coverage of Mostotrest (MSTT), leading infrastructure construction company in Russia, with a BUY rating and target price of RUB264 which implies an upside potential of 45% by the end of 2013.
|
|||||||||||||||||||||||||||||||||||||||||||||||||||||||||||||||||||||||||||||||||||||||||||||||||||||||||||||||||||||||||||||||||||||||||||||||||||||||||||||||||||||||||||||||||||||||||||
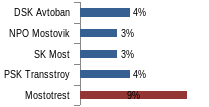
Figure 5. Backlog by companies, June 2012
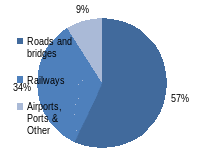
Source: Company data Figure 2. Revenue by market segments, 2011
Source: Company data Figure 3. Backlog by market segments, June 2012
Source: Company data Figure 4. Revenue by companies, 2011
Source: Company data Figure 6. Backlog by regions of operation, June 2012
Source: Company data
Table 1. Mostotrest’s own production capacities
Source: Company data
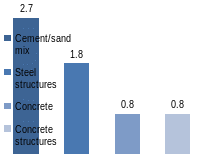
Figure 7. Own production of materials, 2011 (RUB bn)
Source: Company data
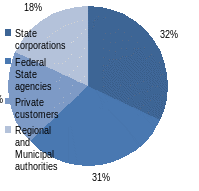
Figure 8. Mostotrest’s customers, June 2012
Source: Company data
Table 2. Russia is №56 by availability and quality of transport infrastructure, 2011
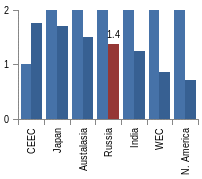
Figure 9. Inland infrastructure investment as % of GDP, 2010
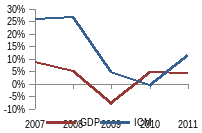
Figure 10. Transport infrastructure construction market vs GDP y/y growth rates
Table 3. Quality of Russian infrastructure
Source: The Global Enabling Trade Report
Figure 11. Transport infrastructure spending breakdown, 2011
Source: EMBS Group report
Figure 12. Main players on the infrustructure market
Source: A-Team analysis
Table 4. Target price estimation
Source: A-Team analysis
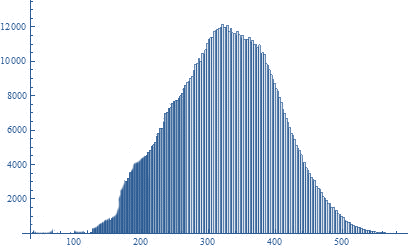
Figure 14. Monte Carlo simulation
Sell 9% Hold 20% Buy 71% Source: A-team analysis
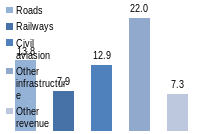
Figure 15. CAGR of Group’s revenue by segments,%
Source: Google Finance
Figure 16. Mostotrest’s total revenue, RUB bn
Source: A-Team analysis
Table 5. DCF-valuation summary
Source: A - Team analysis
Table 8. Mostotrest’s Corporate Segments
Source: Company data; A-Team analysis
Table 9. Multiples by segments
Source: Consensus estimates; A-Team analysis
Figure 17. Valuation field
Source: A-team analysis
Target price
Figure 18. Mostotrest’s profitability forecasts
Source: A-Team analysis
Figure 19. Mostotrest’s return on equity forecasts
Source: A-Team analysis
Figure 20. CAPEX forecast, RUB mn
Source: A-team analysis
Figure 21. Mostotrest’s dividends paid forecast, RUB mn
Source: A-team analysis 
|
Business Description OVERVIEW OF THE BUSINESS Mostotrest is the leading diversified Russian infrastructure construction company engaged in construction and renovation of automobile and railway bridges, roads, railways, airfields, airports, hydro engineering facilities and other infrastructure. Together Mostotrest and its subsidiaries, ETS and TSM, holds an 8.6% share of the transport infrastructure construction market (according to EMBS Group). In addition to providing construction services in key segments, Mostotrest operates toll roads and is engaged in concession projects. Mostotrest’s history goes back into 1930 when it was formed as a state-owned company for construction of extra-large bridges. Since then the company successfully completed over 7,500 infrastructure projects. After its privatization in 1992, Mostotrest has been operating as an OJSC, and is now recognized as one of the most experienced companies in the industry. A turning point in Mostotrest’s business happened when over the past few years it evolved from a regional player specialized in bridge construction into a diversified transport infrastructure construction company operating on a national scale. This was achieved by leveraging its leading position in the engineering and construction of bridges, and diversifying its operations both organically and through a series of strategic acquisitions (Appendix J). Today, Mostotrest is represented by a group of companies operating in all the major segments of the market and presence in most promising geographic locations throughout the country (Appendix P). The company performs works both in a capacity of an experienced general contractor able to manage large-scale projects and deploying its own unique technological and engineering expertise. Construction of bridges and roads is still, as it was 80 years ago, at the heart of the company’s business and, in fact, accounts for the major proportion of its revenue and backlog (Figures 1&2). Nevertheless, other segments do play an important role in Mostotrest’s business and its development as an integrated player in the market. BUSINESS ENTITIES AND KEY SERVICES The Group’s asset structure ensures diversification of its services and extensiveness of its geographic coverage. Alongside Mostotrest itself, the group includes Engtransstroy Corporation (ETS) and Transstroymekhanisatsiya (TSM) among others. Below there is a description of the key business entities (Figure 1). Figure 1. Mostotrest business structure
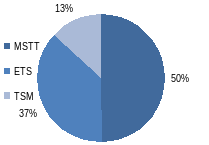
Source: Company data Mostotrest (MSTT) is the main entity of the group through which the majority of operations are carried out. Its business mainly deals with engineering, construction and renovation of road and rail bridges and highways. By the end of 2011, Mostotrest accounted for 50% of the group’s combined revenues and 60% of the backlog (Figures 4&5). The Company works on projects both in a capacity of a general contractor and as a subcontractor, and predominantly operates in economically prosperous regions like the Central Federal District (FD) inc. Moscow, Southern FD and Volga FD (Appendix K). Engtransstroy (ETS) is a company with extensive expertise in project management and turn-key implementation of transport infrastructure facilities of any complexity across all the major segments of the market. In 2011 ETS accounted for 37% and 13% shares in the Group’s combined revenues and backlog respectively (Figures 4&5). ETS operates as a pure general contractor bidding for large-scale projects and redistributing them further to its subcontractors. The company is headquartered in the Central FD and has branches in the North-Western, Southern and Far East Federal Districts (Appendix K). The acquisition of ETS has not only further expanded the geographical presence of Mostotrest, but also enabled it to strengthen its general contractor expertise and gave it an access to new market segments inc. the ports and railway infrastructure facilities construction. Transstroy-Mechanisatsiya (TSM) is a company mainly involved in construction and overhaul of bridges and highways as well as of airport infrastructure facilities. In 2011 TSM accounted for 27% and 13% in the Group’s revenue and backlog (Figures 4&5). TSM operates in a number of locations inc. the Central, Southern and Far East Federal Districts. It performs the construction works predomonantly as a subcontractor for ETS, but is also expanding its general contractor capabilities. From the strategy prospect, the acquisition of TSM further expanded Mostotrest’s geographic presence in investment-rich regions like Sochi in the Southern FD and Vladivostok in the Far East and enhanced the scope of its operations strengthening its bridges and highways construction capabilities and giving the access to airports infrastructure segment. Mostotrest also holds a 25% equity interest in Mostostroy-11, Surgut-based company with extensive technological and engineering expertise. Its core activities include construction and repair of automobile, railway and city bridges as well as other industrial and civil construction. The company operates through its 8 branches in the Urals and Southern Federal Districts expanding the Group’s geographic presence and further strengthening its position in the market. North-West Concession Company (NWCC) is the concessionaire of Moscow-St. Petersburg Highway set up by Vinci SA. Mostotrest has recently acquired a 50% stake in NWCC in order to diversify into the segment of concessions as well as to benefit from the partnership with a leading infrastructure construction company, Vinci. Natsionalnaya Industrialnaya Torgovaya Palata (NITP) is a road maintenance and repair company where Mostotrest holds a 60% equity stake. The company complements Mostotrest’s core business and enables it to bid for emerging life cycle contracts that involve construction and subsequent maintenance and repair of infrastructure facilities. This is also in line with Mostotrest’s strategy of diversification into related market segments. United Toll Systems (UTS) is a joint venture set up in partnership with Kapsch Group, leading toll collection systems developer. UTS is engaged in the repair, maintenance and toll-based operations of a segment of the M4 “Don” Highway further diversifying the Group’s operations into related segments as part of its long-run strategy. ON-SITE PRODUCTION FACILITIES AND SUPPLIERS Each regional branch of MSTT has its own production facilities that enable it to produce particular materials used in construction inc. concrete, cement and sand mix as well as engineering structures such as precast concrete, reinforced concrete structures and steel structures. TSM also has capacities to produce concrete and cement. For production of more sophisticated engineering metal structures, Mostotrest deploys its two factories “Mokon” (Moscow) and Mekhstroymost (Tula). The Company’s capacities supply almost a third of the materials necessary for operations (Table 1 & Figure 7). The rest of raw materials and engineering structures is purchased on a centralized basis directly from the relevant suppliers (Appendix H). The centralized purchasing system enables MSTT to efficiently monitor the situation in raw materials market and unify its purchasing procedures accordingly. HIGH PROFILE PROJECTS IN BACKLOG Mostotrest and its subsidiaries successfully fill their order book with new large-scale projects. As of 1H 2012, the Group had almost RUB300bn worth of projects in its backlog which covers 3x its 2011 revenues. Mostotrest is currently working on a number of projects inc. the construction of Moscow Fourth Ring Road worth RUB60bn, Kurortny Avenue Relief Road in Sochi (RUB50.3bn), two sections of the Moscow-Saint Petersburg Highway (RUB83.1bn) and many others (Appendix L). CUSTOMER BASE Mostotrest mainly serves the public sector customers inc. Federal State agencies, regional and municipal authorities as well as state-related corporations and private customers through emerging Public Private Partnership projects. As of 1H 2012, the state customers accounted for over 80% of the Group’s backlog (Figure 8). For more detail on customers see Appendix I. DEVELOPMENT STRATEGY Mostotrest has been vigorously executing its long-term strategy which contributed dramatically to its successful development. In order to retrain its leading positions, Mostotrest is committed to further leveraging its technological expertise to deliver complex projects across all the segments of its operation, strengthening its general contractor expertise and developing in a new segment of the market, namely, construction of tunnels which is deemed highly profitable.
Industry Overview and Competitive Positioning The transport infrastructure construction industry in Russia has experienced a decade of strong growth amidst the abundant government spending. From 2000 to 2010 Russia’s spending on inland transport infrastructure development averaged 1.4% of GDP a year. In 2010 the country’s spending was 40 bps higher than the average spent by other member countries of the International Transport Forum (ITF), according to OECD (Figure 9). Demand for transport infrastructure construction works has been high with the market estimated at RUB660bn in 2011. Almost 60% of the spending was directed to construction of bridges and roads (Figure 11). During pre-crisis years the infrastructure construction market was growing faster than the economy as a whole, while in 2009 it took a weaker hit than the economy (Figure 10). The market is expected to grow further as the government is determined to rebuild and renovate the transport infrastructure, which, due to its extremely poor state does not meet the country’s requirements. It is estimated that the economy loses up to 3% of GDP annually in the form of unearned revenue and damaged competitiveness of goods due to abnormally high transportation costs, which, according to the Ministry of Transport (MinTrans) make up on average 20-25% of the output costs while in countries with a well developed transport infrastructure that is only 7-8%. So it became a state priority to develop the transport infrastructure as the one in its current state undermines the country’s economic development. In the Global Enabling Trade report prepared for the World Economic Forum 2012, Russia was ranked low for the quality of its transport infrastructure (Table 2 & 3). Below is a brief analysis of the key transport infrastructure elements. Roads. The major problem with roads is that they are insufficient, highly depreciated and overloaded as a result. According to Russian Statistics Agency (Rosstat), In 2011 there was 1,094 th km of roads out of which 20% was unpaved, and 35% required repair. In comparison with 1995, road network added just 16% severely lagging behind the surge in car ownership with the number of passenger cars growing 142% which significantly strains the country’s transportation system. As the roads accounted for almost 70% and 80% of cargo and passenger transportation, it is vital to upgrade and extend the existing network. Railways. While in terms of length the railway network is fairly well developed counting 85,292 km of lines, the quality of the railway transportation services leaves much to be desired as about 59% of the railways are depreciated and require upgrade. That, in turn, has a twofold implication: on the one hand it results in lower efficiency of the railway transportation itself, and, on the other hand puts additional pressure on the road network as the increasingly higher number of commercial shipment is made by means of roads due to unsatisfactory and untimely railway services. According to BCG, in 2011 the mining industry alone could have failed to realize as much as $4.5bn worth of produce because of the railway system’s inability to meet the industry’s transportation needs which undermines the country’s export potential. Sea ports and Inland waterways. In addition to having insufficient sidings, limited throughput capacity and being on average 70% depreciated, the majority of Russian sea ports lack deep water harbors which makes it impossible to service high-tonnage ships. For example, the Trade Sea Port of Kaliningrad is currently being used at just 35% capacity as it cannot service ships with a draught deeper than 9 meters, given that the most commonly used ships like Aframax and Post-Panamax require harbors of at least 15 meters in depth. This altogether results in lower volume of trade and over RUB220bn will be invested in sea ports development as part of the Federal Target Program (FTP) with private companies already actively investing in renovation of sea ports. The inland waterway infrastructure is also in need of a complete overhaul as the majority of facilities were build in 1950-60s and were never renovated since then. Airports and airfields. With the airline passenger traffic increasing dramatically over the past decade Russia is becoming short of runways as the major airports operate at their full capacity. Given that over 60% of the country’s territory lies in the regions of Extreme North where the only acceptable means of transport is aviation, it is important to develop the appropriate infrastructure, and, in fact, over RUB1,250bn is allocated for this purpose within the FTP. Underpinned by the current situation, demand for infrastructure construction services will continue to be high as Russia will need to spend 2-2.5% of GDP by 2020 in order to fix the problem according to MinTrans, while the international events such as the 2014 Winter Olympics and the 2018 FIFA World Cup and entry to WTO meant to boost trade will put extra pressure on transportation system calling for extensive build out and upgrade of transport infrastructure. And, in fact, a number of determined steps have been taken including the launch of the Federal Target Program ‘Development of the Transport System’ under which RUB13.5tn. Is planned to be invested in infrastructure between 2010 and 2015. We expect the market to grow at a 12.6% CAGR during 2012-2017. SIGNIFICANT INDUSTRY TRENDS Over the past few years the industry experienced a number of trends that have impacted its operating environment strengthening the position of large and integrated companies like Mostotrest. Among those changes was the move from tendering numerous small and fairly straight-forward projects to tendering more complex and aggregate ones as was seen through the average industry contract size more than tripling to RUB3.2mn over the past 4 years. Another significant development was the introduction of life cycle projects that involve the construction and subsequent repair and maintenance of infrastructure facilities awarded to a single company. These projects are seen attractive as they ensure guaranteed income to the operator company and, in fact, Mostotrest won both of the projects of this type tendered in 2011. The industry also saw the emergence of alternative financing sources like Private Public Partnerships (PPP) which enable private sector investors to build infrastructure facilities and subsequently operate them for revenue over a specified period. PPPs are not only beneficial to the government helping it to ease its financial burden, but are also beneficial to construction companies in diversifying their customer base. COMPETITIVE POSITIONING The transport infrastructure construction market in Russia is very fragmented as it is worldwide. The companies operating in this market can be broken into 3 tiers: small-size regional companies capable of performing simple construction and repair works, medium-size companies implementing reasonably complex projects with focus on a limited range of works, and top-tier companies like Mostotrest operating on a national scale with established track record in implementing large-scale and technologically complex projects in a number of segments. The top-tier companies operate in their own environment with significant entry barriers in the form of reputation, scale, and financial recourses. We take a closer look at these companies, direct competitors of Mostotrest. PSK Transstroy is the second largest company holding 4% of the market. Originally part of the USSR Ministry for Transport Construction, Transstroy was reorganized as a state corporation in 1991 and was later privatized in 2007. The company has strong expertise in engineering and design of transport infrastructure and is predominantly involved in construction and overhaul of highways, bridges and airport runways. DSK Avtoban is a company mainly specialized in construction of highways and bridges with some operations in other segments. It has a market share of 4% and is located in Krasnodar region. In addition to operating in the Sothern part of Russia the company covers a number of other locations. SK Most has a 3% market share and specializes in construction of bridges, interchanges, tunnels and airport infrastructure facilities. It has a particularly strong expertise in construction of railway, traffic and metro tunnels. In 2012 the company was acquired by an oil trader, Gennady Timchenko, whose assets also include a Moscow-based construction and transport services company ARKS. NPO Mostovik designs and constructs highways, bridges, railways and tunnels and holds a 3% share in the broad infrastructure construction market. Mostovik is the main competitor of Mostotrest in the bridges construction segment. According to PMR report, in 2009 the company held a 6% share of the bridges segment, while Mostotrest’s controlled the largest share of 25%. Mostovik has a broad exposure to various projects related to the 2014 winter Olympics in Sochi. Even though the competition among major companies is fairly tough, Mostotrest as the industry leader is well positioned in the market and has a number of advantages that will enable it to strengthen its position further acquiring higher market shares. We see Mostotrest’s competitive advantage in its:
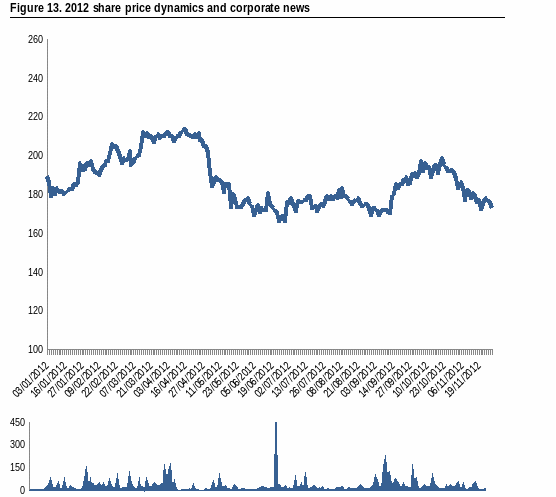
Investment summary Mostotrest started 2012 trading at RUB190 a share reaching its peak of RUB213 upon the announcement of 2011 IFRS results in mid April. The successful performance for the year boosted investor sentiment, however, the shares took a downward trend since then. This is, in our view, due to lower post-IPO trading liquidity which puts a discount on the stock as investors seek to compensate for additional risk.
800 Trading volume (ths shares)
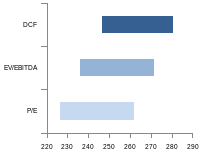
Source: Company data, A-team analysis Mostotrest offers a good opportunity to tap into a fast growing sector with strong fundamentals. In fact, the infrastructure construction market in Russia is seen to grow at 12.6% CAGR during 2012-2017 with potential investments amounting to RUB13.5tn. The company itself has a strong position which is seen through healthy profitability, low leverage and a strong portfolio of projects. In fact, MSTT has a ROE of 20%, Debt-to-Capital ratio of 30% with almost 85% of the obligations coming in the form of short-term borrowings which are fully repaid within a year, and almost RUB300 bn worth of projects in its order book. The stock also offers an attractive dividend story paying out 54% of net income which translates into 3.8% dividend yield compared to that of 2% for the industry. In fact, Mostotrest is in top 5 companies on the MICEX (exc. O&Gs) by dividend yield. This is seen particularly attractive as investors wish to move focus from capital gains to more stable dividend returns given the current uncertainty in financial markets. Our valuation further indicates the investment appeal of Mostotrest as the target price of RUB264 implies an impressive upside potential of 45% by the end of 2013. The stock trades at 2013E EV/EBITDA of 4.1x and 2013E P/E of 10.5x providing 23% and 18% discounts to international peers, while the one-year forward PEG ratio of only 0.7 further indicates that the stock is undervalued. We firmly believe that Mostotrest is a good value stock, and, in fact, we assessed it against a number of rigorous screening criteria used by FTSE in order to identify quality value stocks in emerging markets that constitute its famous FTSE Value-Stocks Indices. Our expectations were fulfilled as Mostotrsest met all the criteria (Appendix E). Taking all of these into account we give a strong BUY recommendation, as the stock, in our view, will deliver impressive returns over the course of next 12 months. Valuation We use DCF and Multiples valuation approaches, considering 50/50 shares of derived results in our estimates and set a target price of RUB 264 with 44% upside potential to current level. According to fundamental value and the value estimated by investors Company’s stock is underestimated and we assign BUY recommendation for MSTT stock. MONTE CARLO SIMULATION Sensitivity analysis shows that the major sources of risks associated with the company's cash flow generation are uncertainties in the following inputs: level of capital expenditures, market share in the bridges and highways segment, cost of sales drivers, long term growth rate of the industry. To measure these risks and determine their influence on the target price, we ran a Monte Carlo simulation for all of the indicators above (Figure 14). The analysis shows that there is only 9% probability that Mostotrest would be assigned a Sell recommendation. DCF APPROACH Revenues as a share of the Russian Federal program expenditures We forecast results of Mostotrest on an annual basis till 2017. We forecast Company’s revenues by segments (bridges and highways, railways, airports, hydrotechnical facilities) as shares of Russian infrastructure construction market. We take the Federal Target Program (FTP) "Development of transport system of Russia (2010-2015)" as a basis for our market value forecast and also consider other significant infrastructure projects that are not included in the FTP. We focus mainly on implementation of the FTP and other projects due to the significant difference between programs’ figures and real expenditures in some segments. We assume that the percentage of implementation of the FTP will remain at the same level that was in 2010 and 2011 (30-45% depending on segments). According to our estimates, Russian infrastructure construction market will grow at a CAGR of 12.6% in 2012-2017E. Before calculating Company’s market shares in different segments we subtracted VAT amounts from the FTP and other programs’ expenditures to get an appropriate assessment. We assume that Mostotrest’s market share in construction of bridges and highways will grow from 29.7% in 2012 to 33.06% in 2017. We believe that this segment will be an important driver of Group’s revenue until 2017 because of “3 highs”:
In construction of railway infrastructure facilities we assume a little decrease in Mostotrest’s market share after Winter Olympic games in 2014, after that Company’s market share will grow to 3.41%. We consider Mostotrest’s market share in construction of airfields and airports to remain on the current level and its market share in construction of hydrotechnical facilities to increase by 130bp in 2012-2017 (from 15.73% in 2012 to 17% in 2017). We believe that the segment of construction of other infrastructure facilities (which includes tunnel construction) will grow rapidly with 22% CAGR considering persistent management position to develop the segment of tunnel construction. The high growth of this segment can be explained by high profitability of the tunnel construction and current active development of this expertise. We forecast other revenue as a share of Company’s total revenue and we assume this share to decline gradually to 5.5% in 2017 because Company plans to focus on core segments. Since 2015 Company will start to get additional income from concession contracts. Cost of sales share in Revenue sticks to existing trend To estimate total expenses we forecast separately cost of sales, administrative expenses, financial cost and other expenses. Historically, cost of sales has constituted about 86% of revenues, where services of subcontractors, materials and personnel expenses have constituted about 82% of cost of sales. We forecast services of subcontractors, materials and personnel expenses as a share of Company’s revenue, because these types of expenditures directly depend on new contracts, which are reflected in Company’s revenue. We believe that services of subcontractors’ shares in revenue will increase from 48.5 to 50% due to the existing trend in rising of its share in revenue. We assume that materials share in total revenue will also rise from 13.5% to 15% by 2017 due to the significant rise in materials prices in 2011 and further consequent price reduction. We suppose that personnel expenses share in total revenue will remain the same as in 2011 (10.6%). As result of the analysis we arrive at a target price of RUB281 per share, implying 54% upside to the current price. The sensitivity of the share price to the terminal growth rate, WACC and the share of FTP implementation is summarized below in Table 6 & 7.
Table 6. Sensitivity analysis
Table 7. Sensitivity analysis
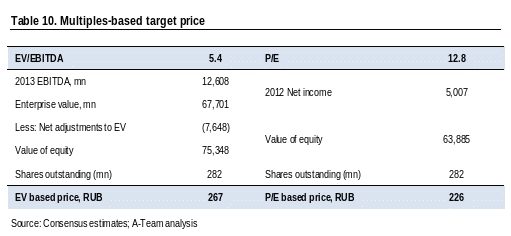
Source: A-Team analysis COMPARATIVE VALUATION We evaluate Mostotrest on the basis of EV/EBITDA and P/E ratios. In order to account for the specific structure of the company’s business we form a universe of peers which is divided into 3 separate groups. Each group is comprised of international infrastructure construction companies whose core activities largely overlap with principal activities carried out by one of the three corporate segments of Mostotrest (Table 8). The median EV/EBITDA and P/E ratios are derived for each group. The multiples are then weighted by the estimated proportion of revenues each corporate segment contributes to Mostotrest’s total in order to arrive at the ultimate fair multiples used to place value on the company as a whole (Table 9). This methodology, in our view, allows to better evaluate Mostotrest as there are no perfect comparables that can be used as a benchmark straight away. We would like to also emphasize that the listed Russian infrastructure constructors are not included into the peers’ universe due to their low free float levels, unsystematic trades with the shares, different accounting principles and the consequent lack of reliable financial data necessary to calculate their trading multiples. For the list of comparables see Appendix D. As result of the analysis we arrive at EV/EBITDA of 5.4x and P/E of 12.8x, which, applied to appropriate financial metrics, translates into multiples-based price per share of RUB 267 and RUB 226 respectively (Table 10).
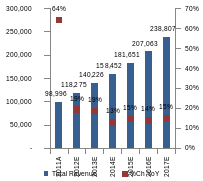
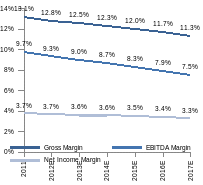
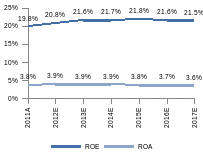
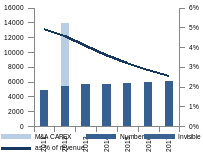
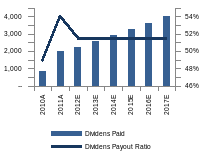
Financial Analysis Company’s margins stabilize Continuing government road-building schemes strengthening aimed at expanding the bridges and highways construction segment (one of Mostotrest’s key areas of operations) improves situation in the Russian construction market and contributes to the dynamic growth of the Company. We suppose that increase in proportion of works carried out by subcontractors will negatively affect the overall profitability. Also, we think that margins may be reduced by the end of 2012 due to the higher increase in costs of services of subcontractors and material prices. But we believe that such factors as continuing increase of government spending on FTP implementation and synergy effects from recent acquisitions will make it possible to overcome the negative effect from raise in materials prices in the nearest five years. Net Income margin will stabilize at a level of 3.3% by 2017. Return on equity improvement We forecast that Company’s ROE ratio will continue to grow consequently in the next 5 years (from 20.8% in 2012 to 21.5% in 2017) due to the continuing backlog’s increase and subsequent market growth. Also, Company’s ROE ratio is increased by the high level of Company’s assets turnover together with a constant leverage. In 2011 Mostotrest’s ROE was 19.8% that is substantially higher than the industry average ratio (7.6%). The ROIC ratio is also higher than ROIC of Company’s peers (20.3% and 12.3% respectively) because of the same reasons stated above. CAPEX reaches average industry levels In order to forecast CAPEX we consider the Company to operate more as a general contractor in future which means the reduction of necessity of increasing own capacities through CAPEX inflows. According to this, we forecast capital expenditure growth to slow. We assume that CAPEX to Revenue Ratio will decline evenly during the next 5 years and will reach the industry average level of 3% by 2017. Following M&A strategy of the company, we consider no acquisitions over the next 5 years. High dividends per share One of the most attractive point related to Company’s share are high dividends paid. According to its charter the company must allocate 30% of net income to dividends. However Company generously distributes its extra profit to shareholders. In 2010 Company paid RUB845 mln as dividends that amounted 49% of Company’s net income. In 2011 Company paid 54% of its net income as dividends that amounted RUB2.033 bn. Dividend per Share (DPS) in 2011 was RUB7.14 that is 3.12x times higher than average for peers (RUB2.29). In the next 5 years we assume Mostotrest’s Dividend Payout Ratio to be maintained at the average level of 51%. Corporate Governance Shareholders structure The Сompany is currently owned by Marc O’Polo Investments (38.6%), Transfingroup AM (27.1%) and other shareholders — 34.3% (Figure 22).
In this way the final private beneficiaries of Mostotrest are: Arkady and Igor Rotenbergs, Konstantin Nikolaev, Nikita Mishin, Andrey Filatov (Figure 23).
The presence of strategic shareholders in our view supports the company’s ability to attract profitable contracts in the future. Igor and Arkady Rotenbergs are well connected and have a good relationship with the customers. These shareholders in our opinion proved to have good lobbying opportunities in the industry. Affiliation with Russian Railways improves the company’s railway project attraction. Corporate governance, board of directors and management structure Company’s shares are included in the B-quotation list on the MICEX. Listed companies should permanently comply with MICEX requirements concerning corporate governance, Mostotrest complies all necessary requirements (Appendix R). Comparing Company’s corporate governance performance with listing rules of foreign stock exchanges (NYSE and LSE) we should notice that Company complies not all requirements, but most of them (Appendix R). Despite the formally compliance with the listing requirements to corporate governance we should notice some limitations in Company’s corporate governance performance. The Board of Directors (BoD), chaired by Georgiy Koryashkin, sets the strategic objectives for the Company and ensures that the necessary resources are in place to enable these objectives to be met. The Board of Directors consists of 11 members, 2 of whom are Mostotrest’s senior managers, 3 are representatives of NPV Engineering, 3 are affiliated with Blagosostoyanie Pension Fund (Russian Railway), 1 is a representative of the Investor Protection Association and 2 are independent (Appendix P). Formally Company has 2 independent directors (Arnout Dirk Lugtmeijer and Mikhail Noskov) from 11 members of the BoD. There are some concerns among Russian investors about Mikhail Noskov’s independence. These doubts arise because of Mr. Noskov’s current position of Deputy of CFO at Severgroup and his participation as a member on the Board of Directors at OJSC Severstal. These companies belong to Alexey Mordashov, the former co-owner of N-Trans Group. Despite concerns we admit Mikhail Noskov’s independence because he meets all requirements to be an independent member according to the Company’s Corporate code of conduct. We believe that positions he hold in mentioned companies don’t affect the independence of his decisions about Company’s development. The presence of CEO and Deputy of CEO on the BoD (Vladimir Vlasov and Leonid Dobrovsky) guarantees the match between strategic and daily tasks of the Company. In 2012 the BoD of the Company has entered the representative of the Investor Protection Association (Alexander Shevchuk), the company specializing in the protection and promotion of the interests of institutional investors in Russia. This fact may have a positive impact on the Company’s corporate governance, especially in strengthening the interests of minority shareholders. Management team, led by CEO Vladimir Vlasov, is responsible for the day-to-day operations. Company has sole executive body, presented by the CEO, and has no collegial body (Appendix Q) in its management structure. Companies which shares are included in the B-quotation list on the MICEX don’t have to establish collegial management body (unlike companies which shares are included in A-quotation list). However collegial executive body may have positive impact on Mostotrest’s corporate governance and future development considering Company’s wide diversification of business structure and product portfolio. Now the functions of the collegial management body are partially performed by 12 deputies of the CEO, who cover different specific business function (all of them have long-term relevant experience in the industry). Investment Risks BUSINESS RISKS: Lower revenues as the result of a drop in demand for construction services due to worsening economic conditions. Poor economy can lead to the government cutting its spending on infrastructure projects, which will, in turn, hit the company’s revenues. However, this is somewhat smoothed as development of infrastructure is among the country’s top priorities and the government seems to be committed to executing the FTP even under weak macroeconomic situation. Risk of the company being unable to win tenders for new projects. The competition in the infrastructure construction market is increasing intensively making it harder for the company to attract new projects. Nevertheless, Mostotrest’s diversified business model and thorough expertise together with its excellent track record helps successfully bid for new projects. Higher than expected costs can jeopardize profitability under fixed contract prices. The company is not compensated for increases in project costs due to inflation in construction materials prices or other circumstances. As almost a third of the materials used in construction is produced internally, Mostotrest can handle the inflation of up to 17% without pressure on margins. Failure of debtors to meet their obligations. The company is reliant on funds it receives during the second half of the year from customers to finance its day-to-day operations and failure of the latter to make their payments will cause serious liquidity problems. However most of the customers are government bodies which do not normally delay payments. Delays in preparation works represent a significant risk to timing of the company’s projects execution. POLITICAL RISKS: Changes in government policy regarding the allocation of investments among different sectors of the economy represent a significant risk that can negatively affect the company’s business. The major shareholders have strong connection with Russian authorities which helps Mostotrest strengthen its position, however, should these shareholders lose favor the company’s business will be adversely affected. OTHER RISKS: Risk of overstated revenues due to the use of IAS11 revenue recognition principle under which the company recognizes revenues to the amount of costs incurred plus acceptable margin. Overoptimistic margins can bias the revenues thereby misleading the public. Low trading liquidity might impede the convergence of the equity’s market price to fundamental value derived on the basis of our analysis.
|
|||||||||||||||||||||||||||||||||||||||||||||||||||||||||||||||||||||||||||||||||||||||||||||||||||||||||||||||||||||||||||||||||||||||||||||||||||||||||||||||||||||||||||||||||||||||||||

Disclosures:
Ownership and material conflicts of interest:
The author(s), or a member of their household, of this report does not hold a financial interest in the securities of this company.
The author(s), or a member of their household, of this report does not know of the existence of any conflicts of interest that might bias the content or publication of this report.
Receipt of compensation:
Compensation of the author(s) of this report is not based on investment banking revenue.
Position as a officer or director:
The author(s), or a member of their household, does not serve as an officer, director or advisory board member of the subject company.
Market making:
The author(s) does not act as a market maker in the subject company’s securities.
Disclaimer:
The information set forth herein has been obtained or derived from sources generally available to the public and believed by the author(s) to be reliable, but the author(s) does not make any representation or warranty, express or implied, as to its accuracy or completeness. The information is not intended to be used as the basis of any investment decisions by any person or entity. This information does not constitute investment advice, nor is it an offer or a solicitation of an offer to buy or sell any security. This report should not be considered to be a recommendation by any individual affiliated with CFA Russia, CFA Institute or the CFA Institute Research Challenge with regard to this company’s stock.
APPENDIX A - FINANCIAL STATEMENTS (1/3)
STATEMENT OF COMPREHENSIVE INCOME
|
2009A |
2010A |
2011A |
2012E |
2013E |
2014E |
2015E |
2016E |
2017E |
Revenue |
78,971 |
60,279 |
98,996 |
118,275 |
140,226 |
158,452 |
181,651 |
207,063 |
238,807 |
Cost of sales |
(68,359) |
(51,284) |
(85,995) |
(103,162) |
(122,649) |
(139,014) |
(159,894) |
(182,909) |
(211,745) |
Gross profit |
10,612 |
8,995 |
13,001 |
15,113 |
17,577 |
19,438 |
21,757 |
24,154 |
27,061 |
Other income |
421 |
222 |
364 |
412 |
457 |
483 |
518 |
553 |
597 |
Operating costs |
(5,389) |
(4,557) |
(5,707) |
(6,818) |
(8,084) |
(9,135) |
(10,472) |
(11,937) |
(13,767) |
Other expenses |
(879) |
(949) |
(2,125) |
(2,295) |
(2,411) |
(2,414) |
(2,452) |
(2,477) |
(2,531) |
EBITDA |
8,157 |
6,488 |
9,609 |
11,001 |
12,608 |
13,708 |
15,049 |
16,343 |
17,860 |
Depreciation and amortisation |
3,392 |
2,777 |
4,076 |
4,590 |
5,069 |
5,336 |
5,698 |
6,050 |
6,500 |
Results from operating activities |
4,765 |
3,711 |
5,533 |
6,411 |
7,538 |
8,372 |
9,351 |
10,293 |
11,360 |
Finance income |
358 |
111 |
542 |
352 |
239 |
319 |
395 |
492 |
602 |
Finance costs |
(2,865) |
(1,341) |
(934) |
(1,355) |
(1,519) |
(1,655) |
(1,826) |
(2,012) |
(2,242) |
Share of profit/loss of equity accounted investees |
-- |
(7) |
(60) |
-- |
-- |
-- |
-- |
-- |
-- |
Profit before income tax |
2,258 |
2,474 |
5,081 |
5,408 |
6,258 |
7,036 |
7,920 |
8,773 |
9,720 |
Profits tax expense |
(897) |
(744) |
(1,376) |
(1,082) |
(1,252) |
(1,407) |
(1,584) |
(1,755) |
(1,944) |
Profit for the year |
1,635 |
1,730 |
3,705 |
4,327 |
5,007 |
5,629 |
6,336 |
7,019 |
7,776 |
Non-controlling interests |
-- |
-- |
(9) |
(11) |
(12) |
(14) |
(15) |
(17) |
(19) |
Total comprehensive income for the year |
1,635 |
1,730 |
3,696 |
4,316 |
4,995 |
5,615 |
6,320 |
7,001 |
7,757 |
Basic and diluted earnings per share |
6.59 |
6.97 |
13.24 |
15.47 |
17.90 |
20.12 |
22.65 |
25.09 |
27.80 |
Dividens Paid |
N/A |
(845) |
(2,003) |
(2,226) |
(2,576) |
(2,896) |
(3,260) |
(3,611) |
(4,001) |
Source: Company data, A-team analysis
APPENDIX A - FINANCIAL STATEMENTS (2/3)
STATEMENT OF FINANCIAL POSITION
|
2009A |
2010A |
2011A |
2012E |
2013E |
2014E |
2015E |
2016E |
2017E |
ASSETS |
|
|
|
|
|
|
|
|
|
Non-current assets |
|
|
|
|
|
|
|
|
|
Goodwill |
2,009 |
2,404 |
2,404 |
2,404 |
2,404 |
2,404 |
2,404 |
2,404 |
2,404 |
Intangible assets |
1,228 |
1,846 |
314 |
314 |
314 |
314 |
314 |
314 |
314 |
Property, plant and equipment |
12,864 |
13,099 |
14,912 |
15,729 |
16,357 |
16,757 |
16,928 |
16,846 |
16,476 |
Trade and other receivables |
58 |
51 |
376 |
376 |
376 |
376 |
376 |
376 |
376 |
Investments in equity accounted investees |
-- |
1,525 |
1,454 |
9,954 |
9,954 |
9,954 |
9,954 |
9,954 |
9,954 |
Prepayments |
-- |
-- |
453 |
453 |
453 |
453 |
453 |
453 |
453 |
Deferred tax assets |
722 |
-- |
395 |
395 |
395 |
395 |
395 |
395 |
395 |
Other non-current assets |
1,753 |
316 |
260 |
260 |
260 |
260 |
260 |
260 |
260 |
Total non-current assets |
18,634 |
19,241 |
20,568 |
29,886 |
30,513 |
30,914 |
31,084 |
31,002 |
30,632 |
Current assets |
|
|
|
|
|
|
|
|
|
Inventories |
2,989 |
3,938 |
6,559 |
7,955 |
9,604 |
11,050 |
12,900 |
14,973 |
17,583 |
Income tax receivable |
1,065 |
15 |
19 |
19 |
19 |
19 |
19 |
19 |
19 |
Trade and other receivables |
3,499 |
6,144 |
16,226 |
19,386 |
22,984 |
25,971 |
29,774 |
33,939 |
39,142 |
Amounts due from customers on construction contracts |
3,216 |
7,084 |
7,873 |
11,827 |
14,023 |
15,845 |
18,165 |
20,706 |
23,881 |
Prepayments |
7,251 |
13,739 |
16,817 |
20,174 |
23,985 |
27,185 |
31,269 |
35,769 |
41,408 |
Cash and cash equivalents |
12,792 |
19,950 |
29,254 |
19,817 |
26,444 |
32,811 |
40,855 |
49,998 |
61,225 |
Other current assets |
206 |
869 |
1,339 |
1,339 |
1,339 |
1,339 |
1,339 |
1,339 |
1,339 |
Total current assets |
31,018 |
51,739 |
78,087 |
80,518 |
98,398 |
114,221 |
134,320 |
156,743 |
184,597 |
Total assets |
49,652 |
70,980 |
98,655 |
110,403 |
128,911 |
145,135 |
165,404 |
187,746 |
215,229 |
EQUITY AND LIABILITIES |
|
|
|
|
|
|
|
|
|
Equity |
|
|
|
|
|
|
|
|
|
Share capital |
131 |
131 |
136 |
136 |
136 |
136 |
136 |
136 |
136 |
Additional paid in capital |
-- |
-- |
6,192 |
6,192 |
6,192 |
6,192 |
6,192 |
6,192 |
6,192 |
Reserve for available-for-sale financial assets |
110 |
141 |
107 |
107 |
107 |
107 |
107 |
107 |
107 |
Prepaid shares reserve |
-- |
6,185 |
-- |
-- |
-- |
-- |
-- |
-- |
-- |
Reserve for acquisition of own shares |
-- |
(68) |
(561) |
(561) |
(561) |
(561) |
(561) |
(561) |
(561) |
Retained earnings |
6,842 |
9,940 |
12,809 |
14,909 |
17,340 |
20,072 |
23,148 |
26,556 |
30,331 |
Total equity attributable to equity holders of the Company |
7,083 |
16,329 |
18,683 |
20,783 |
23,214 |
25,946 |
29,022 |
32,430 |
36,205 |
Non-controlling interests |
-- |
-- |
(7) |
(18) |
(30) |
(43) |
(59) |
(76) |
(95) |
Total equity |
7,083 |
16,329 |
18,676 |
20,766 |
23,184 |
25,903 |
28,964 |
32,354 |
36,110 |
Non-current liabilities |
|
|
|
|
|
|
|
|
|
Loans and borrowings |
4,375 |
491 |
1,224 |
1,793 |
1,831 |
1,855 |
1,865 |
1,860 |
1,838 |
Trade and other payables |
218 |
85 |
163 |
163 |
163 |
163 |
163 |
163 |
163 |
Deferred tax liabilities |
828 |
358 |
555 |
555 |
555 |
555 |
555 |
555 |
555 |
Total non-current liabilities |
5,421 |
934 |
1,942 |
2,511 |
2,549 |
2,573 |
2,583 |
2,578 |
2,556 |
Current liabilities |
|
|
|
|
|
|
|
|
|
Loans and borrowings |
6,079 |
6,184 |
6,408 |
8,758 |
10,221 |
11,450 |
13,017 |
14,744 |
16,905 |
Non-controlling interest |
1,418 |
1,076 |
425 |
425 |
425 |
425 |
425 |
425 |
425 |
Trade and other payables |
15,052 |
16,425 |
17,082 |
20,492 |
24,363 |
27,614 |
31,761 |
36,333 |
42,061 |
Amounts due to customers on construction contracts |
13,425 |
29,701 |
53,410 |
56,739 |
67,457 |
76,458 |
87,942 |
100,600 |
116,460 |
Other provisions |
311 |
43 |
527 |
527 |
527 |
527 |
527 |
527 |
527 |
Income tax liabilities |
863 |
288 |
185 |
185 |
185 |
185 |
185 |
185 |
185 |
Total current liabilities |
37,148 |
53,717 |
78,037 |
87,126 |
103,178 |
116,659 |
133,857 |
152,814 |
176,563 |
Total liabilities |
42,569 |
54,651 |
79,979 |
89,637 |
105,727 |
119,232 |
136,440 |
155,392 |
179,119 |
Total equity and liabilities |
49,652 |
70,980 |
98,655 |
110,403 |
128,911 |
145,135 |
165,404 |
187,746 |
215,229 |
Source: Company data, A-team analysis
APPENDIX A - FINANCIAL STATEMENTS (3/3)
STATEMENT OF CASH FLOWS
|
2010A |
2011A |
2012E |
2013E |
2014E |
2015E |
2016E |
2017E |
CASH FLOWS FROM OPERATING ACTIVITIES |
|
|
|
|
|
|
|
|
Profit for the year |
1,730 |
3,705 |
4,327 |
5,007 |
5,629 |
6,336 |
7,019 |
7,776 |
Depreciation and amortisation |
2,777 |
4,076 |
4,590 |
5,069 |
5,336 |
5,698 |
6,050 |
6,500 |
Other |
1,450 |
478 |
(11) |
(12) |
(14) |
(15) |
(17) |
(19) |
Cash from operating activities befor e changes in working capital and provisions |
5,957 |
8,259 |
8,906 |
10,064 |
10,951 |
12,019 |
13,052 |
14,257 |
Increase in inventories |
(549) |
(2,447) |
(1,396) |
(1,649) |
(1,446) |
(1,849) |
(2,073) |
(2,611) |
Increase in trade and other receivables |
(1,036) |
(9,878) |
(3,160) |
(3,598) |
(2,987) |
(3,802) |
(4,165) |
(5,203) |
Increase in amounts due from customers on construction contracts |
(3,234) |
(1,044) |
(3,954) |
(2,195) |
(1,823) |
(2,320) |
(2,541) |
(3,174) |
Increase in prepayments |
(1,098) |
(3,531) |
(3,357) |
(3,811) |
(3,200) |
(4,083) |
(4,501) |
(5,639) |
Increase/(decrease) in other liabilities |
(108) |
484 |
-- |
-- |
-- |
-- |
-- |
-- |
Increase/(decrease) in trade and other payables |
(914) |
958 |
3,410 |
3,871 |
3,251 |
4,148 |
4,572 |
5,728 |
Increase in amounts due to customers on construction contracts |
17,617 |
23,709 |
3,329 |
10,718 |
9,001 |
11,484 |
12,658 |
15,860 |
Net cash from operating activities |
16,635 |
16,510 |
3,778 |
13,400 |
13,746 |
15,595 |
17,001 |
19,218 |
CASH FLOWS FROM INVESTING ACTIVITIES |
|
|
|
|
|
|
|
|
CAPEX |
(1,488) |
(2,931) |
(5,407) |
(5,697) |
(5,736) |
(5,868) |
(5,969) |
(6,130) |
Acquisitions |
(63) |
-- |
(8,500) |
-- |
-- |
-- |
-- |
-- |
Other |
(1,590) |
(587) |
-- |
-- |
-- |
-- |
-- |
-- |
Net cash used in investing activities |
(3,141) |
(3,518) |
(13,908) |
(5,697) |
(5,736) |
(5,868) |
(5,969) |
(6,130) |
CASH FLOWS FROM FINANCING ACTIVITIES |
|
|
|
|
|
|
|
|
Net proceeds from issuance of shares |
6,185 |
-- |
-- |
-- |
-- |
-- |
-- |
-- |
Aсqusition of treasury shares |
(68) |
(539) |
-- |
-- |
-- |
-- |
-- |
-- |
Change in debt |
(2,432) |
(1,379) |
2,919 |
1,500 |
1,253 |
1,577 |
1,722 |
2,139 |
Dividends paid |
(801) |
(1,287) |
(2,226) |
(2,576) |
(2,896) |
(3,260) |
(3,611) |
(4,001) |
Other |
(1,289) |
(483) |
-- |
-- |
-- |
-- |
-- |
-- |
Net cash (used in)/from financing activities |
1,595 |
(3,688) |
693 |
(1,076) |
(1,643) |
(1,683) |
(1,890) |
(1,862) |
Net increase in cash and cash equivalents |
15,089 |
9,304 |
(9,437) |
6,628 |
6,366 |
8,044 |
9,143 |
11,227 |
Cash and cash equivalents at 1 January |
4,861 |
19,950 |
29,254 |
19,817 |
26,444 |
32,811 |
40,855 |
49,998 |
Cash and cash equivalents at 31 December |
19,950 |
29,254 |
19,817 |
26,444 |
32,811 |
40,855 |
49,998 |
61,225 |
Source: Company data, A-team analysis
APPENDIX B – FINANCIAL RATIOS
|
2009 |
2010 |
2011 |
1H 2012 |
Avr for peers (2011) |
2012E |
2013E |
2014E |
2015E |
2016E |
2017E |
|
Margins (%) |
|
|
|
|
|
|
|
|
|
|
|
|
Gross Margin |
13.4% |
14.9% |
13.1% |
13.1% |
47.3% |
12.8% |
12.5% |
12.3% |
12.0% |
11.7% |
11.3% |
|
EBITDA Margin |
10.3% |
10.8% |
9.7% |
9.8% |
9.8% |
9.3% |
9.0% |
8.7% |
8.3% |
7.9% |
7.5% |
|
EBIT Margin |
6.0% |
6.2% |
5.6% |
6.7% |
5.8% |
5.4% |
5.4% |
5.3% |
5.1% |
5.0% |
4.8% |
|
Net Income Margin |
2.1% |
2.9% |
3.7% |
4.0% |
2.1% |
3.7% |
3.6% |
3.6% |
3.5% |
3.4% |
3.3% |
|
Return on Equity (%) |
|
|
|
|
|
|
|
|
|
|
|
|
ROE |
23.1% |
10.6% |
19.8% |
9.8% |
7.6% |
20.8% |
21.6% |
21.7% |
21.8% |
21.6% |
21.5% |
|
ROA |
3.3% |
2.4% |
3.8% |
2.0% |
1.8% |
3.9% |
3.9% |
3.9% |
3.8% |
3.7% |
3.6% |
|
ROIC |
25.1% |
15.4% |
20.3% |
10.3% |
12.3% |
22.7% |
24.1% |
24.1% |
24.3% |
24.1% |
23.9% |
|
Investment Ratios |
|
|
|
|
|
|
|
|
|
|
|
|
Capex/ Revenue (%) |
N/A |
12.6% |
4.9% |
19% |
5% |
11.8% |
4.1% |
3.6% |
3.2% |
2.9% |
2.6% |
|
Capex/D&A |
N/A |
2.74 |
1.20 |
5.99 |
1.27 |
1.18 |
1.12 |
1.08 |
1.03 |
0.99 |
0.94 |
|
Capital structure |
|
|
|
|
|
|
|
|
|
|
|
|
D/E |
1.5 |
0.4 |
0.4 |
0.5 |
1.4 |
0.5 |
0.5 |
0.5 |
0.5 |
0.5 |
0.5 |
|
Debt/Capital |
0.6 |
0.3 |
0.3 |
0.3 |
0.5 |
0.3 |
0.3 |
0.3 |
0.3 |
0.3 |
0.3 |
|
Liquidity Ratios |
|
|
|
|
|
|
|
|
|
|
|
|
Current Ratio |
0.8 |
1.0 |
1.0 |
1.0 |
1.0 |
0.9 |
1.0 |
1.0 |
1.0 |
1.0 |
1.0 |
|
Quick Ratio |
0.8 |
0.9 |
0.9 |
0.9 |
0.9 |
0.8 |
0.9 |
0.9 |
0.9 |
0.9 |
0.9 |
|
Cash Ratio |
0.3 |
0.4 |
0.4 |
0.1 |
0.2 |
0.2 |
0.3 |
0.3 |
0.3 |
0.3 |
0.3 |
|
Coverage Ratios |
|
|
|
|
|
|
|
|
|
|
|
|
Interest Coverage Ratio |
1.7 |
2.8 |
5.9 |
3.1 |
5.6 |
4.7 |
5.0 |
5.1 |
5.1 |
5.1 |
5.1 |
|
Efficiency Ratios |
|
|
|
|
|
|
|
|
|
|
|
|
Revenue/Fixed Assets |
4.9 |
3.5 |
5.6 |
2.4 |
3.9 |
6.4 |
7.4 |
8.1 |
9.2 |
10.6 |
12.4 |
|
Working Capital-to-Revenue, % |
-0.11 |
-0.11 |
0.06 |
0.17 |
0.3 |
0.06 |
0.06 |
0.06 |
0.06 |
0.06 |
0.06 |
|
Inventory Turnover |
0.04 |
0.07 |
0.07 |
4.71 |
0.1 |
0.07 |
0.07 |
0.07 |
0.07 |
0.07 |
0.07 |
|
Earnings per share |
|
|
|
|
|
|
|
|
|
|
|
|
EPS |
N/A |
6.97 |
13.24 |
6.47 |
2.94 |
15.47 |
17.90 |
20.12 |
22.65 |
25.09 |
27.80 |
|
DPS |
N/A |
3.40 |
7.14 |
N/A |
2.29 |
7.94 |
9.19 |
10.33 |
11.63 |
12.88 |
14.27 |
|
|
|
|
|
|
|
|
|
|
|
|
|
|
Source: A-team analysis
APPENDIX C - WEIGHTED AVERAGE COST OF CAPITAL CALCULATION
Cost of Debt |
|
Weighted-average cost of debt (1) |
11.1% |
Tax rate (2) |
20% |
After-tax cost of debt |
8.9% |
Capital structure |
|
Debt |
0.21 (3) |
Equity |
0.79 (4) |
WACC |
15.5% |
Cost of Equity |
|
Risk-free rate (5) |
6.1% |
Unlevered beta (6) |
0.79 |
D/E |
0.5 |
Tax rate |
0.2 |
Relevered Beta: |
1.1 |
MRP for developed economy (USA) |
6.8% |
Market return (S&P 500) (8) |
9.7% |
-US 30-year T-Bond ytm (9) |
2.9% |
+Country risk premium (RF) |
3.2% |
RF Government 30-year Bond ytm (5) |
6.1% |
-US 30-year T-bond ytm (9) |
2.9% |
Market risk premium (Russia) (7) |
10% |
Cost of Equity |
17.2% |
Notes:
Weighted average interest rate paid on company loans and borrowings; 1H 2012 interim accounts
Corporate income tax rate under Russian legislation
Book value of debt as for interim FS for 6m 2012, plus amount planned to borrow for acquisitions
Market value of equity as for 10 Jan 2013
Yield-to-maturity on a 30-year USD denominated government bond maturing in 2028; rusbonds.ru
Average unlevered beta for the group of international peers
Market risk premium for Russian Federation is calculated as:
MRP (developing market - RF) = MRP (developed market - USA) + Country Risk Premium
where:
MRP (USA) = Market return (USA) – Risk-free rate (USA);
Country risk premium is estimated by sovereign yield spread.
Annualized expected return on S&P500 calculated based on 36 months of historical data
Yield-to-maturity on a 30-year US T-Bond maturing in; bloomberg.com
Source: A-Team analysis

 8
January 2013




 Source:
Rosstat