

Chapter 6 Outline
Electrolux's Global Investment Strategy
Introduction
Foreign Direct Investment in the World Economy
The Growth of FDI
The Direction of FDI
The Source of FDI
Horizontal Foreign Direct Investment
Transportation Costs
Market Imperfections (Internalization Theory)
Strategic Behavior
The Product Life Cycle
Location-Specific Advantages
Vertical Foreign Direct Investment
Strategic Behavior
Market Imperfections
Implications for Business
Chapter Summary
Critical Discussion Questions
Honda in North America
Notes
Electrolux's Global Investment Strategy
With 1998 sales of over SKr110 billion ($14 billion), Electrolux is the world's largest manufacturer of household appliances (washing machines, dishwashers, refrigerators, vacuum cleaners, and so on). A Swedish company with a small home market, Electrolux has always had to look to other markets for its growth. By 1997, the company was generating over 85 percent of its sales outside of Sweden. A little over 52 percent of sales are in Western Europe, with another 27 percent in North America. In recent years, the most rapid growth has come from Asia (which accounted for 5.1 percent of 1997 revenues), Eastern Europe (7 percent of revenues), and Latin America (6.4 percent of revenues). As of early 1998, the company employed over 100,000 people worldwide, had 150 factories and 300 warehouses located in 60 countries, and sold about 55 million products per year in 150 countries.
Electrolux's expansion into Asia, Eastern Europe, and Latin America dates from an early 1990s planning review, which concluded that demand for household appliances was mature in Western Europe and North America. The company conjectured that growth in these regions would be limited to replacement demand and the growth in population, and would be unlikely to exceed 2 to 3 percent annually. Leif Johansson, then the CEO of Electrolux, decided the company was too dependent on these mature markets. He reasoned that the company would have to expand aggressively into the emerging markets of the developing world if it was to maintain its historic growth rate. The company estimated that demand for household appliances in Asia, Eastern Europe, and Latin America could grow at 20 percent annually for at least the next decade, and probably beyond. In 1994, he set an ambitious goal for Electrolux; the company would have to double its sales in these emerging markets from the $1.35 billion it achieved in 1994 to $2.7 billion by 1997 (this target was exceeded). As an additional goal, he stated that Electrolux should become one of the top three suppliers of household goods in Southeast Asia by the year 2000.
In addition to the obvious growth potential, another consideration for Electrolux was that its main global competitors, General Electric and Whirlpool of the United States and Germany's Bosch-Siemans,
had recently announced similar plans. Electrolux felt that it better move quickly so as not to be left out in the race to profit from these emerging markets.
Having committed itself to expansion, Electrolux had to decide how to achieve its ambitious goals. A combination of cost considerations and import barriers made direct exporting from its Western European and North American plants uneconomical. Instead, various approaches were adopted for different regions and countries. Acquisitions of going concerns, green-field developments, joint ventures, and enhanced marketing were all considered. Electrolux stated that it was prepared to spend $200 million per year to increase its presence in these emerging markets.
Electrolux made its first move into Eastern Europe in 1991 when it acquired Lehel, Hungary's largest manufacturer of household appliances. In addition, Electrolux decided to establish wholly owned operating companies in Russia, Poland, and the Czech Republic. Each of these operating subsidiaries was a green-field development. Asia demands a much greater need to adapt to local conditions. Regulations concerning foreign ownership in India and China, for example, virtually compel Electrolux to work through joint ventures with local partners. In China, the world's fastest-growing market, the company already had joint ventures in compressors, vacuum cleaners, and water purification equipment in 1994. Between 1994 and 1997, the company spent another $300 million to build five manufacturing plants in the country. In Southeast Asia, the emphasis is on the marketing of goods imported from China, rather than on local production. In Latin America, the company expanded through acquisitions, including its 1996 acquisition of Refripar, the largest producer of refrigerator products in Brazil. Electrolux's goal is to turn Refripar, which had 1995 sales of about $600 million, into its Latin American base for the production of household products.
Although Electrolux has been largely successful in its attempt to globalize its production and sales base, the expansion has not been without its problems. In 1997, the company suffered a significant drop in profit due to deteriorating market conditions in Brazil and the Asian Pacific region. The profit slump exposed serious weaknesses that had developed in Electrolux's global production system. Although the company had expanded rapidly via acquisitions since the early 1990s, it had not rationalized its production operations. Consequently, there was often considerable duplication of facilities within regions. In early 1998, the company's new CEO, Michael
Treschow, announced a restructuring plan that called for the loss of 12,000 jobs and the closure of 25 factories and 50 warehouses worldwide. At the same time, however, Treschow reaffirmed Electrolux's commitment to building a global corporation with significant operations in the world's developing markets.
http://www.electrolux.se
Source: C. Brown-Humes, "Electrolux Plugs into Households All over Asia," Financial Times, April 27, 1995, p. 15; C. Brown-Humes, "Electrolux Buys Control of Brazilian Group," Financial Times, January 11, 1996, p. 30; G. McIvor, "Electrolux Comes under the Scalpel," Financial Times, October 29, 1997, p. 27; and Electrolux's Web site http://www.electrolux.com.
Introduction
This chapter is concerned with the phenomenon of foreign direct investment (FDI). Foreign direct investment occurs when a firm invests directly in facilities to produce and/or market a product in a foreign country. The 1991 purchase of Hungary's Lehel by Electrolux and its 1996 acquisition of Brazil's Refripar are examples of FDI, as are the company's investments in joint ventures to manufacture products in China and in green-field (new) wholly owned production facilities in Russia, Poland, and the Czech Republic (for details, see the opening case). The U.S. Department of Commerce has come up with a more precise definition of FDI. According to the department, FDI occurs whenever a US citizen, organization, or affiliated group takes an interest of 10 percent or more in a foreign business entity. Once a firm undertakes FDI it becomes a multinational enterprise (the meaning of multinational being "more than one country").
There is an important distinction between FDI and foreign portfolio investment (FPI). Foreign portfolio investment is investment by individuals, firms, or public bodies (e.g., national and local governments) in foreign financial instruments (e.g., government bonds, foreign stocks). FPI does not involve taking a significant equity stake in a foreign business entity. FPI is determined by different factors than FDI and raises different issues. Accordingly, we discuss FPI in Chapter 11 in our review of the international capital market.
In Chapter 4, we considered several theories that sought to explain the pattern of trade between countries. These theories focus on why countries export some products and import others. None of these theories address why a firm might decide to invest directly in production facilities in a foreign country, rather than exporting its domestic production to that country. The theories we reviewed in Chapter 4 do not explain the pattern of foreign direct investment between countries. The theories we explore in this chapter seek to do just this.
Our central objective will be to identify the economic rationale that underlies foreign direct investment. Firms often view exports and FDI as "substitutes" for each other. In the opening case, we saw how Electrolux considered and then ruled out serving emerging markets through exports from Western Europe. Instead, the company decided to invest directly in production facilities in those markets. One question this chapter attempts to answer is, Under what conditions do firms such as Electrolux prefer FDI to exporting? The opening case hints at some of the answers (e.g., trade barriers, access to markets, cost considerations). Here we will review various theories that attempt to provide a comprehensive explanation for this question.
This is not the only question these theories need to address. They also need to explain why it is preferable for a firm to engage in FDI rather than licensing. Licensing occurs when a domestic firm, the licensor, licenses to a foreign firm, the licensee, the right to produce its product, to use its production processes, or to use its brand name or trademark. In return for giving the licensee these rights, the licensor collects a royalty fee on every unit the licensee sells. The great advantage claimed for licensing over FDI is that the licensor does not have to pay for opening a foreign market; the licensee does that. For example, why did Electrolux acquire Lehel of Hungary, when it could have simply allowed Lehel to build Electrolux products under license and collected a royalty fee on each product that Lehel subsequently sold? Why did Electrolux prefer to bear the substantial risks and costs associated with purchasing Lehel, when in theory it could have earned a good return by licensing? The theories reviewed here attempt to provide an answer to this puzzle.
In the remainder of the chapter, we first look at the growing importance of FDI in the world economy. Next we look at the theories that have been used to explain horizontal foreign direct investment. Horizontal foreign direct investment is FDI in the same industry as a firm operates in at home. Electrolux's investments in Eastern Europe and Asia are examples of horizontal FDI. Having reviewed horizontal FDI, we consider the theories that help to explain vertical foreign direct investment. Vertical foreign direct investment is FDI in an industry that provides inputs for a firm's domestic operations, or it may be FDI in an industry abroad that sells the outputs of a firm's domestic operations. Finally, we review the implications of these theories for business practice.
Foreign Direct Investment in the World Economy
When discussing foreign direct investment, it is important to distinguish between the flow of FDI and the stock of FDI. The flow of FDI refers to the amount of FDI undertaken over a given time period (normally a year). The stock of FDI refers to the total accumulated value of foreign-owned assets at a given time. We also talk of outflows of FDI, meaning the flow of FDI out of a country, and inflows of FDI, meaning the flow of FDI into a country.
The Growth of FDI
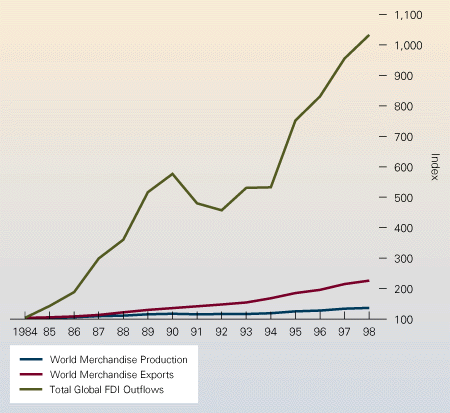
The past 20 years there have seen a marked increase in both the flow and stock of FDI in the world economy. The average yearly outflow of FDI increased from about $25 billion in 1975 to a record $430 billion in 1998 (see Figure 6.1).1 The flow of FDI not only accelerated during the 1980s and 1990s, but it also accelerated faster than the growth in world trade. Between 1984 and 1998, the total flow of FDI from all countries increased by over 900 percent, while world trade grew by 121 percent, and world output by 34 percent (see Figure 6.2).2 As a result of the strong FDI flow, by 1998 the global stock of FDI exceeded $4.0 trillion. In total, 45,000 parent companies had
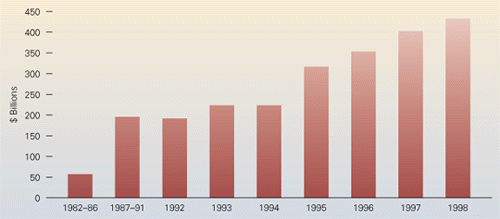
Figure 6.1
FDI Outflows 1982 - 1998 ($ billions)1
1Note: 1998 data based on preliminary estimates.
Source: United Nations, World Investment report, 1998 (New York and Geneva: United Nations, 1997).
Figure 6.2
Growth of FDI, World Trade, and World Output 1984 - 1998 (Index = 100 in 1984)1
1Note: 1998 data based on preliminary estimates
Source: World Trade Organization, Annual Report, 1998 (Geneva: WTO, 1998), and United Nations, World Investment Report, 1998 (New York and Geneva: United Nations, 1998).
280,000 affiliates in foreign markets that collectively produced an estimated $7 trillion in global sales.3
FDI is growing more rapidly than world trade and world output for several reasons. Despite the general decline in trade barriers that we have witnessed over the past 30 years, business firms still fear protectionist pressures. Business executives see FDI as a way of circumventing future trade barriers. Much of the Japanese automobile companies' investment in the United States during the 1980s and early 1990s was driven by a desire to reduce exports from Japan, thereby alleviating trade tensions between the two nations.
Second, much of the recent increase in FDI is being driven by the dramatic political and economic changes that have been occurring in many of the world's developing nations. The general shift toward democratic political institutions and free market economics that we discussed in Chapter 2 has encouraged FDI. Across much of Asia, Eastern Europe, and Latin America, economic growth, economic deregulation, privatization programs that are open to foreign investors, and the removal of many restrictions on FDI have all made these countries more attractive to foreign investors. According to the United Nations, between 1991 and 1996 over 100 countries made 599 changes in legislation governing FDI. Some 95 percent of these changes involved liberalizing a country's foreign investment regulations to make it easier for foreign companies to enter their markets. The desire of governments to facilitate FDI has also been reflected in a dramatic increase in the number of bilateral investment treaties designed to protect and promote investment between two countries. As of January 1, 1997, there were 1,330 such treaties in the world involving 162 countries, a threefold increase in five years.4
We saw in the opening case how Electrolux has responded to these trends by investing in Eastern Europe and Asia. The acquisition of Lehel of Hungary, for example, was the result of a privatization program that allowed foreign investors to purchase state-owned enterprises.
The globalization of the world economy, a phenomenon that we first discussed in Chapter 1, is also having a positive impact on the volume of FDI. Firms such as Electrolux now see the whole world as their market, and they are undertaking FDI in an attempt to make sure they have a significant presence in every region of the world. For reasons that we shall explore later in this book, many firms now believe it is important to have production facilities based close to their major customers. This, too, is creating pressures for greater FDI.
The Direction of FDI
Not only has there been rapid growth in the flow of FDI, but there has also been an important shift in the direction of FDI. Historically, most FDI has been directed at the developed nations of the world as firms based in advanced countries invested in the others' markets. The United States has often been the favorite target for FDI inflows. This trend continued in 1996 when $84.6 billion was invested in the country (see Figure 6.3). 5 The United States is attractive because of its large and wealthy domestic markets, its dynamic and stable economy, a favorable political environment, and the openness of the country to FDI. Investors have included firms based in the United Kingdom, Japan, Germany, Holland, and France.
While developed nations in general, and the United States in particular, still account for the largest share of FDI inflows, there has been a surge of FDI into the world's developing nations (see Figure 6.3). From 1985 to 1990, the annual inflow of FDI into developing nations averaged $27.4 billion, or 17.4 percent of the total global flow. By 1997, the inflow into developing nations had risen to $149 billion, or 37 percent of the total. The lion's share of the 1997 inflow into developing nations was targeted at the emerging economies of South, East, and Southeast Asia, which collectively accounted for $87 billion of the 1997 total. Driving much of the increase
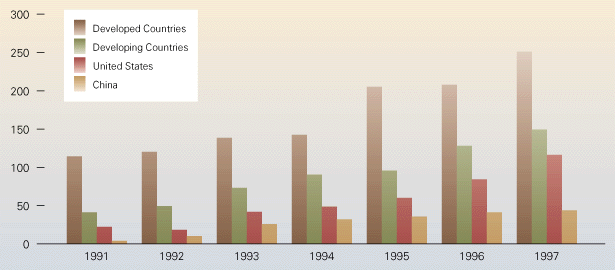
Figure 6.3
FDI Inflows, 1985 - 1987 ($ billions)
Source: United Nations, World Investment Report, 1998 (New York and Geneva: United Nations, 1998). has been the growing importance of China as a recipient of FDI (see Figure 6.3). In 1997, China received direct investments valued at $45 billion, making it the second largest recipient of FDI in the world after the United States. The reasons for the strong flow of investment into China are discussed in the accompanying Country Focus. Singapore was the second largest investment recipient in the Asian region, with inflows valued at $9 billion. After South, East, and Southeast Asia, Latin America emerged as the next most important region in the developing world for FDI inflows. In 1997, total inward investments into this region reached a record $58 billion. About $16 billion of this total was invested in Brazil, with another $12 billion targeted at Mexico. Much of this investment was a response to pro-market reforms in the region, including privatization, the liberalization of regulations governing FDI, and the growing importance of
Figure 6.4
Inward FDI Flows as a Percentage of Gross Fixed Capital Formation, 1985 - 1995.
Source: Data from United Nations, World Investment Report, 1998 (New York and Geneva: United Nations, 1997).
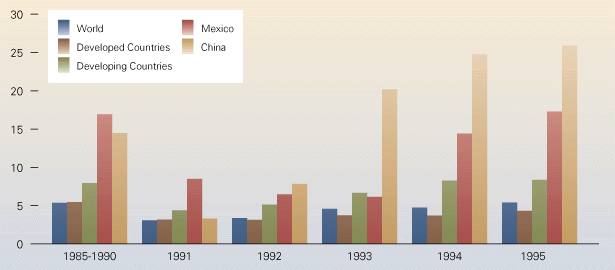
where FDI inflows accounted for 13.2 percent of all capital investment in 1995, Sweden (42.8 percent in 1995), and Australia (20 percent in 1995). But FDI inflows accounted for less than 0.1 percent of all gross fixed capital formation in the Japanese economy in 1995--a figure that reflects not only the prolonged economic recession in that country, but also the host of formal regulations and informal barriers that make it difficult for foreign companies to invest in and do business in this nation. South Korea, which historically modeled itself on Japan, also has a low level of FDI as a percentage of capital formation (1.1 percent in 1995). To the extent that capital inflows allow a country to achieve higher future growth rates, countries such as Japan and South Korea may be hurting themselves by adopting restrictive regulations with regard to FDI inflows. We shall return to this issue in the next chapter.
The Source of FDI
Since World War II, the United States has traditionally been by far the largest source country for FDI. During the late 1970s the United States was still accounting for about 47 percent of all FDI outflows from industrialized countries, while the second-place United Kingdom accounted for about 18 percent. US firms so dominated the growth of FDI in the 1960s and 70s, that the words American and multinational became almost synonymous. As a result, by 1980, 178 of the world's largest 382 multinationals were US firms, and 40 of them were British.6 As Figure 6.5 illustrates, however, during the 1985 - 90 period, the United States slipped to third place behind Japan and the United Kingdom. Since then, the United States has regained its dominant position, accounting for $116.5 billion of FDI outflows, or 29 percent of the global total, in 1997. After a surge during the 1980s, FDI by Japanese firms has slipped, accounting for only 6.4 percent of the global total in 1997, down from 21 percent in 1990.
The increase in Japanese FDI outflows during the 1980s and the subsequent stagnation during the 1990s reflect the strong Japanese economy during the 1980s and the prolonged recession that gripped the economy during the 1990s. During the 1980s, Japanese firms were making market share gains in industry after industry. This yielded strong growth in profits and cash flows. In addition, the Japanese currency increased in value against many other currencies during this period, including the US dollar. Data from J. P. Morgan suggest that an index measuring the value of the Japanese yen against 44 other currencies increased from 89.2 in January 1980 to a high of 130.4 in August 1993 (the index was set to 100 in 1990).7As the yen became more valuable, it became progressively cheaper to acquire assets in countries whose currencies were not as strong, such as the United States. Thus, the combination of strong growth in corporate profits and cash flows and a strong currency made it both easy and relatively inexpensive for Japanese firms to purchase the assets--including factories, land, office buildings, and often whole firms--in countries whose economic performance was less robust and whose currency was weaker. Also, in many countries there was an increased threat that trade barriers might be put in place to hold back the growing flood of Japanese exports (this was certainly true in the United States). This gave many Japanese firms a strong incentive to invest in production facilities overseas and serve foreign markets from those facilities, as opposed to exporting from Japan. In sum, a strong corporate performance, a strong currency, and the threat that foreign countries might erect trade barriers against Japanese exports all created a climate that helped propel Japanese FDI outflows to record levels from 1985 to 1991. The slowdown in the growth of Japanese FDI outflows since 1991 simply reflects the poor corporate performance in Japan that is the result of the country's economic malaise.
The growth of FDI outflows from the United States has been driven by a combination of favorable factors including a strong US economy, strong corporate profits and cash flow--which have given US firms the capital to invest abroad--and a relatively strong currency, particularly since 1995. Similar factors explain the continued growth of FDI outflows from the United Kingdom during the 1990s.
The other notable trend in the statistics summarized in Figure 6.5 has been the rise of FDI outflows from developing nations. These have increased from an annual average of $10.5 billion from 1985 to 1990 to a record $55 billion in 1997. The biggest investors among developing nations in 1996-97 were Hong Kong, Singapore, and South Korea. Much of the Hong Kong and Singapore investment was targeted at China and other Southeast Asian nations. While Korean firms also invested in these regions, they also targeted the United States and Europe. Such investments in 1996 propelled Daewoo of South Korea to number 52 on the list of the 100 largest multinational corporations in the world, as measured by asset value. Although the 1997/98 financial crisis in Southeast Asia caused a near-term slowdown in the investment outflow from these nations, in the long run the flow of FDI from developing nations will likely keep pace with the underlying growth in their economies.
Horizontal Foreign Direct Investment
Horizontal FDI is FDI in the same industry abroad as a firm operates in at home. We need to understand why firms go to all of the trouble of acquiring or establishing operations abroad, when the alternatives of exporting and licensing are available. Why, for example, did Electrolux choose FDI in Hungary over exporting from an existing Western European plant or licensing a Hungarian firm to build its appliances in Hungary? Other things being equal, FDI is expensive and risky compared to exporting or licensing. FDI is expensive because a firm must bear the costs of establishing production facilities in a foreign country or of acquiring a foreign enterprise. FDI is risky because of the problems associated with doing business in another culture where the "rules of the game" may be very different. Relative to firms native to a culture, there is a greater probability that a firm undertaking FDI in a foreign culture will make costly mistakes due to ignorance. When a firm exports, it need not bear the costs of FDI, and the risks associated with selling abroad can be reduced by using a native sales agent. Similarly, when a firm licenses its know-how, it need not bear the costs or risks of FDI, since these are born by the native firm that licenses the know-how. So why do so many firms apparently prefer FDI over either exporting or licensing?
The quick answer is that other things are not equal! A number of factors can alter the relative attractiveness of exporting, licensing, and FDI. We will consider these factors: (1) transportation costs, (2) market imperfections, (3) following competitors, (4) the product life cycle, and (5) location advantages.
Transportation Costs
When transportation costs are added to production costs, it becomes unprofitable to ship some products over a large distance. This is particularly true of products that have a low value-to-weight ratio and can be produced in almost any location (e.g., cement, soft drinks, etc.). For such products, relative to either FDI or licensing, the attractiveness of exporting decreases. For products with a high value-to-weight ratio, however, transport costs are normally a very minor component of total landed cost (e.g., electronic components, personal computers, medical equipment, computer software, etc.). In such cases, transportation costs have little impact on the relative attractiveness of exporting, licensing, and FDI.
Market Imperfections (Internalization Theory)
Market imperfections provide a major explanation of why firms may prefer FDI to either exporting or licensing. Market imperfections are factors that inhibit markets from working perfectly. The market imperfections explanation of FDI is the one favored by most economists.8 In the international business literature, the marketing imperfection approach to FDI is typically referred to as internalization theory.
With regard to horizontal FDI, market imperfections arise in two circumstances: when there are impediments to the free flow of products between nations, and when there are impediments to the sale of know-how. (Licensing is a mechanism for selling know-how.) Impediments to the free flow of products between nations decrease the profitability of exporting, relative to FDI and licensing. Impediments to the sale of know-how increase the profitability of FDI relative to licensing. Thus, the market imperfections explanation predicts that FDI will be preferred whenever there are impediments that make both exporting and the sale of know-how difficult and/or expensive. We will consider each situation.