

If I wanted to test the effects of loud rock music on concentration.
Rock music is my IV. But what do I mean by “rock”? I could mean classic rock, heavy metal, hip hop, old school, classic rock, Elvis…? And what is meant by “loud” or “soft” music?
“ I’ll
crank it up until it sounds loud to me” is not scientific. “I’ll
set the volume on the stereo to 8” is better. “I’ll measure the
sound with a sound meter and report the terms in decibels” is best.
Your IV range (1-10 volume) should be large enough to show a real
difference. How will I measure the DV “concentration”? Will I
give a page of math problems? Several pages? How many do the
participants have to complete to prove that they concentrated?
I’ll
crank it up until it sounds loud to me” is not scientific. “I’ll
set the volume on the stereo to 8” is better. “I’ll measure the
sound with a sound meter and report the terms in decibels” is best.
Your IV range (1-10 volume) should be large enough to show a real
difference. How will I measure the DV “concentration”? Will I
give a page of math problems? Several pages? How many do the
participants have to complete to prove that they concentrated?
Here is another example:
Exposure to TV violence causes aggression in children.
TV violence is my IV…but how do you define violence? Could violence be different based on culture, age, or previous life experiences? We could define violence as “physical contact that causes harm to another person” or “an illegal act taken place” or “if hitting occurs 2 times or 10 times.” How much exposure are you talking about? 1 hour? 10 hours per week?
How old are the children? How do we define the DV--children’s aggression? We could make a 7-point scale that includes verbal abuse-kicking-hitting-screaming. We could tell a story and count the number of direct-attack responses the child gives. We could observe violent play (guns, knives, tanks) versus non-violent play (dolls, art, tools).
Do affectionate mothers have better marriages? (define affection, define better)
Do students learn better from popular professors? (define better, define popular)
Does student morale affect the amount of work output? (Define morale, define work output)
Sample Intro
Cognitive psychology deals with mental processes such as memory. Research indicates that human memory is not just a replica of experience, but is in fact reconstructive. Memory is now largely studied from an information-processing approach, which focuses on encoding, storage, and retrieval. These three components are involved in the process of remembering. One of the most influential theories of information processing is schema theory based on the concept of schema, a concept first used by Bartlett (1932) as part of his theory of reconstructive memory.
Schema is a concept defined as an integrated mental network of knowledge, beliefs, and expectations concerning a particular topic or aspect of the world. It is believed to affect memory processes at many levels. Bartlett developed schema theory in his book Remembering (1932). His schema theory suggests that all new information interacts with the old information represented in the schema. What we remember is influenced by our existing knowledge and experience. Our knowledge is stored in memory as a set of schema-- simplified, generalized mental representations of everything we understand by a given type of object or event, based on our past experience. According to Bartlett, we reconstruct the past by trying to fit it into our existing schemas, and the more difficult this is to do, the more likely it is that elements are forgotten or distorted. On the basis of this, it can be expected that people will remember information that is consistent with their schema and forget schema- inconsistent information.
Schema theory provides us with ready-made expectations which help to interpret the flow of information reaching the census, and help to make the world more predictable. Furthermore, schemas allow us to “fill in the gaps” when our memories are incomplete. Although Cohen (1993) criticize the schema theory on the basis that the concept of schema was too vague to be useful, schema theory has proved useful in our understanding of cognitive processing involved in remembering. Loftus and Palmer (1974) experimental work with eyewitness testimony also demonstrated that human memory can be influenced by leading questions and “reconstructed memory” to fit the schema. This can be used to say that “memory may be influenced by schema processing.”
Researchers have discussed with schemas influence information processing. One such study is by Anderson and Pitcher (1978), who found that schemas have some effect at retrieval as well as at encoding. In the same line, Brewer & Treyens (1981) tested memory for objects in a room. Participants were brought into an office room with a number of consistent and some inconsistent objects and were told to wait. After 35 seconds waiting in the office, the participants were called into another room and given the unexpected task of writing down what they could recall from the office room. The results show that schema-consistent objects were more accurately recalled then schema-inconsistent ones. This indicated that memory for the scene was apparently strongly influenced by the pre-existing office schema, and when the participants had to recall details, they supplemented with default values from this schema. We have chosen to replicate Brewer & Treyens (1981) in our research because it is relevant to investigate if schema processing is actually as consistent as they found it to be.
Due to the suggestions of Bartlett, and Brewer, and Treyens’ (1981) study, the aim of this experiment is to determine if schema processing effects memory for places such as an office room in the school like Norre Gymnasium. Our experiment will be carried out by presenting the participants with a list of mixed object normally present in office room (consistent) as well as objects not normally in an office room (inconsistent).
HO Null Hypothesis: there will be no difference in the recall of schema-consistent objects and schema- inconsistent objects.
H1 Research Hypothesis: the mean number of schema- consistent objects recalled will be higher than the mean recall of schema-inconsistent objects.
B. Method Approx. word count 400
The method section is where you describe how your study was designed and carried out.
In this section you demonstrate your understanding of the experiment as a quantitative (quantity) methodology.
Anyone should be able to replicate your study EXACTLY by the thoroughness of your description.
The section is subdivided into 3 sub-sections, each with a label:

B. Method : Design
Identify the design you have used – either independent samples or repeated measures (see next page for these).
Explain and justify why you chose the design you did (to avoid order effects, etc). Why is it the best way to conduct your study? What are the strengths and limitations of this design?
Describe the controls you have undertaken to avoid extraneous variables or confounding variables (ex: have a standard script and give the same standardized briefing).
The two groups in your experiment should be treated exactly the same--except for the IV.
All instructions to the groups should be scripted to ensure they are identical.
All other conditions should be identical as far as possible.
Note any inadvertent differences in treatment and discuss in your report.
Again, identify the independent (IV) and dependent (DV) variables (operationalized).
Document how ethical guidelines were followed. Explain how consent was obtained and how the briefing and debriefing were carried out. Remind participants that they are free to leave the experiment at any time.
Debriefing: At the end, thank all participants and inform them of their right to know the results of your experiment. This should be a script (in your appendix).
C onfounding
Variables:
onfounding
Variables:
These are hidden (lurking) factors that could skew your results and cause low internal validity in your test. Researchers must try to eliminate all confounding variables possible.
These variables could include:
Bias (either from the researcher or the participant) for example is your sample bored or concentrating? Personal experience can bias both sides.
Selection process: self-selected volunteers may be over-eager, and try to appear likeable, “normal,” and responsible. Participants who did not want to be selected may be uncooperative, defiant, or defensive.
The type of participant selected (Hell’s Grannies, inmates, Amish teens). Maturation: how mature are your participants?
The participant has practiced what you are asking (order effects). Maybe a friend told him/her what to expect and they are ready.
Participant interactions with each other or with you (threatened, flirtatious, rapport).
Hawthorne Effect (Demand Characteristics): trying to please or guess results. If you are too secretive they try to solve the puzzle; search for clues. They may read into non- verbal clues, the way you stand, your reaction to answers, or how you read a script.
Teacher in a classroom environment may be distracting. Same in office environments.
Participant health: colds, allergies, headache, etc.
Equipment malfunction.
Environment: lights, noise, distractions.
Natural occurring events: weather, time of day.
Other Distractions: participants did not eat, clothes are uncomfortable, lack of sleep, school team did/not win, pep rally day, etc.
We counter-balance these confounding variables by:
Having everything scripted so you sound the same to every participant. You can even audio or video tape your instructions (though this can feel too artificial).
Use a single-blind (participants do not know if they are in the control or experimental group) or double-blind (you as the researcher also don’t know).
Decide if you need to collect information individually or as a group.
Try to consider the same time of day for your experiment.
Be aware of non-verbal clues. Stay focused on your participant (no texting or yawning).
Admit in your discussion section that a potential confounding variable may have occurred. Don’t worry about Imperfectaphobia (the fear of not being perfect).
Standardized Briefing & Debriefing Notes
You should write a script to use in the briefing of your participants. This script should include the aim and instructions regarding the procedure of the study, as well as information about ethical issues (see the consent form).
Attach a copy of your standardized briefing notes in the appendix (at the back). By using one standardized briefing, you ensure that you control all extraneous variables that could interfere with the experiment.
Debriefing occurs after you have conducted the experiment. Standardized debriefing notes are a copy of the script that you used to debrief your participants once the experimental procedure is over.
The debriefing should include:
Thank you for participating.
The aim or purpose of the study.
What you expect to find in your study.
The results will remain confidential.
Participants can learn about the conclusions drawn from the research when you have completed your analysis of the data.
Remind participants that they have the right to withdraw their data, keeping with ethical standards.
Scoring B. Method: Design: (2 marks)
The IV and DV are accurately identified and operationalized.
The experimental design is appropriate to the aim and its use is appropriately justified.
There is clear indication and documentation about ethical guidelines were followed.
Attach a copy of the standardized debriefing notes in the appendix (at the back).
C: Method: Participants
The participants section describes the sample and how it was obtained.
A sample of 10-20 participants is sufficient. Larger samples are strongly discouraged.
Sampling procedures should be identified and justified.
The sampling method (random, opportunity, etc.) must be identified (see next page)
You must explain why the sampling method was chosen
Explain how the participants were allocated to the experimental or control group. State the number of participants in each group.
Identify the target population-- the group you are interested in and the one from which you draw your sample. It is also the one to which you will be able to generalize your results. This means that if your target population is “IB students who were non-native English-speaking students” you will be able to generalize the results only to “IB students who were non-native English-speaking.”
How many people are in your target population? “There are 1200 in the target population.”
Relevant characteristics of the sample should be identified (ex: color blindness, English proficiency, musical ability). Give an example of the group similarities (11th graders). What are the ages, grade-level, subject area and level, gender, and any other important details.
Describe the sample in terms of the number of participants, age, and gender distribution. State the age range and mean. (example: the 20 participants were evenly distributed between males and females. The mean age was 16. Because of the nature of the experiment, it was important that participants were not colorblind and that they were fluent in English).
Scoring C. Method: Participants: (2 marks)
Identify the relevant characteristics of the participants
Identify the sampling method selected and the use of this method is explained
The target population has been identified and is appropriate.
Before beginning the experiment, you may decide to eliminate participants who fail to meet your minimum requirements (English-language, not color-blind, low reading ability, etc).
Types of Sampling Methods:
Since you cannot sample the entire population, you select a representative sample from your target population (example: to study teenage drinking habits, you would study 20 teens).
Opportunity/Convenience Sampling: whoever happens to be there and agrees to participate. This can be biased based on your location and may make it difficult to generalize findings.
Self-Selected Sampling: volunteers are easy to find and highly motivated, but they may not reflect the general population, and they may display demand characteristics.
Purposive Sampling: targets a group (all teens) based on the aim of the study. This group could still have diversity (race, age, gender) but could lead to bias (all teens are…).
Cluster Sampling: random selection of just one part of the target population (ex: just call one state for a Federal election).
Snowball Sampling: word-of-mouth recruiting of friends, neighbors, and family. This method helps to reveal hidden populations (homeless)-- but can bias or skew results (friends will only ask other similar friends). Also confidentiality and anonymity are not possible.
Random Sampling: Every member of the target population has an equal chance of selection (like jury duty). It is assumed that if the group is large enough, then you will have diversity in your participants. (ex: names in a hat, sticks, cards, computer selected, etc.)
S
 tratified/Quota
Sample: draw random
participants from sub-groups to reflect the actual population (ex:
Asian students, Indian students, Af-Am students, Caucasian
students).
tratified/Quota
Sample: draw random
participants from sub-groups to reflect the actual population (ex:
Asian students, Indian students, Af-Am students, Caucasian
students).
It is also important to consider participant variability. If everyone were exactly alike, you’d only have to conduct your experiment 1x. If you are using 2 different groups (independent samples) then be sure one group isn’t great at math while one group suffers from math anxiety. Both groups should share some similar characteristics, or else there may be a sampling bias in your results. You can use random assignment to groups (flip a coin, assign numbers) or use matched group design.
Matched group design is more time consuming but is often used to eliminate participant variability between 2 groups. With time and planning you could match the 2 groups. This requires that you know the participants ahead of time.
Control Group Experimental Group
track runner (17) 1 track runner (17)
strong math student (18) strong math student (18)
IB male (17) IB male (17)
Spanish-speaking female (16) Spanish-speaking female (16)
D. Method: Materials
This section is a list of materials developed for use in the experiment. Basic materials such as tables, chairs, paper, and pencil should not be listed. This may be a bullet list of items.
Any written materials like a list of words to recall that were specially developed for this experiment should be listed. A sample copy should be in the appendix.
Standardized briefing and debriefing notes and informed consent letters should be included in an appendix.
Stopwatch and other items used in your experiment should be listed here.
Describe what is used, not how it is used.
Be sure you plan ahead for any special equipment you will need (video recorder, music system, DVD player and TV, stopwatch, etc.)
Be sure you have copies of whatever forms, scripts, or documents you will need
D. Method: Procedure
Write this section in past tense.
You must carefully and accurately describe how the experiment was carried out step-by-step. Enough detail should be provided so that another researcher could replicate the experiment. Procedures may be written either as a paragraph or in bullet point format.
Scoring D. Method: Materials & Procedure: (2 marks)
Make sure the procedural information is relevant, clearly described, and easily replicable
Necessary materials have been included and referenced in the appendices.
Ethical guidelines were followed.
If you are writing in bullet points, make sure that enough details are included for someone to replicate your procedure (I might make them do that!)
Write in chronological order. Be clear and concise.
State whether you ran your experiments in groups, pairs, or individually.
Ethical Guidelines
Ask yourself….have I considered all ethical concerns?
I have not caused any stress, anxiety, pain, or discomfort.
I have asked everyone to sign an “informed consent” BEFORE beginning my experiment.
I provided an adequate description to my participants of what they would be expected to do and what I was testing for.
I used only mild (or no) deception, and I cleared up any misinformation or mild deception during the debriefing (after the experiment).
I am careful with all data so that confidential information does not get lost, left, stolen, or discovered (laptop, lists, thumbdrives, signed forms, etc).
I keep my own thoughts and lips sealed around others (and online) for confidentiality.
I have tried to avoid all confounding variables from interfering with my research—including demand characteristics. I believe that any variables at this point are out of my control and are unlikely to alter or affect my results.
I read a statement that debriefed all participants equally and thoroughly after my experiment was over. I gave participants a chance to ask questions, and a way to contact me with further questions or concerns.
Results: Section E & F
There are 2 different sections for the results. First you must conduct your actual experiment and collect all of the data. Your raw data will go in the appendix (at the back). Your finished data and explanations will go into two sections.
E. Results: Descriptive
The results should be stated in two ways: “say it” and “show it”
A narrative (written) form--a written statement (example: “the mean number of words recalled by the experimental group (X1) was 2.5 (X1=2.5).”
A graphic form that enhances the reader’s understanding and supports the text. These are graphs that the reader should be able to understand just by looking at the graph or the table. Tables could include mean scores or frequency of behavior.
Be sure every part of your graphs are carefully labeled. There are many computer programs that will make these graphs for you (like MS Excel or PowerPoint).
The data should be reported in a way that reflects the aim of the research hypothesis (ex: you were trying to prove condition x over y, so make sure your graph shows x over y).
Raw data should not be included here, but must be in the appendix. Only summarized data should appear in the results section.
A lower-case n refers to the number of participants (n=20)
The data collected in research can represent different levels of detail (referred to as the level of measurement of the data). There are 4 levels of measurement you can use:
Nominal data: example: smokers and non-smokers; cat people versus dog people.
Simplest data to collect.
As you record data, put it into categories (yes/no) and you simply count how many fall into each category.
Nominal level provides the least amount of information of all.
Only the mode can be used as a means of central tendency.
Nominal data have fewer descriptive statistics that may be calculated.
It is not recommended to carry out research that only produces nominal data.
Ordinal data: example: track runners are ranked as number 1, 2 or 3.
Put into rank, or order from smallest to biggest, or first to last.
We cannot say anything about how much better # 1 did compared with # 2 and 3--only who came in 2nd and 3rd.
The difference between each score may not be equal.
An example could be a Likert scales (strongly agree, agree, disagree, strongly disagree).
Interval data: Peter is 179 cm tall, Pierre is 180 cm. Pierre is the tallest; Peter is the smallest
Other examples: temperature (1-100); IQ scores (100); #s recalled on a memory test
Data is measured on a scale which has precise and equal intervals.
Data at the interval level carries much more information than ordinal data.
The mean, median, and mode may be calculated for interval data.
If you rank interval data they become ordinal data.
R atio
data: example:
weight in grams is a ratio scale; 20 miles are 2x as far as 10 miles.
atio
data: example:
weight in grams is a ratio scale; 20 miles are 2x as far as 10 miles.
Ratio data have the characteristics of interval data, plus they have a true zero point (you can’t have a negative mile, or a negative weight).
There is an equal distance (intervals) between each data point.
Ratio measurements lend themselves to more effective statistical analysis.
Nearly all measures of both central tendency and dispersion can be calculated.
Measures of Central Tendency
The measure of central tendency tells you something useful about a distribution—but it only describes one aspect. You should calculate both the central tendency and dispersion (if the level of measurement of your data allows it). This depends on your data and whether you chose the mean, median, or mode.
Measures of Dispersion
In statistics, dispersion (also called variation) shows how your data is distributed (or spread out). Common measures are range and standard deviation.

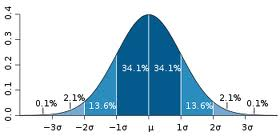
To calculate the SD:
Find the mean of the distribution.
Subtract each score from the mean.
Square each result (deviation).
Add the squared deviations together.
Divide by the total number of scores (n-1) you subtract 1 to get rid of any outliers.
This result is called the variance.
Find the square root of the variance. This is the SD.
Now you can compare the mean to the SD.
Ex: compare 3 class scores out of 100: 78, 80, 92; 2/3 of your scores are 1 SD from the mean.
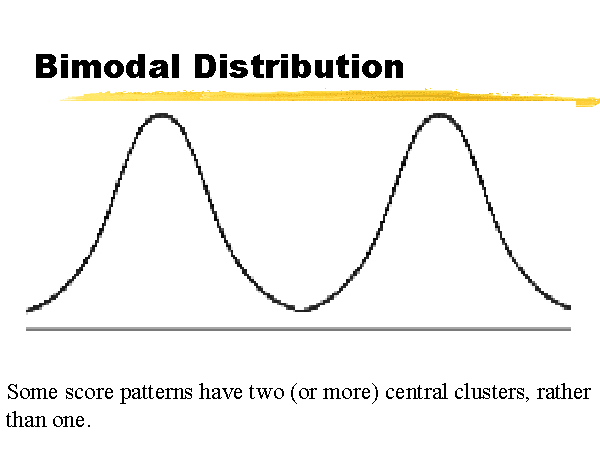
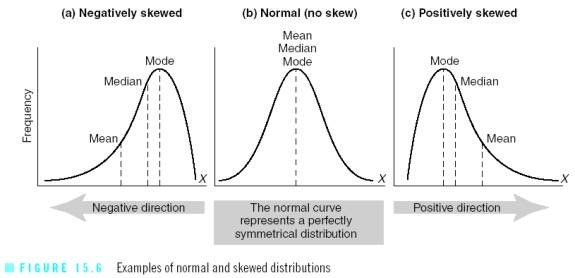
Skewed Data
Once you have drawn your range or standard deviation, you may notice that your data is skewed right or left (positive or negative). A normal range of distribution is double-tailed (2 tailed) as in the example of a SD on the previous page. A skew usually indicates that the data is single-tailed (left or right).
Your wording of your hypothesis may also determine your tail (example: changing temperature in the room will increase the time needed to complete the math test).
A negative skew means that the tail is on the left side. The bulk of responses are to the right of the mean.
A positive skew means that the tail is on the right side. The bulk of responses are to the left of the mean.
This is usually because of outliers in your data:
1 participant is much older than the average.
1 participant is much better (or worse) at the task (DV).
1 participant has an extremely high (or low) IQ.
Scoring E. Results: Descriptive: (2 marks)
Results are clearly stated.
Results accurately reflect the hypothesis of the research.
Appropriate descriptive statistics (one measure of central tendency and one measure of dispersion) are applied to the data and their use is explained.
The graph of results is accurate, clear, and directly relevant to the hypothesis of the study.
Results are presented in both words and tabular form.