

Ford Motor Co.
Ford recently had the best third quarter for total company and Automotive pre-tax profit, driven by record North American results; positive Automotive operating-related cash flow; strong liquidity of $34.4 billion.
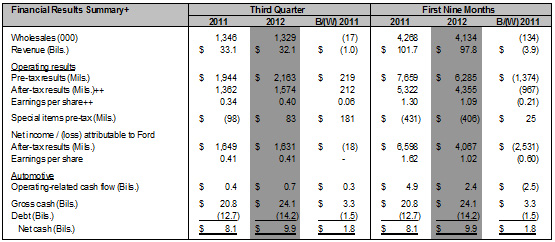
Ford North America achieved its highest quarterly profit and operating margin since at least 2000 when the company started reflecting the region as a separate business unit, with third quarter pre-tax profit of $2.3 billion and a 12 percent operating margin
Ford Credit reported a pre-tax profit of $393 million, a decrease of $188 million from third quarter 2011, in line with expectations
Ford has announced comprehensive transformation plan to restore profitability in Europe by mid-decade.
 Source: Ford Motor Corporation
Automotive operating-related cash flow was $700 million, the 10th consecutive quarter of positive performance. Ford finished the third quarter with Automotive gross cash of $24.1 billion, exceeding debt by $9.9 billion. This is a net cash improvement of $1.8 billion compared to a year ago, and an increase of $400 million from the second quarter. Automotive debt of $14.2 billion at the end of the third quarter was unchanged from the end of the second quarter. Ford completed its last drawdown of low-cost loans for advanced technologies in August, and began repayment in September.
Ford also made payments of $600 million to its worldwide funded pension plans. This included $500 million in discretionary payments to U.S. funded plans in line with the company’s previously disclosed long-term strategy to de-risk its funded pension plans. Dividends paid in the quarter totaled nearly $200 million. (Ford Motor Corporation)
The increase in total Automotive pre-tax profit and operating margin is more than explained by the record quarter in North America. This was driven primarily by higher net pricing and lower contribution costs, offset partially by higher structural costs and unfavorable exchange. Lower contribution costs reflect primarily favorable commodity hedge effects.
Ford’s planning assumptions and key metrics include the following:

Source: Ford Motor Corporation
The table below provides the trading information:
52wk Range: |
8.82 - 13.05 |
Beta |
1.53 |
Volume: |
38,411,368 |
Avg Vol (3m): |
41,392,000 |
Market Cap: |
43.77B |
52-Week Change: |
5.81% |
S&P500 52-Week Change: |
14.69% |
50-Day Moving Average: |
10.94 |
200-Day Moving Average: |
10.11 |
P/E (ttm): |
2.60 |
EPS (ttm): |
4.41 |
Div & Yield: |
0.20 (1.70%) |
Ford stocks are growing with the industry, but with slower dynamic. However, Price earnings and earnings per share look solid.
Profit Margin (ttm): |
13.35% |
Operating Margin (ttm): |
5.15% |
Return on Assets (ttm): |
2.46% |
Return on Equity (ttm): |
140.16% |
Qtrly Revenue Growth (yoy): |
-2.60% |
Gross Profit (ttm): |
22.92B |
Qtrly Earnings Growth (yoy): |
-1.10% |
Total Debt/Equity (mrq): |
525.73 |
Current Ratio (mrq): |
1.68 |
Book Value Per Share (mrq): |
4.94 |
Currency in USD
Source: finance.yahoo.com
It can be seen that Ford Motor Co has good current ratio, but stocks seems to be overvalued and the company seems to have too high debt, so it is very risky investment, however, Ford had good selling cars and sales are rising.