

1.8 Как узнать о дополнительных возможностях редактора
Если
Вы решили самостоятельно попробовать
создавать документ так, как было описано
выше, а получилось не совсем так, как
бы Вы хотели, тогда - используется
справочную систему MS Word, которая
вызывается или через F1 или через
кнопку ![]() в
верхней правой части экрана.
в
верхней правой части экрана.
Практические задания
Pdf страница
![]()
 (19)
(19)

 (20)
(20)
![]() (21)
(21)

(22)
It was stated earlier that the flash temperature calculation re-quires a foreknowledge of the heat partition function. In transient contacts, the temperature is dependent on both the heat flux dis-
tribution and the Peclet ( V i ) number. However, if the heat flux is time-independent, Eqs. (7)-(9) can be integrated with respect to time first and then take FFT of Eq. (11). This allows for the heat partition function to be evaluated only once instead of at every time step.
4 Results and Discussions
The present model is based on superposition of the flash tem-perature solutions for instantaneous movingpoint heat sources. Many classical solutions for the steady-state flash temperature are available (Carslaw and Jaeger [16]). In those solutions, all the heat generated by the friction goes into one surface. Figure 2 is a comparison of the present results with those of the classical solu-tions for a uniform rectangular heat source whose dimensions are 2 l x by 2 l y along x- and y-directions respectively. The heat source is moving at a constant velocity on a semi-infinite medium. The temperature-rise is compared along the centerline of the heat source in the direction of motion. The present solution was obtained by setting the heat partition function f ( x , y , t ) 50 in Eqs. (2) and (3) and the thermal conductivity of the surface 2 to zero. The steady-state solution is reached after a short period of time. The comparison shows a good agreement between the two solutions except for some minor differences in the region far from the heat source. These differences would be decreased when the integrating time increases and finer time steps are used.
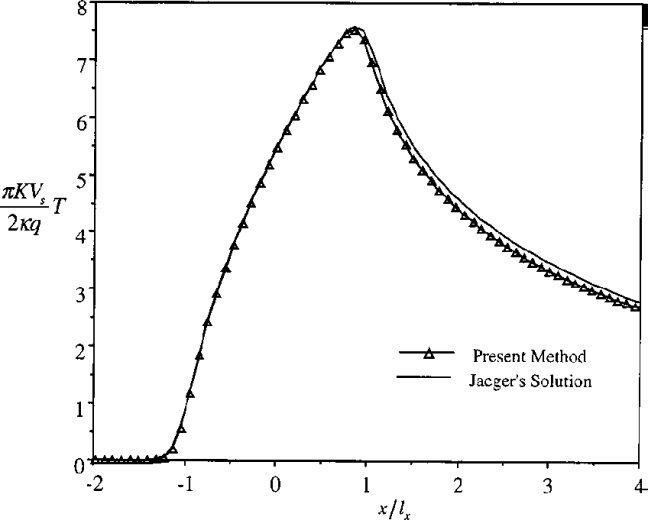
Fig. 3 Comparison of maximum temperature rise for a Hert-zian contact
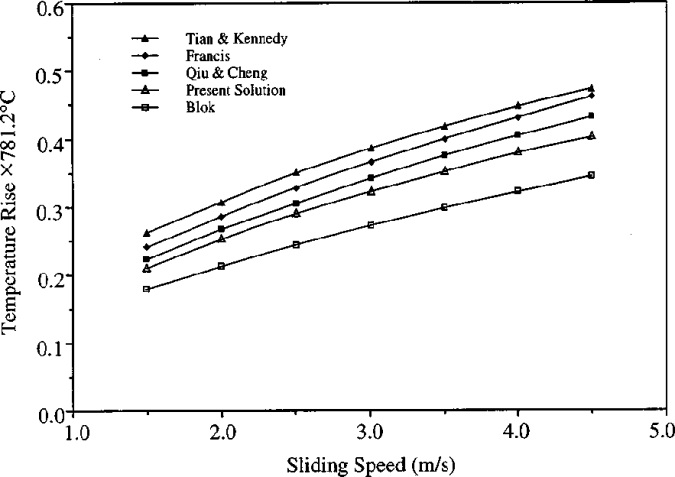
Figure 3 shows further comparisons with existing work (Blok [1]; Francis [6], Tian and Kennedy [8], Qiu and Cheng [12]). This graph was based on a figure from Qui and Cheng's paper. Their contact geometry was Hertzian with one surface moving and the other stationary. The maximum contact pressure was 1.45 GPa and the nominal Hertzian contact width was 2.26x1024 m. The present results most closely match with those of Qiu and Cheng. This is expected since both models are based on transient analysis. The larger differences with the other models may be attributed to approximations used for the heat partition function and the heat distribution in these steady-state models.
Figure 4 represents a typical dry contact pressure profile of a transversely rough sphere on a flat. The pressure solution was calculated based on a contact simulation technique developed by Ren and Lee [17]. It was assumed that the frictional shearing of the asperity contacts is the only source for the heat energy. Fig-ures 5(a-c) show a transient development of the temperature pro-file at various stages of time during simulation. The contact sur-faces were moving at velocities 2.5 m/s and 1.0 m/s in same direction. Figures 5(a), 5(b), and 5(c) represent the temperature distributions after 10, 50, and 200 time steps. The temperature profiles appear surprisingly gradual although their pressure profile had extremely sharp peaks. This is an indication of significant cross-heating activity between the asperities. Just as it is expected, an examination of the partition function showed a greater rate of heat dissipating through the faster moving surface.
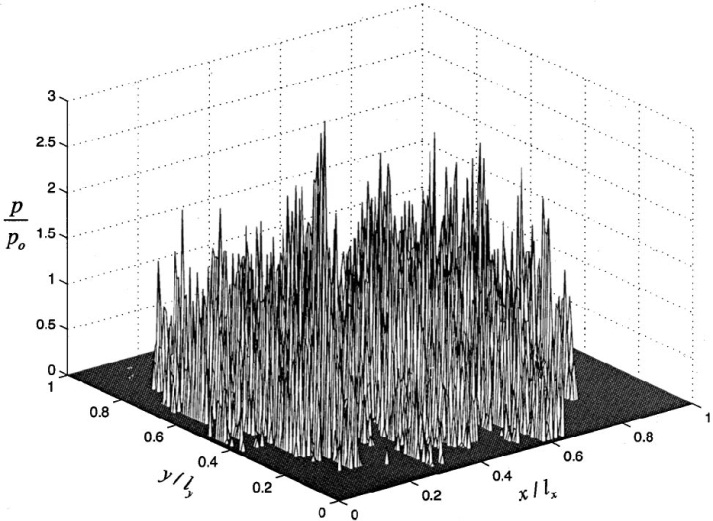
Fig. 2 Comparison of the temperature solutions for a moving
uniform rectangular heat source on a semi-infinite medium.
The solution is plotted at the centerline along the sliding direction (Vslx/4k=7.56).
Journal of Tribology
Fig. 4 Contact pressure distribution for a transversely rough surface
July 2000, Vol.122/521 JULY 2000, Vol. 122 /
Downloaded 28 Oct 2007 to 129.5.32.121. Redistribution subject to ASME license or copyright, see http ://www.asme.org /terms/Terms_Use
Произвольный рисунок
|
|
|
|
|
|
|
|
|
|
|
|
|
|
|
|
1
Вывод
Я научился пользоваться основными функциями MS WORD 2007