

Приложения:
Приложение 1.
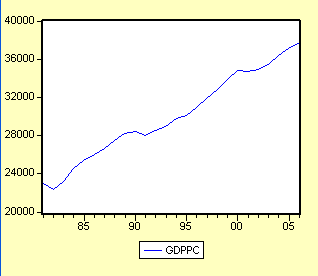
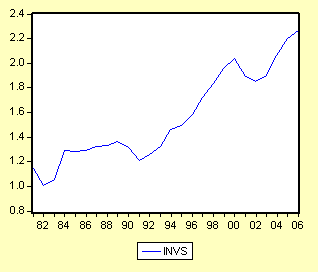
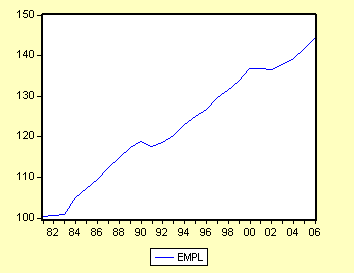
Графики временных рядов
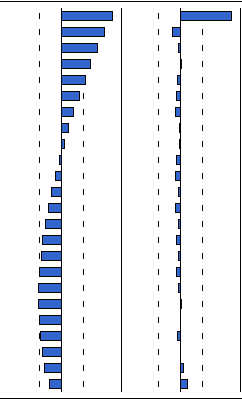
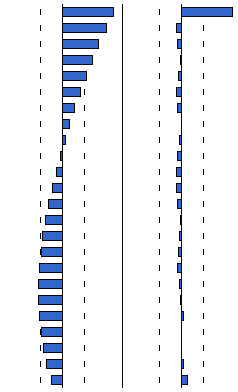
Приложение 2.
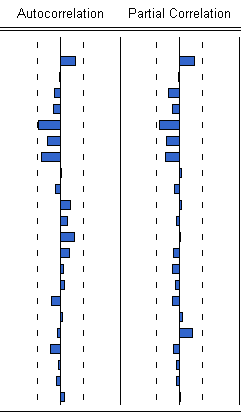
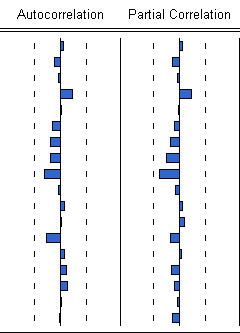
Коррелограммы временных рядов
GDPPC
INVS
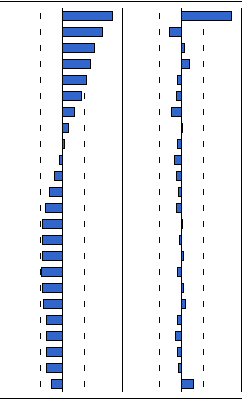
Приложение 2.
EMPL
ADF-тесты временных рядов Приложение 3.
ADF Test Statistic |
-4.629466 |
1% Critical Value* |
-3.7343 |
|
|
|
5% Critical Value |
-2.9907 |
|
|
|
10% Critical Value |
-2.6348 |
|
|
|
|
|
|
|
|
|
|
|
Augmented Dickey-Fuller Test Equation |
||||
Dependent Variable: D(GDPPC,2) |
||||
Method: Least Squares |
||||
Date: 12/14/08 Time: 18:17 |
||||
Sample(adjusted): 1984 2007 |
||||
Included observations: 24 after adjusting endpoints |
||||
Variable |
Coefficient |
Std. Error |
t-Statistic |
Prob. |
D(GDPPC(-1)) |
-0.791537 |
0.170978 |
-4.629466 |
0.0001 |
C |
519.7937 |
127.9033 |
4.063959 |
0.0005 |
ADF Test Statistic |
-4.098671 |
1% Critical Value* |
-3.7343 |
|
|
|
5% Critical Value |
-2.9907 |
|
|
|
10% Critical Value |
-2.6348 |
|
|
|
|
|
|
|
|
|
|
|
Augmented Dickey-Fuller Test Equation |
||||
Dependent Variable: D(INVS,2) |
||||
Method: Least Squares |
||||
Date: 12/14/08 Time: 18:19 |
||||
Sample(adjusted): 1984 2007 |
||||
Included observations: 24 after adjusting endpoints |
||||
Variable |
Coefficient |
Std. Error |
t-Statistic |
Prob. |
D(INVS(-1)) |
-0.766706 |
0.187062 |
-4.098671 |
0.0005 |
C |
0.042518 |
0.019316 |
2.201170 |
0.0385 |
ADF Test Statistic |
-3.729471 |
1% Critical Value* |
-3.7343 |
|
|
|
5% Critical Value |
-2.9907 |
|
|
|
10% Critical Value |
-2.6348 |
|
|
|
|
|
|
|
|
|
|
|
Augmented Dickey-Fuller Test Equation |
||||
Dependent Variable: D(EMPL,2) |
||||
Method: Least Squares |
||||
Date: 12/14/08 Time: 18:20 |
||||
Sample(adjusted): 1984 2007 |
||||
Included observations: 24 after adjusting endpoints |
||||
Variable |
Coefficient |
Std. Error |
t-Statistic |
Prob. |
D(EMPL(-1)) |
-0.748384 |
0.200668 |
-3.729471 |
0.0012 |
C |
1.395677 |
0.424588 |
3.287132 |
0.0034 |
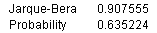
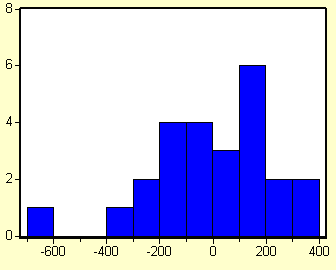
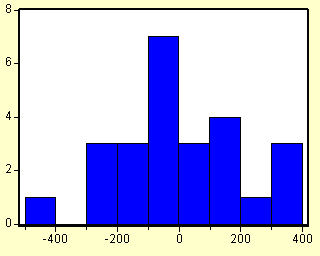
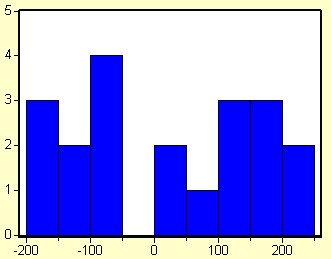
График и коррелограмма остатков модели (1) Приложение 4.
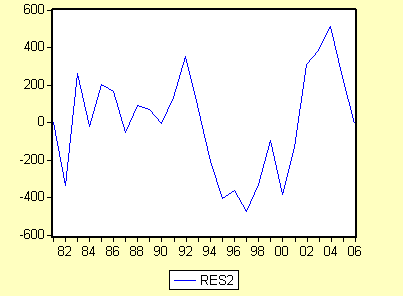
ADF-тест остатков Приложение 4.
ADF Test Statistic |
-2.521814 |
1% Critical Value* |
-2.6603 |
|
|
|
5% Critical Value |
-1.9552 |
|
|
|
10% Critical Value |
-1.6228 |
|
*MacKinnon critical values for rejection of hypothesis of a unit root. |
||||
|
|
|
|
|
|
|
|
|
|
Augmented Dickey-Fuller Test Equation |
||||
Dependent Variable: D(RES2) |
||||
Method: Least Squares |
||||
Date: 12/14/08 Time: 18:33 |
||||
Sample(adjusted): 1983 2007 |
||||
Included observations: 25 after adjusting endpoints |
||||
Variable |
Coefficient |
Std. Error |
t-Statistic |
Prob. |
RES2(-1) |
-0.418953 |
0.166131 |
-2.521814 |
0.0187 |
R-squared |
0.209474 |
Mean dependent var |
-0.195735 |
|
Adjusted R-squared |
0.209474 |
S.D. dependent var |
251.8518 |
|
S.E. of regression |
223.9253 |
Akaike info criterion |
13.69968 |
|
Sum squared resid |
1203421. |
Schwarz criterion |
13.74844 |
|
Log likelihood |
-170.2460 |
Durbin-Watson stat |
1.886763 |
|
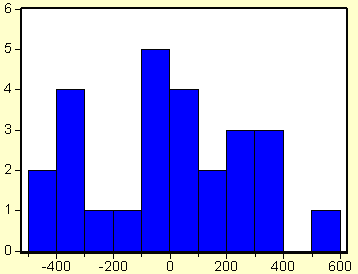
Тест Жака-Бера на нормальность распределения остатков
Тест Бреуша-Годфри модели (2) Приложение 5.
Breusch-Godfrey Serial Correlation LM Test: |
||||
F-statistic |
0.485123 |
Probability |
0.623041 |
|
Obs*R-squared |
1.214615 |
Probability |
0.544816 |
|
|
|
|
|
|
Test Equation: |
||||
Dependent Variable: RESID |
||||
Method: Least Squares |
||||
Date: 12/14/08 Time: 18:45 |
||||
Presample missing value lagged residuals set to zero. |
||||
Variable |
Coefficient |
Std. Error |
t-Statistic |
Prob. |
C |
-35.42629 |
1489.579 |
-0.023783 |
0.9813 |
INVS |
-71.95994 |
452.5340 |
-0.159016 |
0.8753 |
EMPL |
-0.167586 |
37.89840 |
-0.004422 |
0.9965 |
GDPPC(-1) |
0.005666 |
0.111088 |
0.051002 |
0.9599 |
RESID(-1) |
0.215085 |
0.231775 |
0.927992 |
0.3651 |
RESID(-2) |
-0.120008 |
0.238678 |
-0.502805 |
0.6209 |
R-squared |
0.048585 |
Mean dependent var |
2.11E-12 |
|
Adjusted R-squared |
-0.201788 |
S.D. dependent var |
227.3390 |
|
S.E. of regression |
249.2229 |
Akaike info criterion |
14.08014 |
|
Sum squared resid |
1180129. |
Schwarz criterion |
14.37267 |
|
Log likelihood |
-170.0017 |
F-statistic |
0.194049 |
|
Durbin-Watson stat |
1.711198 |
Prob(F-statistic) |
0.961055 |
|
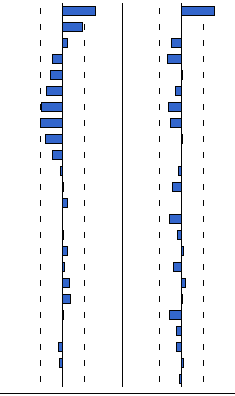
Анализ остатков модели (2) Приложение 6.
![]()
ADF Test Statistic |
-4.830056 |
1% Critical Value* |
-2.6649 |
|
|
|
5% Critical Value |
-1.9559 |
|
|
|
10% Critical Value |
-1.6231 |
|
Dependent Variable: D(RES4) |
||||
Method: Least Squares |
||||
Sample(adjusted): 1983 2006 |
||||
Included observations: 24 after adjusting endpoints |
||||
Variable |
Coefficient |
Std. Error |
t-Statistic |
Prob. |
RES4(-1) |
-0.811918 |
0.168097 |
-4.830056 |
0.0001 |
R-squared |
0.499948 |
Mean dependent var |
21.99857 |
|
Adjusted R-squared |
0.499948 |
S.D. dependent var |
263.6220 |
|
S.E. of regression |
186.4186 |
Akaike info criterion |
13.33464 |
|
Sum squared resid |
799293.5 |
Schwarz criterion |
13.38373 |
|
Log likelihood |
-159.0157 |
Durbin-Watson stat |
1.247312 |
|
Анализ остатков модели (3) Приложение 7.
![]()
ADF Test Statistic |
-5.359425 |
1% Critical Value* |
-2.6649 |
|
|
|
5% Critical Value |
-1.9559 |
|
|
|
10% Critical Value |
-1.6231 |
|
Augmented Dickey-Fuller Test Equation |
||||
Dependent Variable: D(RES3) |
||||
Sample(adjusted): 1983 2006 |
||||
Included observations: 24 after adjusting endpoints |
||||
Variable |
Coefficient |
Std. Error |
t-Statistic |
Prob. |
RES3(-1) |
-1.002079 |
0.186975 |
-5.359425 |
0.0000 |
R-squared |
0.554108 |
Mean dependent var |
13.57571 |
|
Adjusted R-squared |
0.554108 |
S.D. dependent var |
264.7947 |
|
S.E. of regression |
176.8171 |
Akaike info criterion |
13.22888 |
|
Sum squared resid |
719078.7 |
Schwarz criterion |
13.27797 |
|
Log likelihood |
-157.7466 |
Durbin-Watson stat |
1.415053 |
|
|
|
|
|
|
Анализ остатков модели (4). ЕСМ Приложение 8.
![]()
ADF Test Statistic |
-4.206456 |
1% Critical Value* |
-2.6968 |
|
|
|
5% Critical Value |
-1.9602 |
|
|
|
10% Critical Value |
-1.6251 |
|
Dependent Variable: D(RES7ECM) |
||||
Variable |
Coefficient |
Std. Error |
t-Statistic |
Prob. |
RES7ECM(-1) |
-0.937680 |
0.222914 |
-4.206456 |
0.0005 |
R-squared |
0.495044 |
Mean dependent var |
-6.546956 |
|
Adjusted R-squared |
0.495044 |
S.D. dependent var |
184.0428 |
|
S.E. of regression |
130.7813 |
Akaike info criterion |
12.63613 |
|
Sum squared resid |
307867.4 |
Schwarz criterion |
12.68583 |
|
Log likelihood |
-119.0432 |
Durbin-Watson stat |
2.093274 |
|
Статистические данные Приложение 9.
Year |
GDPPC |
INVS |
EMPL |
1982 |
23015 |
1.148986821 |
100.4 |
1982 |
22355 |
1.0036528425 |
100.529 |
1983 |
23154 |
1.053834625 |
100.822 |
1984 |
24601 |
1.293293456 |
105.003 |
1985 |
25391 |
1.2838187625 |
107.154 |
1986 |
26034 |
1.29087047625 |
109.601 |
1987 |
26673 |
1.324147725 |
112.439 |
1988 |
27524 |
1.3313362425 |
114.974 |
1989 |
28232 |
1.365422212 |
117.327 |
1990 |
28444 |
1.3196578885 |
118.796 |
1991 |
28021 |
1.21170459125 |
117.713 |
1992 |
28571 |
1.25932309875 |
118.488 |
1993 |
28955 |
1.326499665 |
120.259 |
1994 |
29755 |
1.4606892495 |
123.071 |
1995 |
30142 |
1.49469937 |
124.908 |
1996 |
30895 |
1.582491 |
126.72 |
1997 |
31901 |
1.72085602 |
129.572 |
1998 |
32848 |
1.836223525 |
131.476 |
1999 |
33921 |
1.954112019 |
133.501 |
2000 |
34773 |
2.03996221 |
136.901 |
2001 |
34673 |
1.892872597 |
136.939 |
2002 |
34879 |
1.8489884 |
136.481 |
2003 |
35417 |
1.89849273 |
137.729 |
2004 |
36371 |
2.06585954475 |
139.242 |
2005 |
37094 |
2.19746042 |
141.716 |
2007 |
37765 |
2.2686885925 |
144.421 |