

www.ti.com
Application Code Tuning (ACT)
The DSP/BIOS real-time analysis tools also can act as the software counterpart of the hardware logic analyzer. The embedded DSP/BIOS kernel and host analysis tools combine to form a new set of manufacturing test and field diagnostic tools. These tools are capable of interacting with application programs in operative production systems through the existing JTAG infrastructure.
The overhead cost of using DSP/BIOS is minimal, therefore instrumentation can be left in to enable field diagnostics, so that developers can capture and analyze the actual data that causes failures.
6.1.5Code Coverage and Multi-Event Profiler Tool
The Code Coverage and Multi-event Profiler tool provides two distinct capabilities:
∙Code coverage provides visualization of source line coverage to help developers to construct tests to ensure adequate code coverage.
∙Multi-event profiling provides function profile data collected over multiple events of interest – all in a single simulation run of the application. Events include CPU cycles, instructions executed, pipeline stalls, cache hits, misses and so on. This tool helps identify possible factors affecting performance.
See the Code Coverage and Multi-event Profiler User’s Guide (SPRU624) for further details.
6.2Application Code Tuning (ACT)
The tuning process begins where the analysis stage ends. When application code analysis is complete, the DSP developer should have identified inefficient code. The tuning process consists of determining whether inefficient code can be improved, setting efficiency objectives, and attempting to meet those goals by modifying code. Code Composer Studio links several tools together into an organized method of tuning, as well as providing a single point for analyzing tuning progress.
6.2.1Tuning Dashboard
The Dashboard is a central focal point for the tuning process. It displays buildand run-time profile data suggestions for which tuning tool to use, and it can launch each of the tools. The Dashboard is the main interface during the tuning phase of the development cycle.
6.2.1.1Advice Window
The Advice window is a component of the Dashboard that displays tuning information. It guides you through the tuning process, explaining and detailing the appropriate steps, and displaying helpful information, links to other tools and documentation, and important messages.
The Advice window should be consulted when first using a tool, or to determine the appropriate action to take at any point in the tuning procedure.
Code Composer Studio IDE initially starts in the Debug layout. To open the Advice window, switch to the Tuning layout by clicking the tuning fork icon on the toolbar. Alternatively, you can choose Advice from the Profile→Tuning menu item. The Advice window will open at the left of the Code Composer Studio IDE screen and display the Welcome information.
SPRU509F –May 2005 |
Analyze/Tune |
81 |
www.ti.com
Application Code Tuning (ACT)
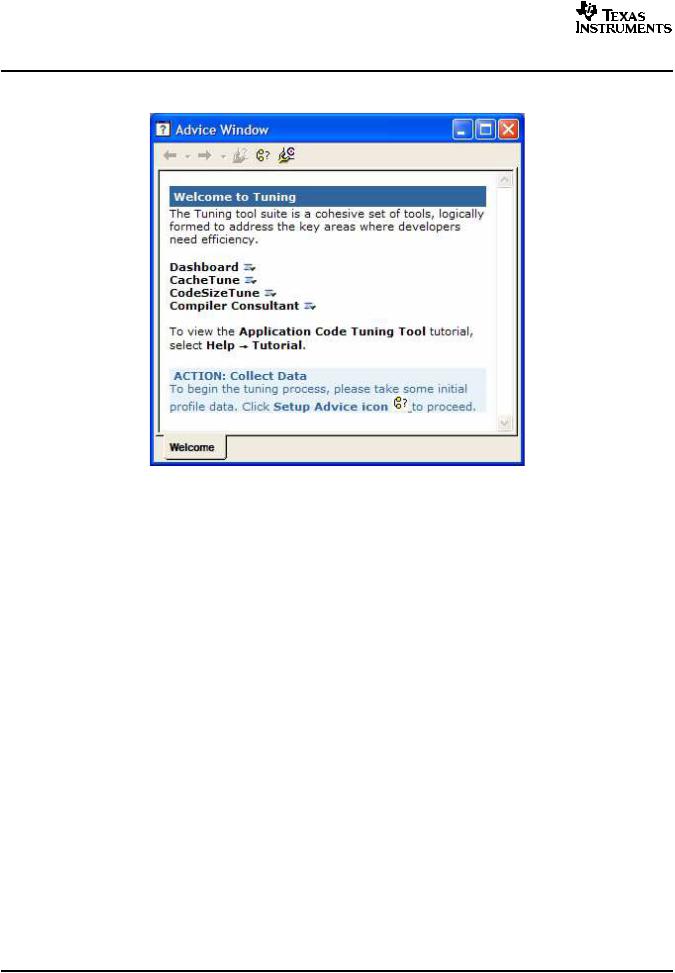
Figure 6-5. Tuning Dashboard Advice Window
At the top of the Advice Window there is a toolbar with buttons for Internet-style navigation of advice pages as well as buttons for opening the main advice pages. Click on the arrows in the toolbar to navigate back and forth through the history of advice pages for that tab. There are one or more tabs below the center pane. These tabs display different advice pages, allowing you to carry out more than one task at once. Click on the tabs at the bottom of the Advice Window to switch between open pages. To close the active tab, right-click on the Advice Window and choose Close Active Tab from the context menu.
The Welcome advice page contains links to descriptions of each of the major tuning tools. At the bottom of the Welcome advice page, there is a blue box containing suggestions for the next step in the tuning process. These blue Action boxes are found throughout the Advice Window pages.
When navigating through the Advice Window pages, red warning messages may appear. These messages serve as helpful reminders and contain valuable solutions for various problems.
When you have launched a tool, such as CodeSizeTune, an advice tab for that tool appears at the bottom of the Advice window. The page contains information about the tool, including its function, use, and how to apply the tool for optimum tuning efficiency.
6.2.1.2Profile Setup
As the Advice Window indicates, Code Composer Studio IDE must identify the desired code elements for tuning before beginning the process. This can be accomplished using Profile Setup. The Profile Setup window should be used at the beginning of the tuning process to specify the data to be collected and the requisite sections of code.
The Profile Setup window can be opened using the Advice Window. In the blue Action box at the bottom of the Welcome page, click the link to open the Setup Advice page. The first Action box will contain a link to open the Profile Setup window. Profile Setup can also be launched from the main menu topic Profile→Setup.
82 |
Analyze/Tune |
SPRU509F –May 2005 |
www.ti.com
Application Code Tuning (ACT)
The Activities tab displays the activity for which the profiling session will collect data for your application. The Ranges tab specifies the program ranges for which data is collected. Functions, loops, and arbitrary segments of code can be added to the Ranges tab for collection of tuning information. Use the exit points in the Control tab to notify Code Composer Studio when to stop data collection. You can also use the Control tab to isolate different sections of code by adding Halt or Resume Collection points. The Custom tab collects custom data, such as cache hits or CPU idle cycles.
6.2.1.3Goals Window
Tuning an application requires setting and reaching efficiency goals, so Code Composer Studio provides a method of recording numerical goals and tracking your progress.
The Goals Window displays a summary of application data, including values for the size of the code and number of cycles, that can be updated each time the code is run. It also compares the current data against both the last run'sdata and the defined goals.
To open the Goals Window, select Goals from the Profile→Tuning menu.
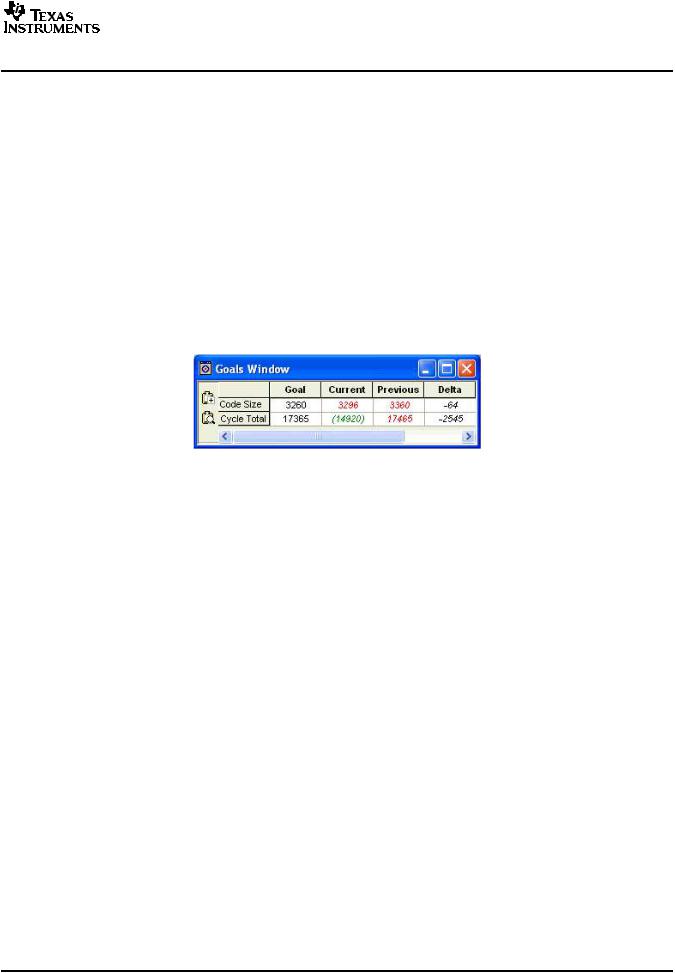
Figure 6-6. Goals Window
If an application has been loaded and profiling has been set up, the Goals Window can be populated with data simply by running the application. To record objectives for tuning, click in the Goals column, type in the goal and press Enter. If a goal has been reached, the data will be displayed in green and in parentheses. Otherwise, the data will appear in red. When the application is restarted and run, the Current values in the Goals Window will move to the Previous column and the difference will be displayed in the Delta column. The Goals Window also allows you to save or view the contents in a log at any time, by using the logging icons at the left side of the window.
6.2.1.4Profile Viewer
The Profile Viewer displays collected data during the tuning process. It consists of an information grid. Each row corresponds to the elements of code selected in the Ranges tab of the Profile Setup window. The columns store the collected data for each profiled section of code, as selected in the Activities and Custom tabs of the Profile Setup window.
The Profile Viewer provides a single location for the display of all collected information during the tuning process. Ranges can be sorted by different data values. Data sets displayed in the Profile Viewer can be saved, restored, and compared with other data sets.
The Profile Viewer pinpoints the most inefficient sections of code. For instance, to determine which function results in the most cache stalls, the cache stall data in the Profile Viewer can be sorted from largest to smallest. Sections of the function can then be profiled to determine exactly what code is generating cache stalls.
To open the Profile Viewer, select Profile→Viewer from the main menu. Alternatively, navigate to the Setup tab in the Advice Window. At the bottom of the Setup Advice page, click on the Profile Data Viewer link to display the Profile Viewer in the lower portion of the screen. If tuning has been set up using the Profile Setup window, running the application will display data in the Profile Viewer. The view can be customized by dragging and dropping rows and columns. The data can be saved and restored using the Profile Viewer buttons, and it can be sorted by double-clicking on the title of a column. In addition, several Profile Viewers can be opened simultaneously.
SPRU509F –May 2005 |
Analyze/Tune |
83 |

www.ti.com
Application Code Tuning (ACT)
6.2.2Compiler Consultant
The Compiler Consultant tool analyzes your C/C++ source code and provides you with specific advice on changes that will improve performance. The tool displays two types of information: Compile Time Loop Information and Run Time Loop Information. Compile Time Loop Information is created by the compiler. Run Time Loop Information is data gathered by profiling your application. Each time you compile or build your code, Consultant will analyze the code and create suggestions for different optimization techniques to improve code efficiency. You then have the option of implementing the advice and building the project again. You can then use the Profile Viewer window to view the results of the optimization.
When you analyze Compiler Consultant information, sort information in the Profile Viewer by the different columns, as follows:
∙If you didn’t profile, sort on Estimated Cycles Per Iteration to see which loops take the most estimated cycles in a single iteration (Compile Time Loop Information).
∙If you profiled with the activity Collect Run Time Loop Information, sort on cycle.CPU: Excl. Total to see which loops execute the most cycles, ignoring system effects.
∙If you profiled with the activity Profile all Functions and Loops for Total Cycles, sort on cycle.Total: Excl. Total to see which loops execute the most cycles, including system effects.
∙Sort on Advice Count to see which loops have the most advice.
This sorting will bring the rows to the top of the Profile Viewer that consume the most CPU cycles and which should gain the most performance benefit by tuning. You can then work on tuning one loop at a time. Double-clicking on the Advice Types entry for any loop row will bring up the full advice for that loop in the Consultant tab of the Advice window.
After you have applied the advice to fix individual loops, it is useful to hide that row in the Profile Viewer window. Hiding rows reduces the amount of information present in the Profile Viewer window. Rows can always be unhidden.
For more information, see Compiler Consultant in the online help under Application Code Tuning.
6.2.3CodeSizeTune (CST)
CodeSizeTune (CST) enables you to easily optimize the trade-off between code size and cycle count for your application. Using a variety of profiling configurations, CodeSizeTune will profile your application, collect data on individual functions, and determine the best combinations of compiler options. CST will then produce a graph of these function-specific option sets, allowing you to graphically choose the configuration that best fits your needs.
Previous users of Code Composer Studio will recognize CST as a replacement for the Profile-Based Compiler (PBC).
1.To begin, check out CodeSizeTune in the online help under Application Code Tuning to make sure your application meets the criteria for CST profiling.
2.CST will use several profile collection options sets to build and profile your application. Using the profile information it gains on function performance under several different profile collection options, CST pieces together collection options that contain compiler options at the function level. To find out more about how to build and profile, see Build and Profile under CodeSizeTune in the online help.
3.The best function-specific options sets are then plotted on a two-dimensional graph of code size versus performance, which allows you to graphically select the optimum combination of size and speed to meet your system needs. For more on selecting a desired collection options set, see the topic Select Desired Speed and Code Size under CodeSizeTune in the online help.
4.Finally, you will save your selected collection options set to the Code Composer Studio project. See Save Settings and Close under CodeSizeTune in the online help.
The Advice window guide you though the steps of the process. When you launch CodeSizeTune, the CodeSizeTune tab of the advice window will be displayed automatically. See CodeSizeTune Advice Window in the online help for more information.
84 |
Analyze/Tune |
SPRU509F –May 2005 |