

904 |
Analog Integr Circ Sig Process (2012) 73:895–907 |
|
|
Table 12 Values of the dimension d3 required to obtain the desired
QE-out
Filter-antenna module |
Required value of d3 (mm) |
At 2 GHz |
24.80 |
At 5 GHz |
10.90 |
|
|
4 Fabrication and experimental results
4.1 Fabrication process
The dimensions of the designed filter antenna-modules, referred to Fig. 4, are presented in Tables 13 and 14.
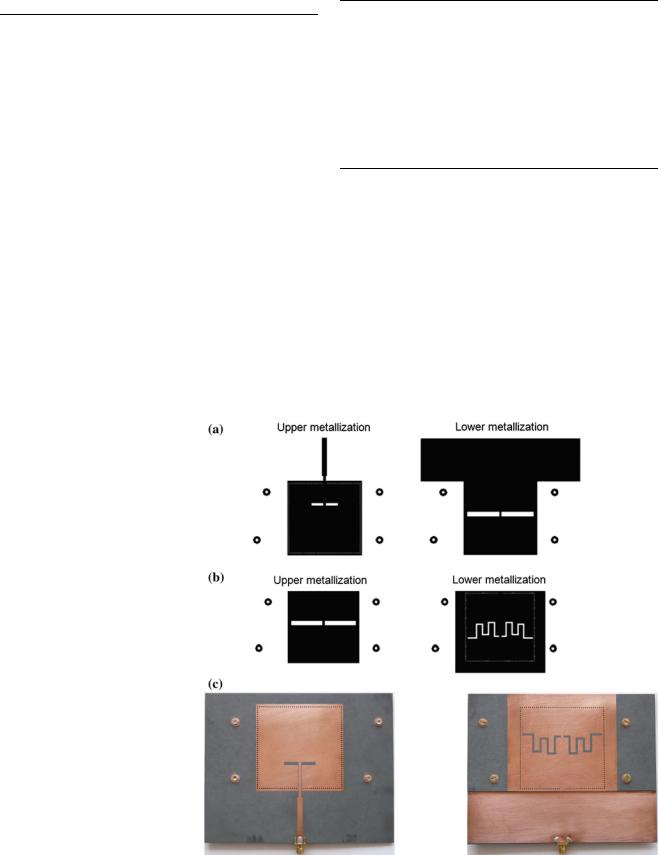
The filter-antenna module at 2 GHz was implemented by means of a conventional PCB process on two slabs of substrate Rogers RT/duroid 5880 (er = 2.2, tand = 0.0009, h = 1.57 mm) with the two metalized faces. Each slab was used to implement the input and output cavity, separately [Fig. 10(a), (b)]. Later, the two cavities were coupled, one on the top of the other, by means of four supporting screws, as shown in Fig. 10(c). An SMA connector was soldered at the input of the module.
The filter-antenna module at 5 GHz was not fabricated because the alignment of the two cavities was not possible
Fig. 10 Masks and pictures of the fabricated filter-antenna module at 2 GHz. a Masks of the input cavity. b Masks of the output cavity. c Pictures of the top and bottom view of the fabricated module
Table 13 Physical dimensions of the filter-antenna module at 2 GHz
A |
77.50 |
l1 |
28.00 |
x3 |
8.20 |
w3 |
1.80 |
D |
77.50 |
w2 |
5.00 |
x4 |
8.20 |
s3 |
2.40 |
wm |
4.82 |
l2 |
34.00 |
x5 |
10.80 |
s4 |
12.00 |
lm |
39.80 |
s1 |
2.50 |
y1 |
15.10 |
s5 |
11.00 |
wc |
2.40 |
s2 |
3.50 |
y2 |
13.30 |
d1 |
19.10 |
dc |
3.10 |
x1 |
6.20 |
y3 |
11.50 |
d2 |
28.00 |
w1 |
2.80 |
x2 |
8.20 |
y4 |
15.10 |
d3 |
24.80 |
|
|
|
|
|
|
|
|
Table 14 Physical dimensions of the filter-antenna module at 5 GHz
A |
31.48 |
l1 |
13.25 |
x3 |
2.98 |
w3 |
0.60 |
D |
31.48 |
w2 |
2.80 |
x4 |
3.55 |
s3 |
2.39 |
wm |
5.00 |
l2 |
14.15 |
x5 |
3.58 |
s4 |
5.44 |
lm |
16.80 |
s1 |
0.20 |
y1 |
5.36 |
s5 |
5.44 |
wc |
1.00 |
s2 |
1.49 |
y2 |
4.76 |
d1 |
9.09 |
dc |
1.40 |
x1 |
2.38 |
y3 |
4.16 |
d2 |
11.98 |
w1 |
1.32 |
x2 |
2.98 |
y4 |
4.76 |
d3 |
10.90 |
|
|
|
|
|
|
|
|
by using supporting screws, given the small dimensions of the circuit. A multi-layer process is required for the fabrication of this module.
123
Analog Integr Circ Sig Process (2012) 73:895–907 |
|
|
|
|
|
|
|
|
|
905 |
||||||
|
0 |
|
|
|
|
|
|
|
(a) 10 |
|
|
|
|
|
Meas. co-pol |
|
|
-2.5 |
|
|
|
|
|
|
|
|
|
|
|
|
Sim. co-pol |
||
|
|
|
|
|
|
|
|
|
0 |
|
|
|
|
|
Meas. x-pol |
|
|
|
|
|
|
|
|
|
|
|
|
|
|
|
|
Sim. x-pol |
|
|
-5 |
|
|
|
|
|
|
|
|
|
|
|
|
|
|
|
(dB) |
|
|
|
|
|
|
|
(dBi) |
-10 |
|
|
|
|
|
|
|
-7.5 |
|
|
|
|
|
|
|
|
|
|
|
|
|
|||
|
|
|
|
|
|
|
|
|
|
|
|
|
|
|
||
|
|
|
|
|
|
|
|
|
|
|
|
|
|
|
|
|
|S |
-15 |
|
|
|
|
|
|
|
Magnitude |
-20 |
|
|
|
|
|
|
|
|
|
|
|
|
|
-40 |
|
|
|
|
|
|
|||
| |
-10 |
|
|
|
|
|
|
|
|
|
|
|
|
|
|
|
11 |
|
|
|
|
|
|
|
|
|
-30 |
|
|
|
|
|
|
|
-12.5 |
|
|
|
|
|
|
|
|
|
|
|
|
|
|
|
|
|
|
|
|
|
|
|
|
|
|
|
|
|
|
|
|
|
-17.5 |
|
|
|
|
|
|
Measurement |
-50 |
|
|
|
|
|
|
|
|
-20 |
|
|
|
|
|
|
Simulation |
|
|
|
|
|
|
|
|
|
|
|
|
|
|
|
|
|
-60 |
|
|
|
|
|
|
|
|
1.6 |
1.7 |
1.8 |
1.9 |
2 |
2.1 |
2.2 |
2.3 |
2.4 |
|
|
|
|
|
|
|
|
0 |
60 |
120 |
180 |
240 |
300 |
360 |
|||||||||
|
|
|
|
|
|
|
|
|
|
|||||||
Frequency (GHz) |
θ (deg) |
|
Fig. 11 Measured and simulated S11 parameter of the fabricated filter-antenna module
4.2 Experimental results
The S11 parameter and the radiation patterns of the filterantenna module at 2 GHz were measured [9]. The S11 parameter is presented in Fig. 11.
The measured S11 parameter has the shape of a secondorder filter, with two well-marked reflection zeros and a sharp cutoff slope. However, at frequencies below the central frequency, the module is not perfectly matched to 50 X, since the magnitude of the S11 parameter is above -10 dB. It is due to a coupling problem originated by a misalignment between the two cavities. Despite this, the central frequency agrees very well with the value obtained from the electromagnetic simulation in Ansoft HFSS, which is presented in Fig. 11. Comparison between measured and simulated results is done in Table 15. The measured -10 dB FBW deviates from the simulated one, because of the mentioned coupling problem.
The radiation patterns were measured in the compact range anechoic chamber of the University of Manitoba [9]. The patterns were measured at E-plane (yz plane in Fig. 1) and H-plane (xz plane in Fig. 1), in co-polarization (co-pol) and cross-polarization (x-pol), at the central frequency, f0 = 1.94 GHz. The measured and simulated patterns agree very well, as shown in Fig. 12 and Table 16.
In Table 16, there is a difference between the measured and simulated co-pol to x-pol ratio. It is because in the E-plane, the cross polarization of the compact range in the anechoic chamber is about -30 dB at f0 = 1.94 GHz, so the measured cross polarization pattern cannot be as low as
Table 15 Measured and simulated central frequency (f0), -3 dB and -10 dB fractional bandwidth (FBW) of the filter-antenna module at 2 GHz
Parameter |
Measured value |
Simulated value |
|
|
|
f0 |
1.94 GHz |
1.93 GHz |
-10 dB FBW |
1.55 % |
3.11 % |
|
|
|
(b) 10 |
|
|
|
|
|
Meas. co-pol |
|
|
|
|
|
|
|
|
Sim. co-pol |
|
0 |
|
|
|
|
|
Meas. x-pol |
|
|
|
|
|
|
Sim. x-pol |
|
|
|
|
|
|
|
|
|
(dBi) |
-10 |
|
|
|
|
|
|
-20 |
|
|
|
|
|
|
|
Magnitude |
|
|
|
|
|
|
|
-30 |
|
|
|
|
|
|
|
-40 |
|
|
|
|
|
|
|
|
-50 |
|
|
|
|
|
|
|
-60 |
60 |
120 |
180 |
240 |
300 |
360 |
|
0 |
||||||
θ (deg)
Fig. 12 Measured and simulated radiation patterns for the filterantenna module at f0 = 1.94 GHz. a E-plane. b H-plane
Table 16 Characteristic parameters of the measured and simulated radiation patterns for the filter-antenna module at f0 = 1.94 GHz
Parameter |
Measured value |
Simulated value |
|
|
|
G (h = 180L) |
4.87 dBi |
4.46 dBi |
FTBR |
25.60 dB |
23.68 dB |
Co-pol to x-pol (h = 180L) |
22.86 dB |
59.81 dB |
|
|
|
that predicted by the simulation. In the H-plane, the x-pol nulls are well predicted, but the peak level of the measurement is about 10 dB higher than the simulated one. It could have been due to a measurement system misalignment. Oscillations in the x-pol patterns are due to reflections from the antenna cable.
The filter-antenna module at 5 GHz was simulated in Ansoft HFSS on the same substrate used for the module at 2 GHz. The simulated S11 parameter and radiation patterns are presented in Figs. 13 and 14, respectively, with the corresponding characteristic parameters in Tables 17 and 18, respectively.
The presented simulation results show that a filterantenna module has been obtained at f0 = 4.90 GHz. Therefore, the design procedure presented in this paper has been validated by the obtaining of two filter-antenna modules tuned at two different central frequencies.
123