

3 курс / Фармакология / Синтез_и_изучение_свойств_новых_материалов_с_противоопухолевой
.pdfTable 3.10. Effect of compound 1.57 on the percentage of DNA in the comet tail (%), tail length and tail moment. C is the molar concentration of the compound 1.57.
|
|
|
|
|
|
Amplitude / % |
|
|
|
||
Characteristic |
Negative |
|
|
|
|
|
|
|
|
|
|
C (H2O2) / µM |
|
|
|
C / µM |
|
|
|
||||
under study |
control |
|
|
|
|
|
|
||||
|
|
|
|
|
|
|
|
|
|||
|
|
|
|
|
|
|
|
|
|
||
|
|
100.0 |
1.0 |
10.0 |
25.0 |
50.0 |
75.0 |
100.0 |
200.0 |
||
|
|
|
|
|
|
|
|
|
|
|
|
DNA tail, % |
5.81 ± 0.91 |
81.41 |
± 7.31 |
6.65 ± 1.12 |
12.36 ± |
13.81 ± |
21.94 ± |
26.87 ± |
29.84 ± |
41.87 ± |
|
1.31 |
1.45 |
3.18 |
3.27 |
3.54 |
3.57 |
||||||
|
|
|
|
|
|||||||
|
|
|
|
|
|
|
|
|
|
|
|
Tail length |
55.13 ± 6.34 |
573.01 |
± 10.24 |
81.12 ± |
82.78 ± |
85.39 ± |
141.61 ± |
215.67 |
300.01 ± |
455.33 |
|
7.84 |
8.69 |
8.31 |
12.47 |
± 18.39 |
20.59 |
± 39.7 |
|||||
|
|
|
|
||||||||
|
|
|
|
|
|
|
|
|
|
|
|
Tail moment |
10.45 ± 3.69 |
533.11 |
± 96.19 |
5.39 ± 0.09 |
10.23 ± |
11.79 ± |
31.07 ± |
57.95 ± |
89.52 ± |
190.65 |
|
0.11 |
0.12 |
0.40 |
0.60 |
0.73 |
± 1.42 |
||||||
|
|
|
|
|
|||||||
|
|
|
|
|
|
|
|
|
|
|
|
221
222
3.5.5. Cytotoxicity of compound 1.57
After 48 h of incubation of human embryonic kidney line (HEK293) cells with compound 1.57 [112], a decrease in cell survival by almost 50 % was observed in the studied concentration range (Fig. 3.34a). At the same time, a decrease in the survival of tumour cell lines was observed: human liver adenocarcinoma (SK-HEP-1; Fig. 3.34b) and human glioblastoma (T98G; Fig. 3.34c) in the presence of compound 1.57.
(a)
|
100 |
|
|
|
|
|
|
|
|
80 |
|
|
|
|
|
|
|
/ % |
60 |
|
|
|
|
|
|
|
Survival |
|
|
|
|
|
|
|
|
40 |
|
|
|
|
|
|
|
|
|
|
|
|
|
|
|
|
|
|
20 |
|
|
|
|
|
|
|
|
0 |
|
|
|
|
|
|
|
|
0 |
2 |
10 |
20 |
50 |
100 |
150 |
200 |
|
|
|
|
C / mM |
|
|
|
|
|
|
|
|
|
(b) |
|
|
|
|
120 |
|
|
|
|
|
|
|
|
100 |
|
|
|
|
|
|
|
|
80 |
|
|
|
|
|
|
|
/ % |
|
|
|
|
|
|
|
|
Survival |
60 |
|
|
|
|
|
|
|
|
|
|
|
|
|
|
|
|
|
40 |
|
|
|
|
|
|
|
|
20 |
|
|
|
|
|
|
|
|
0 |
|
|
|
|
|
|
|
|
0 |
2 |
10 |
20 |
50 |
100 |
150 |
200 |
|
|
|
|
C / mM |
|
|
|
|
|
|
|
|
(c) |
|
|
|
|
|
120 |
|
|
|
|
|
|
|
|
100 |
|
|
|
|
|
|
|
|
80 |
|
|
|
|
|
|
|
/ % |
|
|
|
|
|
|
|
|
Survival |
60 |
|
|
|
|
|
|
|
|
|
|
|
|
|
|
|
|
|
40 |
|
|
|
|
|
|
|
|
20 |
|
|
|
|
|
|
|
|
0 |
|
|
|
|
|
|
|
|
0 |
2 |
10 |
20 |
50 |
100 |
150 |
200 |
|
|
|
|
C / μM |
|
|
|
|
Fig. 3.34. Effect of compound 1.57 on the survival of HEK293 (a), SK-HEP-1 (b), and T98G (c) cell lines. C is the molar concentration of the compound 1.57.
Table 3.11 shows a comparison of IC50 values for compound 1.57 and known cytostatics: doxorubicin and cisplatin on various cell lines. As can be seen from Table 3.11, the most pronounced cytotoxic effect of compound 1.57 is observed in relation to the A549
Рекомендовано к изучению сайтом МедУнивер - https://meduniver.com/
223
cell line. It should be noted that compound 1.57 has a wider therapeutic window than doxorubicin and cisplatin. This fact is confirmed by the IC50 value obtained for the HEK293 control line.
Table 3.11. IC50 value for compound 1.57, doxorubicin and cisplatin on human embryonic kidney cell line (HEK293), lung carcinoma (A549), human ovarian teratocarcinoma (PA- 1 B5), human glioblastoma (T98G), human liver adenocarcinoma (SK-HEP-1).
|
|
|
Cell line |
|
|
|
|
|
|
|
|
|
HEK293 |
A549 |
PA-1 B5 |
T98G |
SK-HEP-1 |
|
|
|
|
|
|
Compound 1.57 |
46.6 |
13.7 |
48.0 |
44.9 |
22.2 |
Doxorubicin |
77.2 |
46.9 |
29.1 |
2.01 |
42.3 |
Cisplatin |
0.01 [102] |
18.9 |
3.60 |
34.8 |
50.2 |
|
|
|
|
|
|
3.5.6. Mitochondrial potential
As is known from the literature, the mechanism of the cytotoxic action of doxorubicin includes at least two targets: inhibition of topoisomerase II activity, leading to suppression of DNA replication, and inhibition of complex I of the electron transport chain, which leads to a drop in mitochondrial potential and, accordingly, damage to mitochondria. It was found that in the PANC-1 cell line, doxorubicin reduces the membrane potential of mitochondria by 45 ± 5% compared with the control. In the case of compound 1.57, there was no statistically significant effect on the magnitude of the mitochondrial membrane potential in the PANC-1 cell line. Thus, based on the results of previous studies, it can be concluded that the key mechanism of the cytostatic effect of compound 1.57 is the damaging effect on the DNA molecule.
224
3.6.Study of the physicochemical properties of aqueous solutions of compound 3.6
3.6.1.Stability of compound 3.6 in aqueous solutions
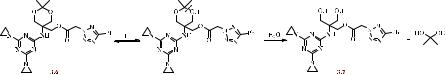
At the next stage of the work, we studied the stability of the tetrazole-containing derivative of 1,3,5-triazine, compound 3.6, in a solution of DCl in D2O (C = 10–3 M, pH 10). Significant changes were observed in the 1H NMR spectra in an acidic medium. Thus, a decrease in the intensity of the signals corresponding to the protons of CH3-groups (1.40– 1.42 ppm) was recorded, up to their complete disappearance in the spectrum. These changes in the spectral characteristics indicate hydrolysis of the dioxane ring with the formation of 2-((4,6-bis(aziridin-1-yl)-1,3,5-triazin-2-yl)amino)-3-hydroxy-2- (hydroxymethyl)propyl-2-(5-phenyl-2H-tetrazol-2-yl)acetate (compound 3.7) (Scheme 3.8). A shift of the methylene group proton signal from 5.48 ppm to 5.53 ppm was also observed [111].
Scheme 3.8
3.7.Compound 3.6 biocompatibility study
3.7.1.Haemocompatibility study
3.7.1.1.Haemolysis
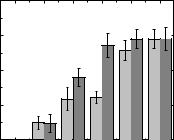
To assess the haemocompatibility of compound 3.6, its effect on spontaneous haemolysis was studied. The effect of compound 3.6 on haemolysis was determined by assessing the released haemoglobin. Fig. 3.35 shows the effect of compound 3.6
(C = 10–100 µM) on erythrocyte haemolysis after 1 and 3 h of incubation. It was shown that compound 3.6 upon incubation for 1 and 3 h caused insignificant haemolysis in the studied concentration range, while the intensity of haemolysis depended on the dose and
Рекомендовано к изучению сайтом МедУнивер - https://meduniver.com/
225
time. As mentioned earlier, substances do not have haemolytic activity if the percentage of haemolysis does not exceed 5 %. Therefore, compound 3.6 can be considered haemolytically inactive in the studied concentration range [111].
|
0.8 |
|
|
|
|
|
% |
|
|
|
|
|
|
)100 |
0.6 |
|
|
|
|
|
|
|
|
|
|
|
|
100 |
|
|
|
|
|
|
) / A |
|
|
|
|
|
|
control |
0.4 |
|
|
|
|
|
|
|
|
|
|
|
|
− A |
|
|
|
|
|
|
test |
|
|
|
|
|
|
((A |
0.2 |
|
|
|
|
|
|
0.0 |
|
|
|
|
|
|
0 |
10 |
25 |
50 |
75 |
100 |
|
|
|
|
C / mM |
|
|
Fig. 3.35. Effect of compound 3.6 on haemolysis (light grey after 1 h, dark grey after 3 h).
3.7.1.2. Platelet aggregation
Analysis of Table 3.12 shows that in an experiment on platelet aggregation using ADP as an inducer, the presence of compound 3.6 in the concentration range of 5–100 μM does not have a statistically significant effect on the functional activity of platelets [111].

226
Table 3.12. Effect of compound 3.6 on ADP-induced platelet aggregation in platelet-rich plasma.
Amplitude / %
C / µM
Control |
5 |
10 |
25 |
50 |
75 |
100 |
60.2 ± 1.1 |
54.2 ± 1.9 |
57.6 ± 3.2 |
54.75 ± 0.9 |
66.45 ± 7.8 |
63.6 ± 7.7 |
64.1 ± 4.8 |
|
|
|
|
|
|
|
3.7.1.3. Plasma coagulation haemostasis
The data presented in Table 3.13 demonstrate the presence of anticoagulant properties in compound 3.6, which is characterised by a statistically significant increase in APTT and PT in the studied concentration range.
Table 3.13. Influence of compound 3.6 on parameters of plasma-coagulation haemostasis.
C is the molar concentration of compound 3.6.
|
Control |
|
|
|
|
C / µM |
|
|
|
|
|
|
|
5 |
10 |
|
25 |
|
50 |
|
75 |
|
100 |
200 |
|
|
|
|
|
|
|
|||||||
|
|
|
|
|
|
|
|
|
|
|
|
|
APTT / s |
45.1 ± 1.5 |
42.3 ± |
49.8 |
± |
44.1 |
± |
59.2 |
± |
63.3 |
± |
68.0 ± |
80.7 ± |
|
|
0.1 |
0.3 |
|
1.6* |
0.9* |
1.6* |
1.2 |
1.2 |
|||
PT / s |
14.6 ± 1.9 |
57.4 ± |
62.2 |
± |
60.7 |
± |
60.5 |
± |
61.0 |
± |
64.2 ± |
66.2 ± |
|
|
0.7 |
1.2 |
|
1.3 |
|
1.4 |
|
1.2 |
|
1.3 |
1.2 |
TT / s |
12.5 ± 1.3 |
11.5 ± |
11.9 |
± |
11.8 |
± |
11.9 |
± |
11.4 |
± |
13.4 ± |
13.1 ± |
|
|
1.3 |
1.2 |
|
1.4 |
|
1.9 |
|
1.3 |
|
1.3 |
1.2 |
*p < 0.05 in relation to control.
Рекомендовано к изучению сайтом МедУнивер - https://meduniver.com/
227
3.7.2.Study of the binding of compound 3.6 to DNA and HSA
3.7.2.1.Study of thermodynamic parameters of DNA and HSA binding by
calorimetric method
Fig. 3.36 shows the dependence of the thermal effect of the reaction of the interaction of the tetrazole-containing derivative of 1,3,5-triazine (compound 3.6) with DNA at 298.15 K, depending on the volume of the added titrant (compound 3.6). Based on the thermodynamic model of independent binding, the parameters of the interaction of compound 3.6 with DNA were calculated. The calculated binding constant of compound 3.6 with DNA, equal to 4.08 108 M–1, indicates the formation of a stable complex. The obtained values of thermodynamic parameters: H = −17.18 kJ∙mol−1; S = 108.6
J∙(mol∙K)−1; G = −49.55 kJ∙mol−1) show that the interaction of compound 3.6 with DNA is an exothermic process. In this case, the negative value of G indicates the spontaneity of the process of formation of the complex of compound 3.6 with DNA [111].
H / mJ
0.5
0.0
-0.5
-1.0
-1.5
-2.0
0.0 |
0.1 |
0.2 |
0.3 |
0.4 |
C3.6 / C DNA
Fig. 3.36. Dependence of the thermal effect of the reaction of the interaction of compound 3.6 with DNA at 298.15 K. H is the thermal effect of the reaction, C3.6 /
CDNA is the concentration ratio of compound 3.6 and DNA.
228
3.7.2.2. Study of thermodynamic parameters of DNA binding by spectrophotometric
method
It was previously shown that one of the possible mechanisms of the antitumour effect of the 1,3,5-triazine derivative, compound 1.57, is due to binding to the DNA molecule, leading to its damage [98].
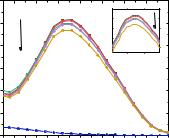
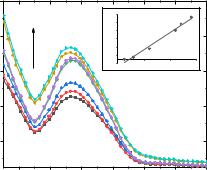
Fig. 3.37 shows the absorption spectra of DNA in physiological saline (0.9 % NaCl) at a constant DNA concentration (C = 6.1 μM) and various concentrations of compound
3.6. It was found that with an increase in the concentration of compound 3.6, a hypochromic effect is observed in the UV spectra, indicating that compound 3.6 interacts with DNA. UV spectra of solutions with different concentrations of DNA (2.3, 4.9, 8.3, 12.0, 13.0 and 13.9 μM) were also obtained in the presence of compound 3.6 (C = 2.34
μM; Fig 3.38).
|
1.2 |
|
|
|
|
|
|
|
|
|
|
|
|
|
1,0 |
|
|
|
1.0 |
|
|
|
A / a.u. |
|
|
|
|
|
|
|
|
|
|
|
|
|
|
|
|
|
|
0,8 |
|
|
|
0.8 |
|
|
|
|
|
|
|
/ a.u. |
|
|
|
|
|
|
l A/ nm 260 |
|
0.6 |
|
|
|
|
|
|
|
|
A |
|
|
|
|
|
|
|
|
|
0.4 |
|
|
|
|
|
|
|
|
0.2 |
|
|
|
|
|
|
|
|
0.0 |
|
|
|
|
|
|
|
|
230 |
240 |
250 |
260 |
270 |
280 |
290 |
300 |
|
|
|
|
l / nm |
|
|
|
|
Fig. 3.37. Absorption spectra of DNA solutions (C = 6.1 μM) depending on the concentration of compound 3.6 (C = 3.89–12.3 μM).
Рекомендовано к изучению сайтом МедУнивер - https://meduniver.com/
|
|
|
|
229 |
|
|
|
|
|
|
0.5 |
|
|
|
|
|
|
|
|
|
|
|
|
Чcm |
28 |
|
y = 2.1274x - 6.276 |
|
|
|
|
|
|
|
|
|
|
||
|
|
|
|
2 |
|
|
R² = 0.9863 |
|
|
|
|
|
|
M |
23 |
|
|
|
|
|
|
|
|
|
|
|
|
||
|
|
|
|
, |
|
|
|
|
|
|
|
|
|
10 |
|
|
|
|
|
|
|
|
|
10 |
18 |
|
|
|
|
|
0.4 |
|
|
)}Ч |
|
|
|
|
|
|
|
|
f |
13 |
|
|
|
|
|
|
|
|
|
− |
|
|
|
|
|
|
|
|
|
a |
|
|
|
|
|
|
|
|
|
|
8 |
|
|
|
|
|
|
|
|
{[DNA]/( |
|
|
|
|
|
|
|
|
|
3 |
|
|
|
|
|
|
|
|
|
-2 |
1 |
6 |
11 |
16 |
|
|
|
|
|
|
|||||
A / a.u. |
|
|
|
|
|
|
[DNA] / mM |
|
|
0.3 |
|
|
|
|
|
|
|
|
|
|
|
|
|
|
|
|
|
|
|
|
0.2 |
|
|
|
|
|
|
|
|
|
0.1 |
|
|
|
|
|
|
|
|
|
220 |
240 |
260 |
280 |
300 |
320 |
340 |
||
|
|
|
|
l / nm |
|
|
|
|
|
Fig. 3.38. Absorption spectra of DNA solutions (C = 2.63–13.9 μM) at a constant concentration of compound 3.6 (C = 2.34 μM), as well as dependence in coordinates [DNA] / (εa − εf) vs [DNA] (R2 = 0,986).
As shown in Fig. 3.39, the dependence in coordinates [DNA] / (εa − εf) on [DNA] is linear. The obtained value of the binding constant (Ka = 9.65 108 M–1) indicates the formation of a strong complex of compound 3.6 with DNA [5].
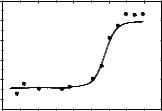
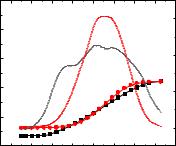
An increase in temperature has a significant effect on the stability of the doublestranded structure of DNA, causing the breaking of hydrogen bonds between pairs of nitrogenous bases and the formation of single-stranded structures. This process is called DNA melting [112]. The study of the melting point of DNA by UV spectrophotometry in the presence of compound 3.6 showed that compound 3.6 had practically no effect on the melting point of DNA: the melting point of DNA changed from 64.5 °C to 65.1 °C in the presence of compound 3.6 (ΔTm = 0.6 °C; Fig. 3.39). This indicates that compound 3.6 has practically no effect on the stability of the double-stranded DNA structure.
230
1.25 |
|
|
|
|
|
|
|
0.006 |
|
|
|
|
|
|
|
|
|
1.20 |
|
|
|
|
|
|
|
|
|
|
|
|
|
|
|
|
0.004 |
1.15 |
|
|
|
|
|
|
|
/ Ad |
A |
|
|
|
|
|
|
|
|
|
|
|
|
|
|
|
|
td |
1.10 |
|
|
|
|
|
|
|
0.002 |
1.05 |
|
|
|
|
|
|
|
|
|
|
|
|
|
|
|
|
0.000 |
1.00 |
|
|
|
|
|
|
|
|
20 |
30 |
40 |
50 |
60 |
70 |
80 |
90 |
100 |
|
|
|
|
t° / °C |
|
|
|
|
Fig. 3.39. Melting curves of DNA (C = 6.1 μM) in the absence and presence of compound 3.6 at a ratio of [compound 3.6] / [DNA] = 1.5.
The CD spectrum of a DNA solution consists of a positive band at 275 nm, due to the stacking interaction of nucleotides within one strand of DNA, and a negative band at 246 nm, associated with the chirality of the right-handed helix of the B-form DNA [101]. The CD spectroscopy method can be used to determine the types of interactions of various ligands with DNA. The CD spectra of the solutions were obtained at a constant DNA concentration (C = 6.1 μM) and at various concentrations of compound 3.6 (3.9, 6.1, 8.1, and 12.3 μM). As can be seen from Fig. 3.40, an increase in the concentration of compound
3.6 in solution leads to a decrease in the absorption intensity of the positive band and a slight decrease in the absorption intensity of the negative band. The observed changes in the CD spectra may indicate that the tetrazole-containing derivative of 1,3,5-triazine (3.6) is capable of disrupting stacking interactions between nucleotides in the DNA duplex [103].
Рекомендовано к изучению сайтом МедУнивер - https://meduniver.com/