

Добавил:
homeworkwizard
Опубликованный материал нарушает ваши авторские права? Сообщите нам.
Вуз:
Предмет:
Файл:The laboratory work 14
.docxThe laboratory work 14
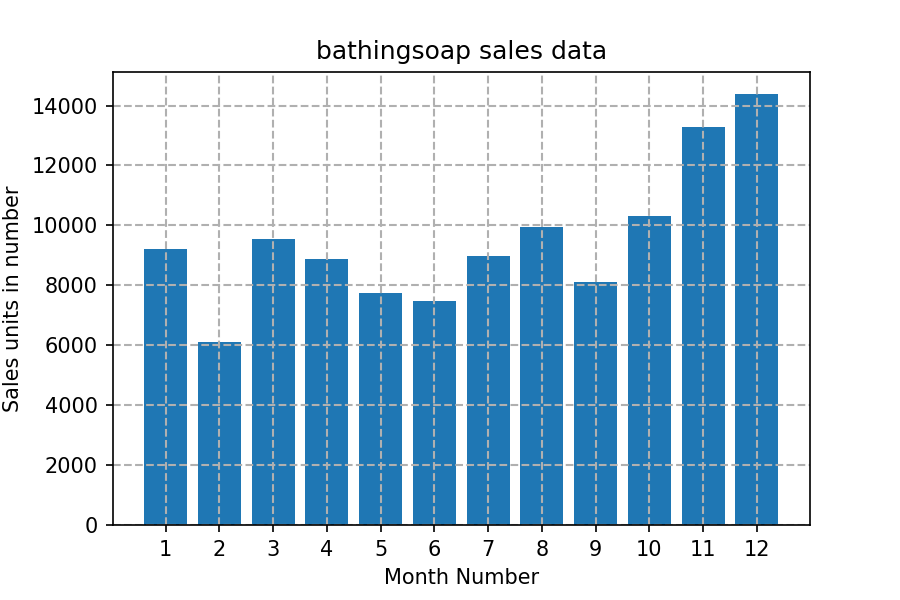
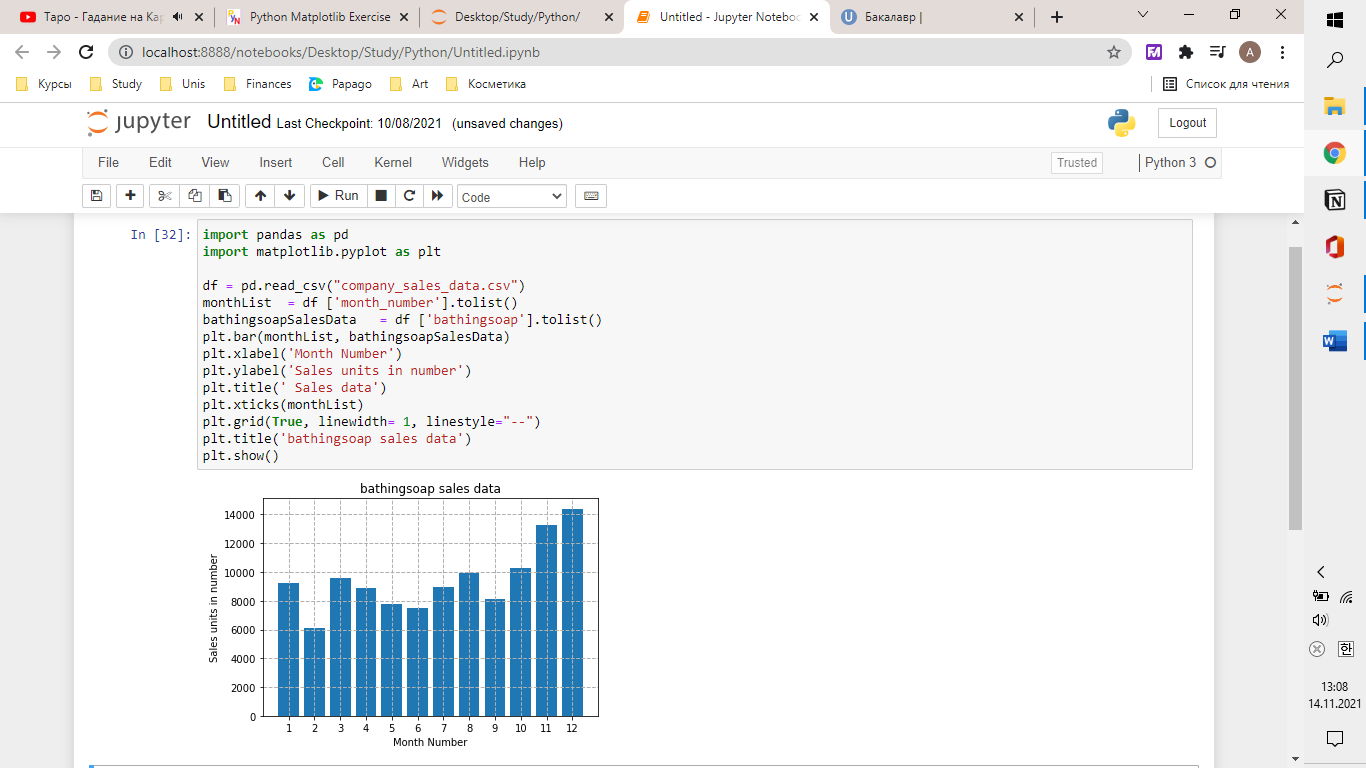
Exercise 1: Read sales data of bathing soap of all months and show it using a bar chart. Save this plot to your hard disk
The bar chart should look like this.
Solution:
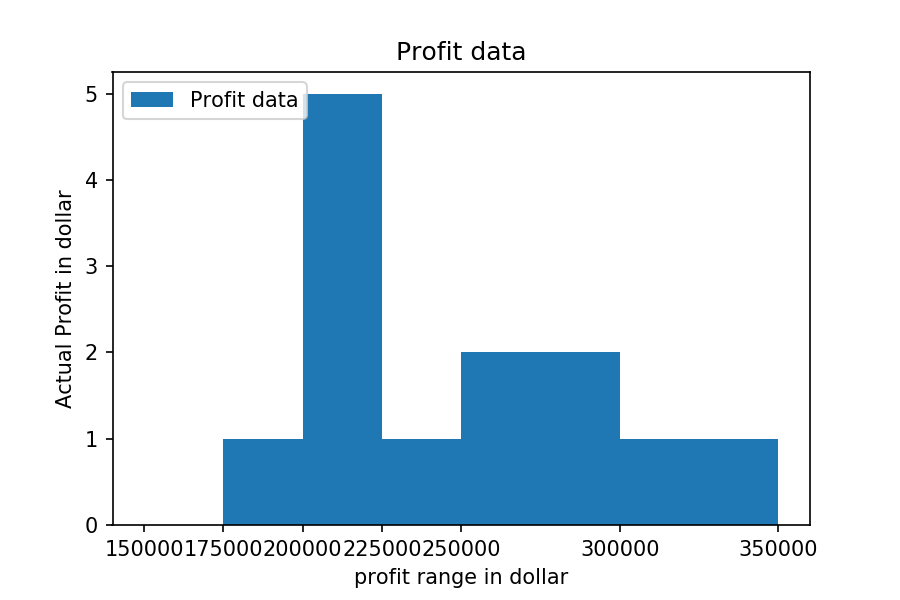
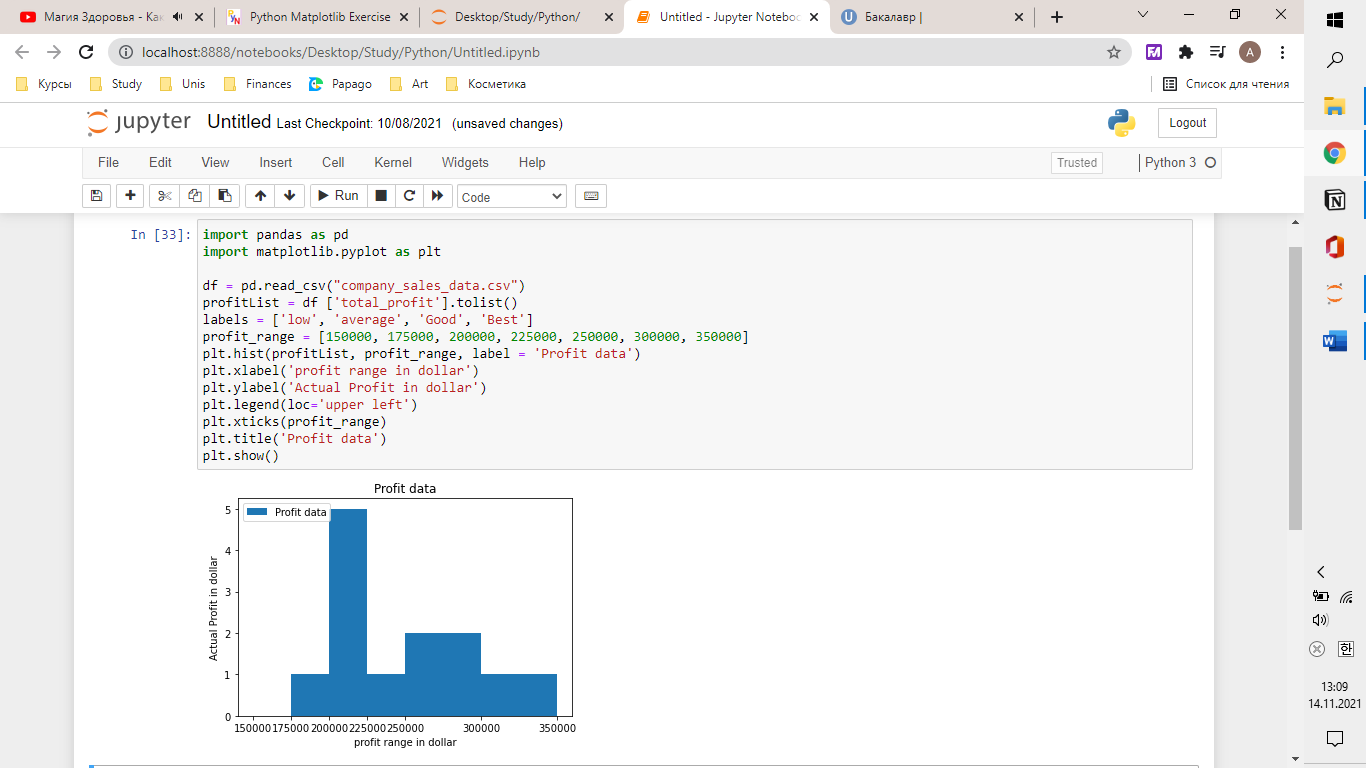
Exercise 2: Read the total profit of each month and show it using the histogram to see the most common profit ranges
The histogram should look like this.
Solution:
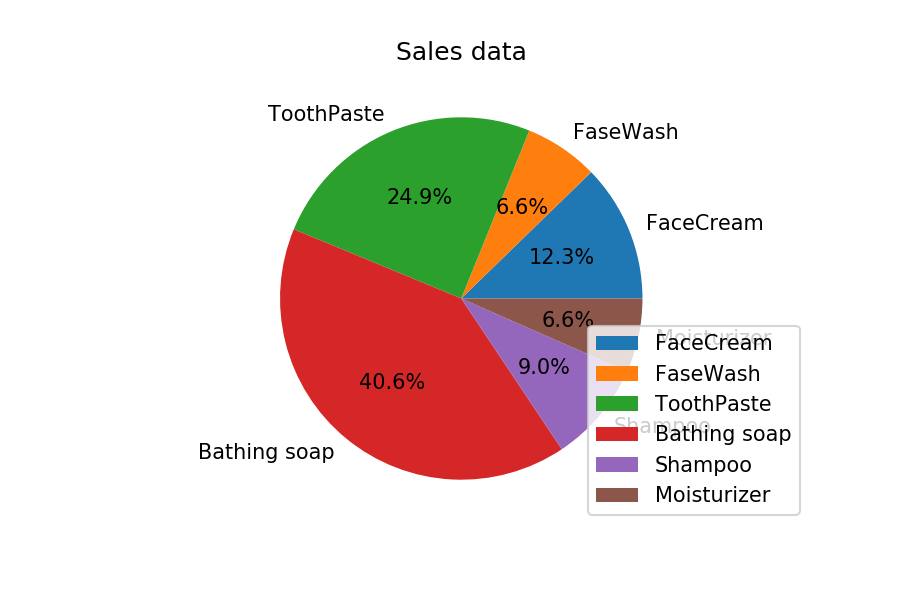
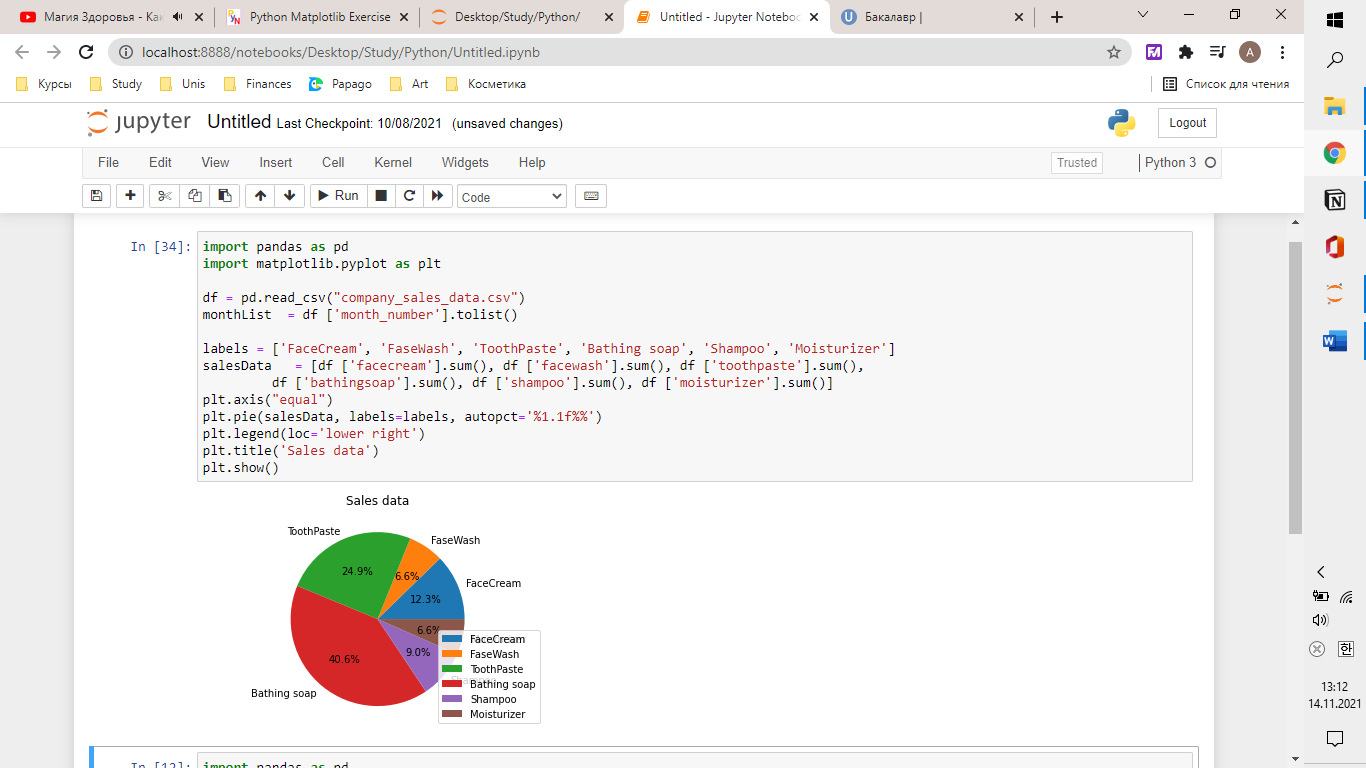
Exercise 3: Calculate total sale data for last year for each product and show it using a Pie chart
Note: In Pie chart display Number of units sold per year for each product in percentage.
The Pie chart should look like this.
Solution:
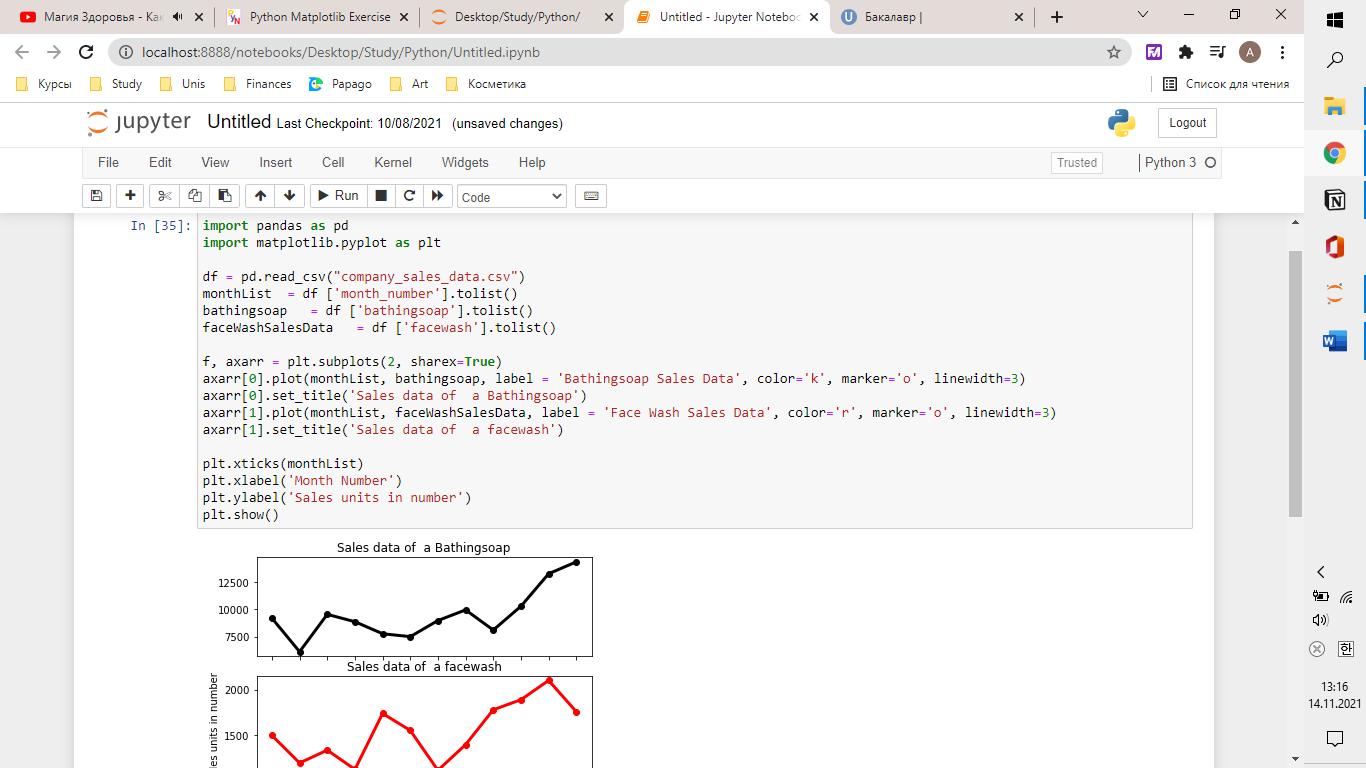
Exercise 4: Read Bathing soap facewash of all months and display it using the Subplot
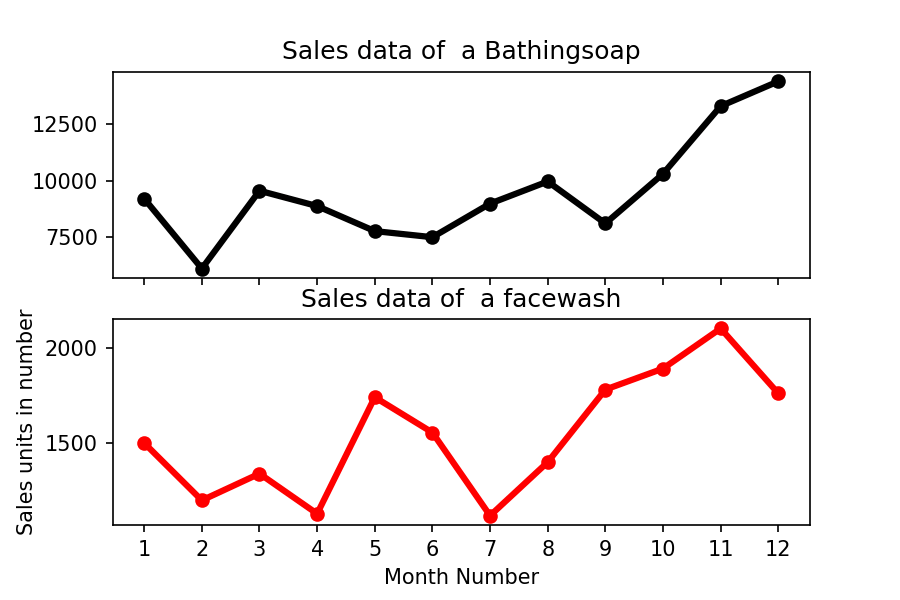
Solution:
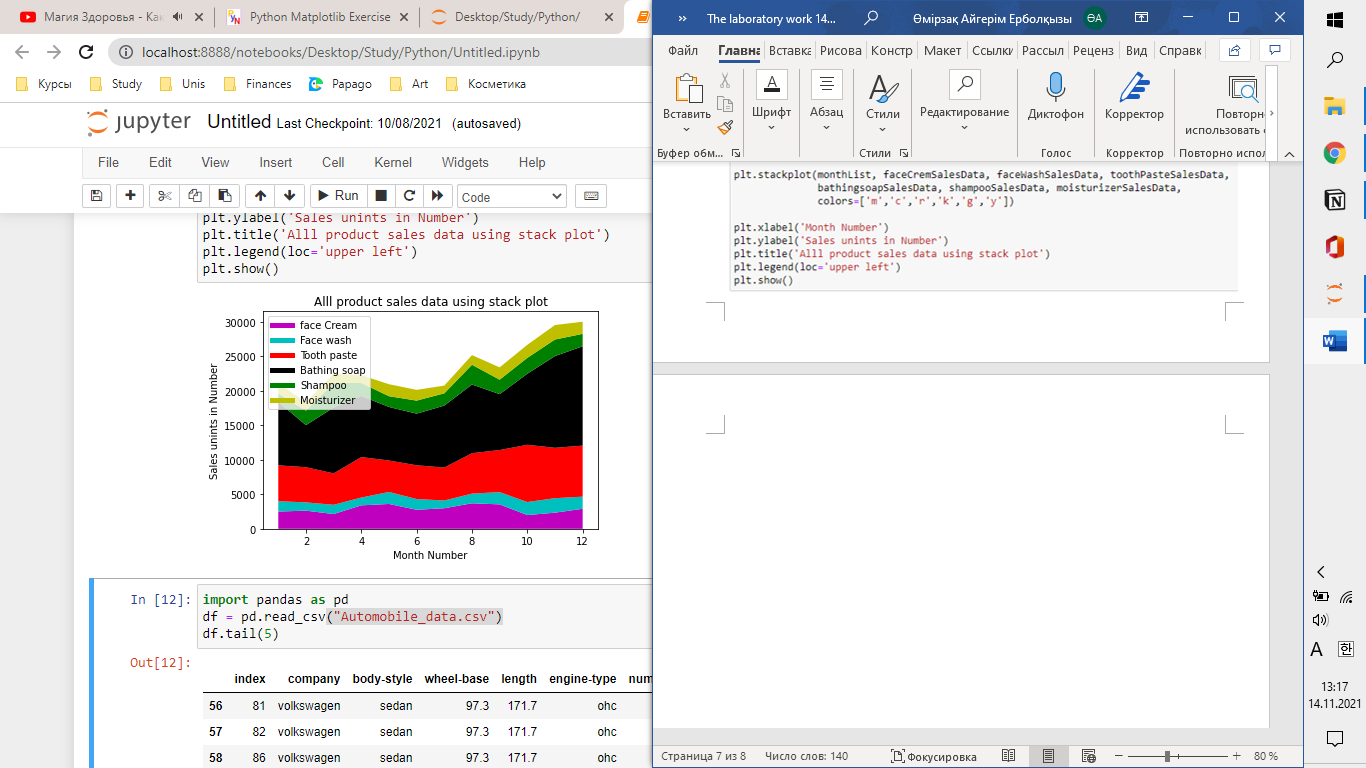
Exercise 5: Read all product sales data and show it using the stack plot

Solution:

Соседние файлы в предмете Администрирование систем и сетей