

20B
Atlas of Cases
Christian Lindqvist, Dorrit Hallikainen, and Anna-Lisa Söderholm
Regular radiologic examinations are essential in follow-up of bone grafts. Radiologic examination contributes to the evaluation of bone healing and complications such as infection or graft failure. It is possible to recognize signs of infection 2 weeks after surgery.1 Early graft failure can be diagnosed 1 month postoperatively.2 In nonvascular grafts, some degree of bone resorption regularly appears. Slight resorption, where the height of the graft diminishes 0% to 15% within the first 3 months, is a reliable sign of good healing. Massive resorption exceeding 30% always indicates graft failure. Moderate graft resorption of 15% to 30% may appear for several reasons, but it always indicates the need for thorough and frequent follow-up and should lead to an active treatment of the problems.2
Radiologic follow-up examinations are scheduled on the first postoperative day, and 2 weeks and 1 month after the operation. The schedule for further follow-up depends on the findings 1 month after surgery.
The examination should include a panoramic image and a Towne’s radiograph and detailed narrow-beam images complemented with cross-sectional tomography when necessary.
The use of other imaging modalities (e.g., CT, MRI) in fol- low-up depends on the possibilities to overcome interpretation problems caused by metal artifacts.3
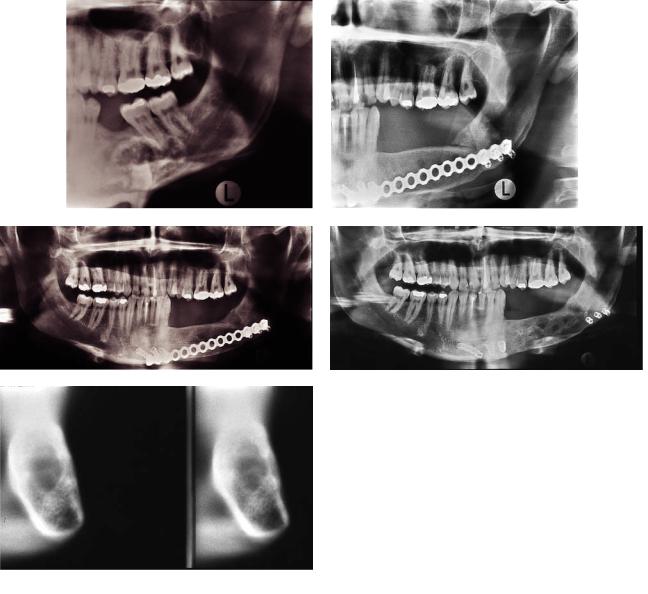
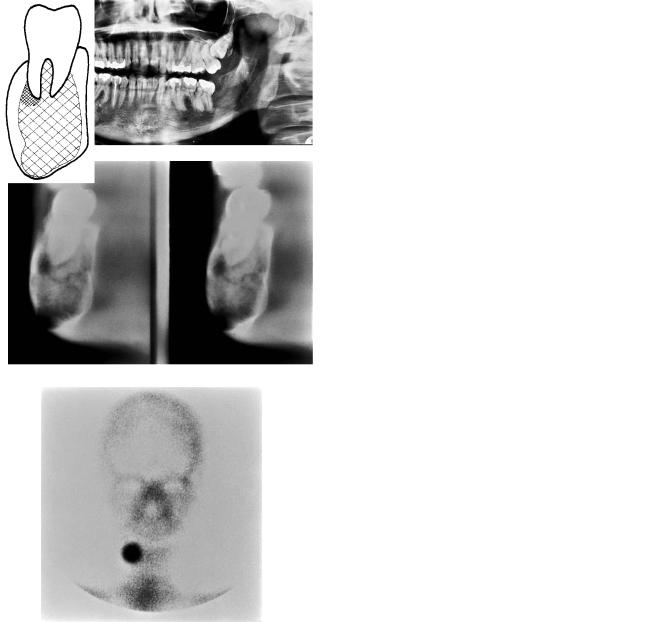
All the cases presented here illustrate clinical problems. The first case (Figure 20B.1) shows good bony healing between graft and mandible but resorption within the graft, ongoing for more than 3 years.
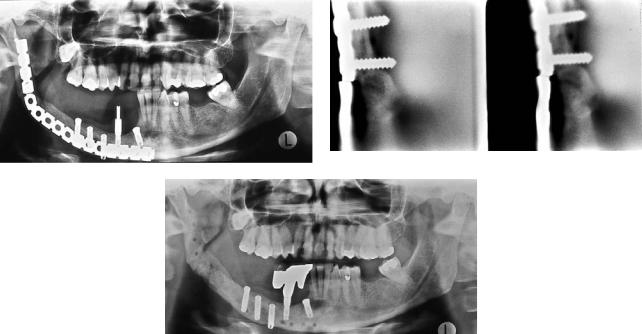
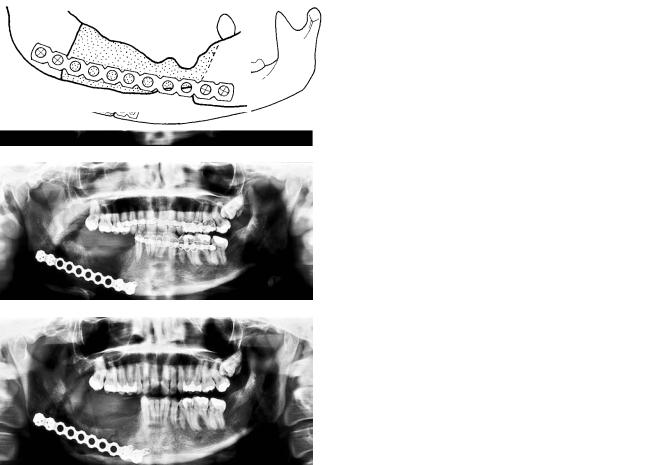
The second case (Figure 20B.2) illustrates a good final result in spite of delayed union and plate fracture.
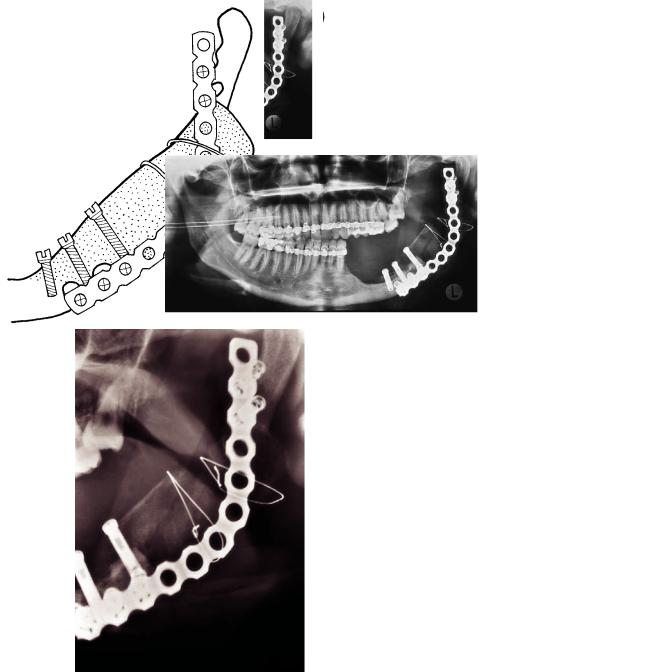
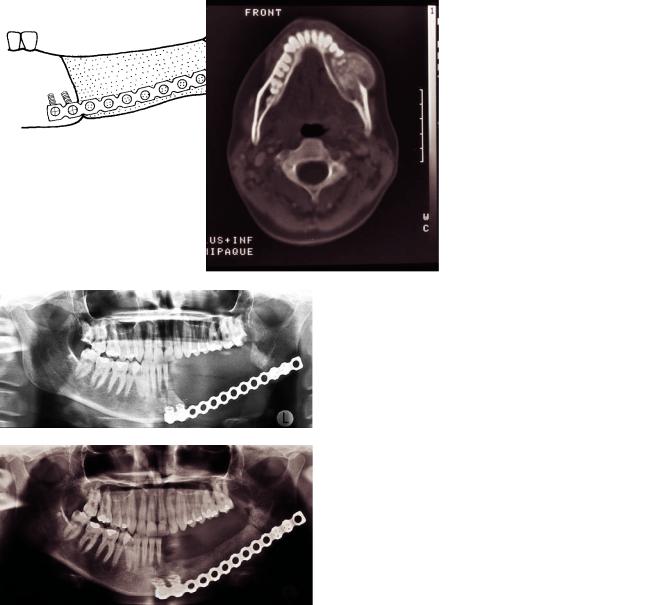
The third case (Figure 20B.3) shows moderate graft resorption, which was due to infection. Intensive therapy resulted in a good final result.
The fourth case (Figure 20B.4) shows delayed but otherwise uneventful healing.
The fifth case (Figure 20B.5) illustrates delayed union, which was caused by hyperparathyroidism. After parathyroidectomy bony healing was achieved, and the final result is good.
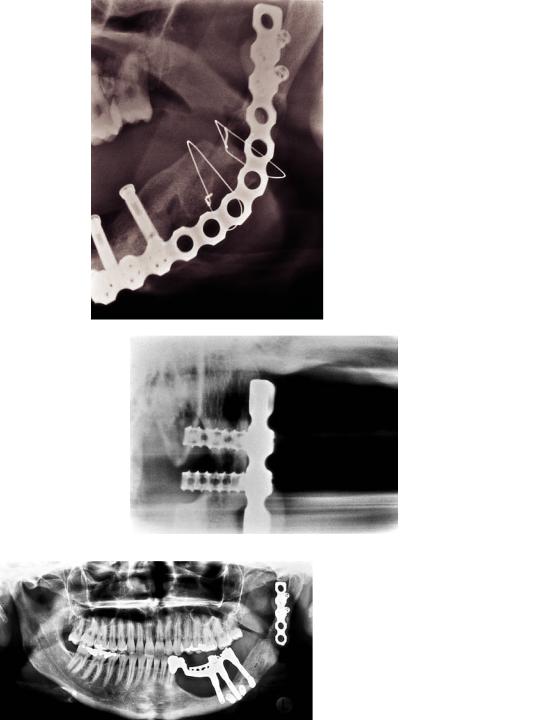
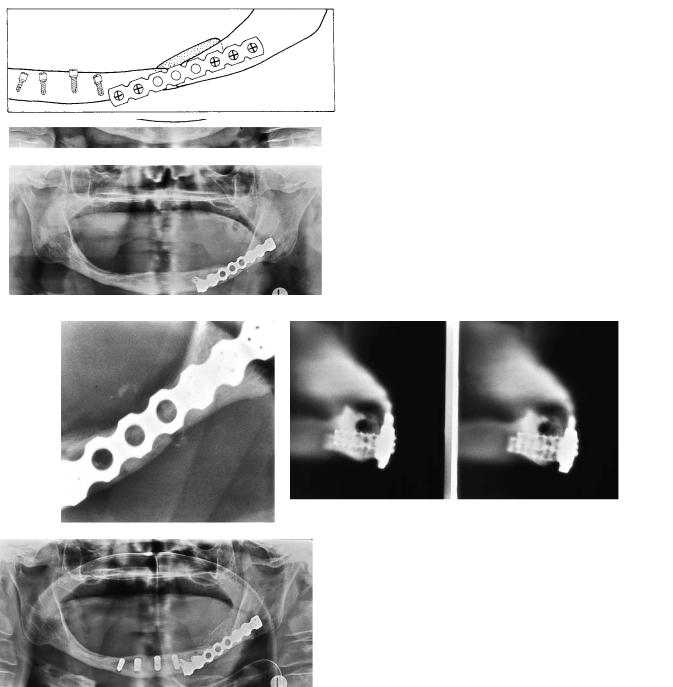
The sixth case (Figure 20B.6) shows delayed healing in a spontaneous fracture of an irradiated, edentulous mandible. Bone grafting and insertion of implants achieved a good final result.
220
20B. Atlas of Cases |
221 |
a |
b |
c |
d |
e |
f |
FIGURE 20B.1 (a) Panoramic image of a 32-year-old male with Pindborg’s tumor (CEOT) to the left. (b) Panoramic image 6 months after the operation. The border between graft and the angular area is still sharp, and the bony union is not complete. (c) Situation 14 months after the operation. There is complete bony union between graft and mandible. However, areas of bone resorption are seen within the graft. (d) Situation 27 months after the operation. The
plate has been removed, and the height of the graft is preserved, but bone resorption within the graft seems to continue. (e) Cross-sec- tional tomography 27 months after operation. Two consecutive cuts. There is good cortical lining of the graft, but it has a central area of radiolucency (bone resorption). (f) A diagrammatic representation of (e).
222 |
C. Lindqvist, D. Hallikainen, and A.-L. Söderholm |
a |
b |
c
FIGURE 20B.2 (a) Panoramic image of a 40-year-old female 4 years after primary operation for SCC of mandibular gingiva of the molar area and 20 months after transplantation of an iliac bone graft. The plate has fractured. There is good bony union medially between
graft and mandible, but a defect at the angular border. (b) Cross-sec- tional tomography also shows the plate fracture. A thin bony bridge is seen lingually. (c) Panoramic image 5 months later. There is complete union between graft and mandible; the plate has been removed.
20B. Atlas of Cases |
223 |
a |
b |
c
d |
e |
FIGURE 20B.3 (a) Panoramic image of a 23-year-old female 1 month |
months later. The resorption has increased. (d) Detailed image of the |
after surgery for recurrent ameloblastoma. There is moderate re- |
ramus area shows the contours of the graft. (e) A diagrammatic rep- |
sorption of the graft, especially in the mesial part, due to infection. |
resentation of (d). |
(b) A diagrammatic representation of (a). (c) Panoramic image 2 |
Continued. |
224 |
C. Lindqvist, D. Hallikainen, and A.-L. Söderholm |
f |
g |
h |
i |
j
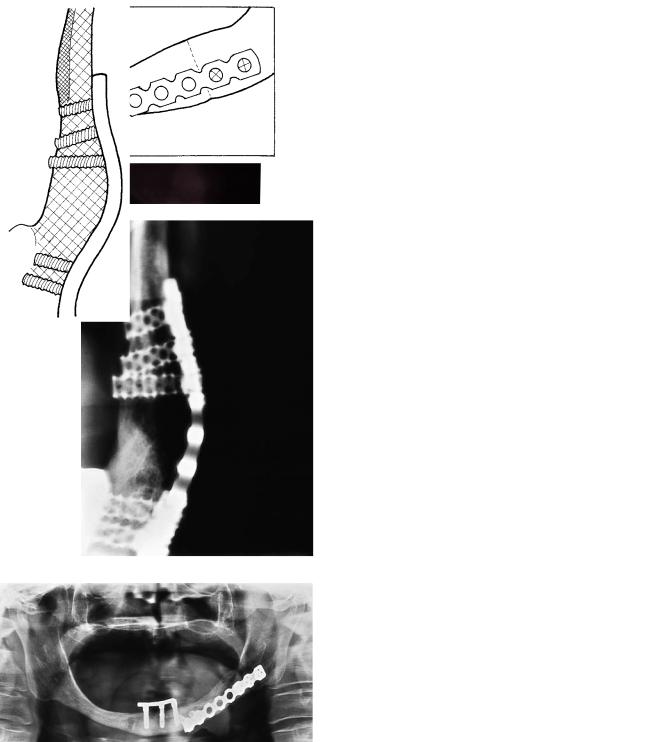
FIGURE 20B.3 Continued. (f) Detailed image of the ramus 13 months after the operation shows good healing. (g) A diagrammatic representation of (f). (h) Detailed posteroanterior image of the condylar area. The buccal cortex is preserved, and there is complete union between graft and mandible. (i) A diagrammatic representation of (h).
(j) Panoramic image 4 years later. A part of the plate was removed, and dental implants with suprastructure are in use. The patient is symptom free.
20B. Atlas of Cases
a
c
e
225
b
d
FIGURE 20B.4 (a) Panoramic image of a 31-year-old female shows an atypical ossifying fibroma in the mandible. (b) A diagrammatic representation of (a). (c) Cross-sectional tomography shows expansion and bulging of the lingual cortex and a radiolucent area at the lower border revealing that the tumor has growth potential. (Courtesy Pertti Paukku, M.D. Helsinki University Central Hospital, Department of Diagnostic Radiology.) (d) A diagrammatic representation of (c). (e) Nuclear scan shows strongly increased uptake in the right mandibular body.
Continued.
226 |
C. Lindqvist, D. Hallikainen, and A.-L. Söderholm |
f |
g |
h |
i |
j |
k |
FIGURE 20B.4 Continued. (f) Immediate postoperative panoramic image. (g) A diagrammatic representation of (f). (h) Panoramic image 3 months after surgery. There is moderate resorption of the graft but no signs of infection or loosening. (i) A diagrammatic representa-
tion of (h). (j) Panoramic image 6 months after surgery. There is still a radiolucent border between graft and mandible indicating delayed union. No signs of complications. (k) A diagrammatic representation of (j).
20B. Atlas of Cases |
227 |
a
b |
c |
d |
e |
FIGURE 20B.5 (a) This 29-year-old female has an ossifying fibroma in the mandible. CT shows the tumor expanding through the buccal cortex. (Courtesy Pertti Paukku, M.D. Helsinki University Central Hospital, Department of Diagnostic Radiology.) (b) Panoramic im-
age 1 day after resection of the mandibular left body. (c) A diagrammatic representation of (b). (d) Panoramic image 3 months after transplantation of bone graft. The border between mandibular angle and graft is still sharp. (e) A diagrammatic representation of (d).
Continued.
228 |
C. Lindqvist, D. Hallikainen, and A.-L. Söderholm |
f |
g |
h |
i |
FIGURE 20B.5 Continued. (f) Panoramic image 10 months after bone transplantation. There is good bony union mesially, but the distal border between graft and angle is still visible, indicating delayed union. (g) A diagrammatic representation of (f). (h) Situation 42
months after primary operation. The plate has been removed and dental implants inserted into the graft. (i) A diagrammatic representation of (h).
20B. Atlas of Cases |
229 |
a |
b |
c |
d |
e |
|
f |
|
|
|
g |
h |
FIGURE 20B.6 (a) Spontaneous fracture of irradiated edentulous mandible in a 66-year-old female. (b) A diagrammatic representation of (a.) (c) Fracture stabilized with THORP. (d) A diagrammatic representation of (c). (e) Detailed image 8 months after fixation. The fracture is still visible, and there is delayed union. (f) Cross-sectional
tomography of the parasymphyseal area reveals good screw fixation. There is some fragmentation of the atrophied alveolar crest. The mandibular canal is clearly visible above the screws. (g) Panoramic image taken the day after transplantation of bone graft and insertion of dental implants. (h) A diagrammatic representation of (g).
Continued.
230 |
C. Lindqvist, D. Hallikainen, and A.-L. Söderholm |
i |
j |
k |
l |
m |
n |
FIGURE 20B.6 Continued. (i) Detailed image 1 year after graft surgery shows good bony healing. (j) A diagrammatic representation of (i).
(k) Detailed image in posteroanterior direction confirms good bony union. (l) A diagrammatic representation of (k). (m) Panoramic im-
age 13 months after surgery. The plate is still in place. The dental implants have been connected with a bar. (n) A diagrammatic representation of (m).
20B. Atlas of Cases
References
1.Iizuka T, et al. Infection after internal fixation of mandibular fractures. A clinical and radiological study. J Oral Maxillofac Surg. 1991;49:585–593.
2.Söderholm A, Hallikainen D, Lindqvist C. Radiologic follow-up
231
of bone transplants to bridge mandibular continuity defects. Oral Surg Oral Med Oral Pathol. 1992;73:253–261.
3.Tartaglino L, Flanders A, Vinitski S, Friedman D. Metallic artifacts on MR images of the postoperative spine: reduction with fast spin-echo techniques. Radiology. 1994;190:565–569.