

akgunduz
.pdf5.2. Child care quality and subsidies |
85 |
mand for formal child care prices, without a corresponding decrease in labor force participation. However, there is no prior evidence as to how subsidy cuts affect child care quality.
The impact of a change in subsidies on quality depends on what parents know. Parents have been found to value convenience and prices over quality and may have limited information on centers’ quality (Mocan, 2007; Kim and Fram, 2009). Centers may then cut costs and lower quality in order to compete on prices. On the other hand, if parents have perfect information and foresight about child care quality and its effects, they may be willing to accept higher prices to avoid reductions in quality. Furthermore, regulations on caregiver qualifications and other structural factors may limit the extent to which quality can be reduced. If the regulations encompass all factors that can affect process quality and are sufficiently strenuous, quality at the market equilibrium would remain unchanged.
Treating the national child care market as one homogenous market would be a mistake given the local character of most service markets including child care. In thick markets where demand is high, price elasticity of child care use is likely to be lower than in thin markets where subsidies may cause a larger shift in demand. Cleveland and Krashinsky (2009) have found that non-profit child care centers that are expected to provide higher quality care are only able to do so in thick markets where there is sufficient demand to pay premiums for higher quality child care. Centers operating in thin markets where price elasticity is high would be more sensitive to changes in child care subsidies and are likely to react to a subsidy cut by lowering costs and quality to maintain acceptable prices.
There are multiple other mechanisms through which subsidies can influence child care quality. If competition has a positive effect on child care quality (as it does on schooling, e.g. West and Woessmann (2010)), centers shutting down as a result of lower demand can also decrease competition and parental choice, resulting in lower quality. Positive effects on quality are also plausible. A smaller market can raise the average quality of child care centers. Centers that provided low quality care in the first place should be the ones losing customers first, which would raise average quality. Possible imperfections in the child care market generally make it difficult to give apriori predictions about the effects of policy changes.

86 |
Chapter 5. |
5.3 Child care in the Netherlands
The structure of the Dutch child care sector is central to our identification strategy. Formal child care centers in the Netherlands can be divided into daycare centers (kinderdagverblijf ) and playgroups (peuterspeelzaal). Daycare centers are typically used by dual-income families and can cover enough hours for full-time employment.2
Playgroups are generally used for shorter periods of time: between two to four half days a week. Both center types essentially provide the same child care service in terms of quality, but for different groups and for different hours.
Daycare centers operate in a private market and parents are free to choose the daycare center they prefer. Child care subsidies are paid directly to parents, meaning that the demand side is subsidized rather than the supply side. Subsidies are paid up to an hourly price that is adjusted each year and depend on income and the number of children of the household in daycare. In the period between 2005 and 2008, the child care sector was boosted through increases in subsidies that effectively cut prices by half for parents (Bettendorf et al., 2012). These increases were later reversed to some extent as the subsidies were reduced most recently in 2012. The change in subsidies that took place in 2012 can be seen in figure 5.1. Subsidies were cut across the board for the first child by between 2 to 5 percentage points and subsidies for the care of a second child were reduced by more than 10 percentage points depending on income. These subsidies are paid for a set maximum hourly price. The portion of the price that is above the maximum does not factor in the subsidy calculation. In addition to the reduction in subsidies, the maximum hourly price was not increased from e 6.36 in 2012 while the average price in the child care market continued to rise from e 6.32 to e 6.45 (SZW, 2013). The rise in prices without a corresponding increase in maximum hourly price implies that there is on average e 0.13 extra that parents have to pay for which they do not receive any subsidies.
Appendix 5A shows in detail the changes in net cost of monthly daycare for different family configurations, income and number of children in daycare. The increases in net monthly costs are around 15% for parents with a single child and over 25% for parents with two children in daycare. The cuts are larger in absolute terms for the higher income groups. Our hypothesis that the subsidy reduction may have
2Subsidies are only paid if both parents are working.

5.3. Child care in the Netherlands |
87 |
Figure 5.1: Subsidy rates for first and second children (proportion) Source: Tax Office
Figure 5.2: Incomes of families with one child <18 Source: Statistics Netherlands

88 |
Chapter 5. |
led to a negative demand shock appears to be consistent with the figures in table 5.1. 2012 is the first year since the 2005 Child Care Act in which hourly daycare prices rose less than the core inflation rate. In line with a negative demand shock from the subsidy cuts, the number of children in daycare also declined for the first time by 3.5% after a rapid rise between 2008 and 2011 of approximately 20%. Ministry of Social Affairs figures also show that the average hours of care decreased by 5%. Playgroups are funded by municipalities with minor parental contributions and playgroup use is not subsidized on the demand side. While playgroups may also be affected by the recession and general austerity in the Netherlands, these effects would have been felt in the daycare center as well regardless of the subsidy cuts. We thus expect playgroups to serve as a valid control group to test the impact of the subsidy reduction.
Both daycare centers and playgroups are regulated in terms of structural quality factors such as child to staff ratios and space specifications. These regulations are monitored through different channels. Daycare centers’ are inspected by municipalities for whether or not they confirm to the quality regulations agreed upon between parental organizations and daycare providers. Similarly, playgroups are also inspected by municipalities but their regulations are set by national law. Both center types need to pass the inspection of Municipality Health Service (GGD): daycare centers in order for the parents who use the daycare center to be eligible for subsidies and playgroups in order to receive funding.
Table 5.1: Child care market since 2005
|
Average price |
Price inflation |
Core inflation |
Number in daycare (x1000) |
2005 |
e 5.34 |
|
2.04% |
|
2006 |
e 5.45 |
2.06% |
1.00% |
|
2007 |
e 5.65 |
3.67% |
1.87% |
|
2008 |
e 5.81 |
2.83% |
1.94% |
257 |
2009 |
e 5.97 |
2.75% |
1.11% |
279 |
2010 |
e 6.16 |
3.18% |
1.93% |
305 |
2011 |
e 6.32 |
2.60% |
2.38% |
322 |
2012 |
e 6.45 |
2.06% |
2.90% |
311 |
Source: Dutch Statistics, Ministry of Social Affairs

5.4. Data and methods |
89 |
5.4 Data and methods
The data on child care quality in the Netherlands comes from the longitudinal PreCool survey of Dutch child care centers, parents and children. The Pre-Cool survey consists currently of two waves, one collected in 2010 and 2011 and the other in 2012. The primary purpose of the dataset is to track the development of Dutch children. Quality information was collected from the child care centers that the children in the study attended.3
The unit of analysis in our study is centers’ groups. The Pre-Cool survey involved sending trained observers to measure the quality of classrooms in each center. The average observation period was about 20 minutes for each classroom and multiple observations are made for each center. The full sample consists of 166 child care centers but several centers need to be dropped due to missing data issues. Furthermore, 15 of the centers were not included (or had missing data issues) in the second wave which consists of 748 observations from 137 centers. We use a balanced panel of 130 centers for which there is complete date for the analysis. The centers used in the analysis are from 38 different Dutch municipalities which are shown in figure 5.5.
Quality is measured using the Classroom Assessment Scoring System (CLASS), one of the scales introduced by developmental psychologists to measure the quality of child-caregiver interaction in classrooms. CLASS consists of two domains: instructional support and emotional support. Each domain is made up of several dimensions on which the observers grade the classroom interaction. The emotional support dimensions4 are i) positive climate, ii) teacher sensitivity, iii) behavior guidance and iv) regard for child perspectives. Instructional support consists i) facilitation of learning and development, ii) quality of feedback and iii) language modeling. Each dimension is graded by the observer on a discrete scale from 1 to 7. Scores between 1-2 are considered to be low, 3-5 average and 6-7 high. The domains are constructed by simply taking the means of the dimensions. The overall quality score is the mean
3Future waves will track children into primary schools and will no longer measure child care centers’ quality.
4An additional dimension named negative climate is collected but has low variation, is coded in reverse (1 being highest as opposed to 7) and its effect should be captured by the positive climate measure. Pakarinen et al. (2010) found a similarly low variation in Finland for the negative climate dimension and concluded that CLASS measures are a better predictor of classroom quality when negative climate is excluded. For the Pre-Cool survey, Leseman and Slot (2013) reports a low variation for the negative climate measure, since almost all classrooms score very low on it.

90 |
Chapter 5. |
of the two domain scores. Development psychologists often use factor analysis to contract the quality scores but the means are easier to interpret in terms of economic significance. We used factor analysis to construct domain scores for which the same regressions were fitted as a robustness check. The factor loadings are reported in Appendix 5B and appear to be around 0.7 for all dimensions except the "regard for child perspectives" dimension.
Wave 1 observations were made in late 2010 and early 2011. Wave 2 was collected exclusively in 2012. Figure 5.9 in Appendix 5B presents the number of observations made in each month. A minority of observations were made in 2010 and limiting wave 1 observations to those collected in 2011 or wave 2 observations to those made before April 2012 hardly affects the results. 15 time fixed effects are included in most estimations, to control for the month and year in which the observation was made.
Table 5.2: Quality indicators of Dutch child care services before and after the subsidy reduction
|
Wave 1 |
Wave 2 |
||
Process quality indicators |
Daycare |
Playgroup |
Daycare |
Playgroup |
|
|
|
|
|
Emotional support |
5.011 |
5.054 |
4.446 |
4.636 |
|
(0.855) |
(0.865) |
(0.736) |
(0.699) |
Instructional support |
3.093 |
3.554 |
2.611 |
3.270 |
|
(1.072) |
(1.145) |
(0.800) |
(0.824) |
Average quality |
4.052 |
4.304 |
3.529 |
3.953 |
|
(0.863) |
(0.910) |
(0.675) |
(0.680) |
Structural quality indicators |
|
|
|
|
Number of children |
9.726 |
10.073 |
9.151 |
10.587 |
|
(3.145) |
(3.982) |
(3.148) |
(3.465) |
Number of adults |
1.968 |
2.214 |
1.955 |
2.291 |
|
(0.733) |
(0.858) |
(0.812) |
(0.927) |
Observations |
392 |
466 |
355 |
411 |
Number of centers |
53 |
77 |
53 |
77 |
|
|
|
|
|
Table 5.2 presents the averages and standard deviations of the quality indicators for daycare centers and playgroups before and after the subsidy reduction. The average quality of Dutch child care centers is around the average level 4. The scores are higher for emotional support than instructional support. Pre-treatment scores for average quality are around 4 for playgroups as well. Post-treatment scores are lower for both but the drop in scores is more noticeable and significant for daycare centers,
5.4. Data and methods |
91 |
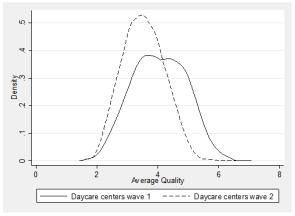
Figure 5.3: Distribution of child care quality in daycare centers
mostly due to the drop in instructional support. Difference in differences between the two periods of average quality in daycare centers and playgroups has a value of -0.172.
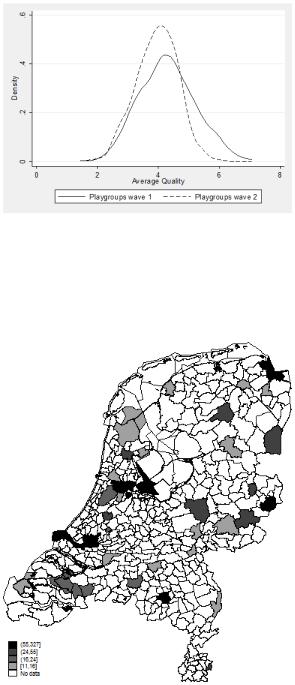
While Table 5.2 shows the means and standard deviations, Figure 5.3 and 5.4 presents the kernel distributions of the quality scores. Quality score distributions of playgroups and daycare centers are quite similar in wave 1. In wave 2 daycare centers’ distributions shift noticeably to the left. Figures 5.4 also shows the distributional shift for the quality of playgroups; there are fewer playgroups with high quality scores in wave 2 compared to wave 1 and the right side of the distribution is almost truncated.
To analyze the effect the subsidy reductions had on quality, we use linear and non-linear estimators. The linear model estimates the mean impact of the subsidy reduction on daycare quality using the mean values of playgroups’ quality as the control. We test the robustness of the linear results using the synthetic control method designed by Abadie et al. (2010). The synthetic control method allows us to put more weight to changes in quality of those playgroups that are more similar to daycare centers in terms of other observable characteristics such as area income or center age.
The linear DD models the distributional shift in daycare centers and playgroups in wave 2 that can be seen in figures 5.3 and 5.4. However, for both center types
92 |
Chapter 5. |
Figure 5.4: Distribution of child care quality in playgroups
Figure 5.5: Number of class observations per municipality
5.5. Average Treatment Effects |
93 |
the variation in quality drops. Furthermore, linear DD models assume additivity and homogenous effects on all daycare centers. To take the change in the distributions and potential heterogeneous effects for different quality levels into account, we make use of the changes-in-changes (CIC) model introduced by Athey and Imbens (2006) and the recentered influence function method of Firpo et al. (2009). The non-linear models take into account changes in the complete distribution of quality of both playgroups and daycare centers. In addition, they allow the calculation of the effects at different levels of quality, invariant to a monotonic transformation of quality.
There are a few potential concerns with DD analysis. The primary question of validity is whether the subsidy reduction is unrelated to a sudden decrease in child care quality. Since the reduction in 2012 was a part of a general austerity drive in the Netherlands and its potential costs and benefits were analyzed mostly from a labor supply perspective, the reduction in subsidies is most likely exogenous from centers’ quality. A weakness of our particular data is that we cannot control for compositional effects with regards to parents’ characteristics. For example, subsidy cuts may cause a switch between formal and informal care, which would affect quality.
5.5 Average Treatment Effects
5.5.1Empirical methodology
As the first step in our analysis, we use linear DD models to estimate the effects of the subsidy reduction. The classroom observations belong to one of two categories given by the group variable Di 2 f0,1g which is 0 for observations from playgroups and 1 for daycare observations. In the second wave when Tt = 1,Tt 2 f0,1g, daycares are affected by the subsidy cut. Treatment is indicated by the variable Ii = Di Ti.
Using a difference-in-differences model, the average treatment effect can be estimated using OLS:
yi = a + b1Di + b2Tt + rIi + bt + cj + ei |
(5.1) |
In equation 5.1, the parameter of interest is r which is the treatment effect. We add two sets of additional controls, bt are time fixed effects for the month of the observation and cj are center fixed effects. Not all classrooms were observed in the same month in the first and second wave. Fixed effects are thus added for each month and year combination in which the quality observation was made. Center fixed
94 |
Chapter 5. |
effects are added since child care markets tend to be local and centers differ across other characteristics such as size. While the child-to-staff ratio in the Netherlands is regulated in both playgroups and daycare centers, the numbers could vary during the observations. We checked whether the numbers of children and adults in classrooms were affected by the subsidy cuts and there does seem to be a significant decline in both. We test the robustness of the estimates with and without these variables.
The second linear estimator used is the synthetic control method of Abadie et al. (2010). The synthetic control model explicitly takes into account the uncertainty about the validity of the control group and estimates the treatment effect r using equation 5.2. Since all daycare center observations are assumed to be affected by the same subsidy cut, quality observations from all daycare centers are first aggregated to construct an average daycare center where i = 1. Each of the n playgroups is then weighed using the vector W = kwi+1,...,w1+nk where kw2 + ... + wi+n = 1k to generate a counterfactual control group that most closely resembles the daycare centers if a subsidy cut had not occurred.
i+n |
|
r = Y1 åwNY N |
(5.2) |
i=2 |
|
The weights are assigned using a set of covariates Z, which also includes quality before the subsidy cut to minimize the difference in observable characteristics between the average daycare center and the synthetic control of playgroup centers. More technically, the vector W minimizes (ZI ZNW )0V (ZI ZNW ), where matrix
V indicates the relative importance of Z in predicting outcomes Y . Abadie et al. (2010) show that a synthetic control that minimizes the differences in Z and preintervention outcomes at least approximates differences in unobserved characteristics as well, and provides a more general estimator than the DD model, which is a specific case of the synthetic model where all weights are equal (w2 =,..., = wi+n).
5.5.2Results
The results for the estimations can be seen in table 5.3. The treatment effect is negative in all models. In the first model, we included only child care center type, the wave the observation is from and the treatment variable. The second model replaces the wave variable with year-month fixed effects to control for the timing of the observation. Treatment effect rises to -0.19 in this case. The third model adds