

1Foundation of Mathematical Biology / Foundation of Mathematical Biology
.pdfUCSF |
How good is the test? |
|
|
|
|
In large normal samples, the t test is slightly better at finding significant differences
In small non-normal samples, the rank sum test is rarely much worse than the t test and is often much better
UCSF |
Comparing distributions |
|
|
|
|
Suppose we want to know if there is any difference between the distributions of two sets of observations
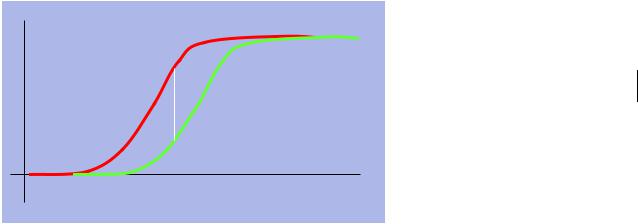
We don’t care if the difference is location or dispersion The Kolmogorov-Smirnov test
♦Informally: related to the maximum difference between the cumulative histograms of the two sample sets
J = |
mn |
max{ |
chist( pop1 ) − chist( pop2 ) |
|
} |
|
|||||
gcd(m, n) |
|
||||
|
|
|
|
|
Again, look up whether J is big enough to reject the null hypothesis that the distributions are the same.
UCSF
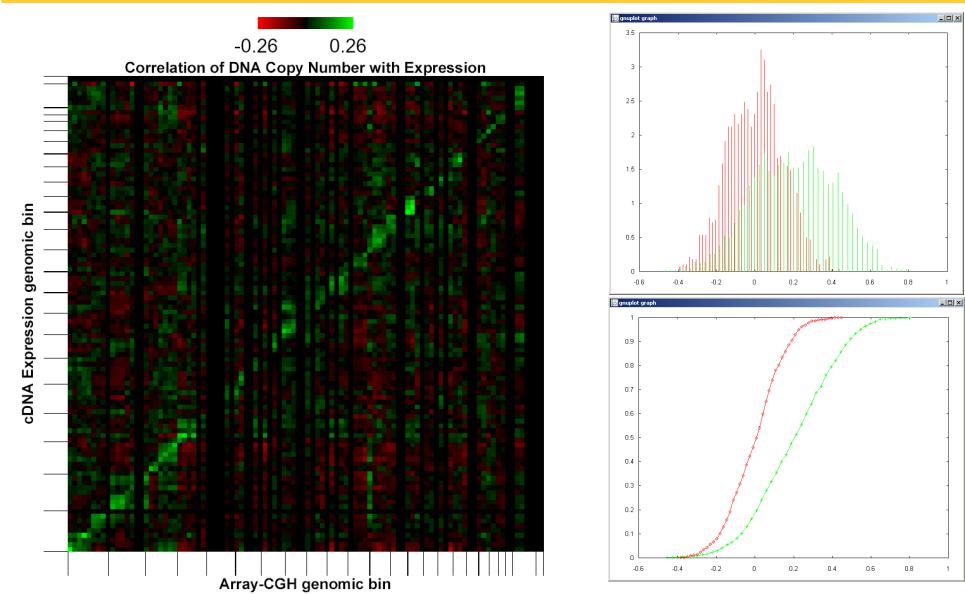
Informal example: Relationship of genomic copy number to gene expression

UCSF |
Example: Kolmogorov-Smirnov test |
|
|
|
|
We are looking at the ability of people to generate saliva on demand, plus and minus feedback to tell them if they are successful.
Our max chist difference is 6/10.
Our multiplier (mn/(gcd(m,n)) is (10*10/10 = 10)
So J = 6. From a table, we get p = 0.0524
We sort all of our samples.
We compute the cumulative histogram using the values from each set as the thresholds (since these are the only points where a change will happen).
We find the max difference.

UCSF
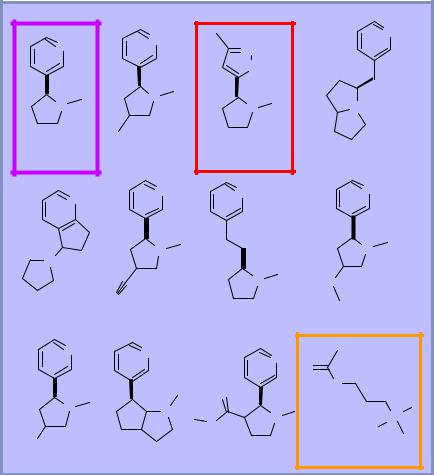
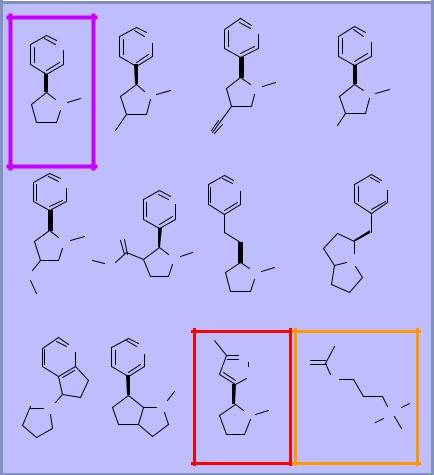
Molecular similarity: Quantitative comparison of 2D versus 3D
Nicotine example
♦Nicotine
♦Abbott molecule: competitive agonist
♦Natural ligand (acetylcholine)
♦Pyridine derivatives
2D similarity
♦Graph-based approach to comparing organic structures
♦Very efficient algorithm
♦Can search 100,000 compounds in seconds
Ranked list versus nicotine places competitive ligands last
N |
|
N |
N |
N |
|
|
|||
|
|
|
|
|
N |
|
N |
N |
N |
|
|
|||
|
|
|
|
|
|
|
|
N |
HO |
1.00 |
|
0.99 |
00..8989 |
|
|
00..9090 |
|||
N |
|
N |
N |
N |
|
|
|
|
|
N |
|
O |
|
|
|
N |
|
|
|
O |
O |
N |
N |
|
|
|
|||
|
|
|
||
0.82 |
|
0.73 |
00..6565 |
00..5858 |
N |
|
N |
N |
O |
|
|
|
||
|
|
|
O |
|
|
|
|
O |
|
|
|
|
|
|
N |
|
N |
N |
N+ |
0.57 |
|
0.54 |
00..4545 |
00..1313 |
UCSF |
Molecular similarity: 2D versus 3D |
|
|
|
|
Nicotine example
♦Nicotine
♦Abbott molecule: competitive agonist
♦Natural ligand (acetylcholine)
♦Pyridine derivatives
3D similarity
♦Surface-based comparison approach
♦Requires dealing with molecular flexibility and alignment
♦Much slower, but fast enough for practical use
Ranked list places the Abbot ligand near the top, and acetylcholine has a “high” score
N |
N |
N |
N |
|
|||
|
|
||
|
|
O |
|
N |
N |
N |
N |
|
|||
1.00 |
0.97 |
00..9393 |
00..9191 |
N |
N |
N |
N |
|
|
|
|
N |
N |
|
N |
|
|
|
|
|
N |
N |
O |
|
|
|
|
0.90 |
0.89 |
0.880.88 |
00..8787 |
N |
N |
|
N |
O |
|
|
|
||
|
|
|
|
|
|
|
|
O |
O |
N |
N |
|
|
|
O |
N |
N+ |
||
|
|
|
|
HO
0.87 |
0.83 |
00..8282 |
00..6363 |
UCSF |
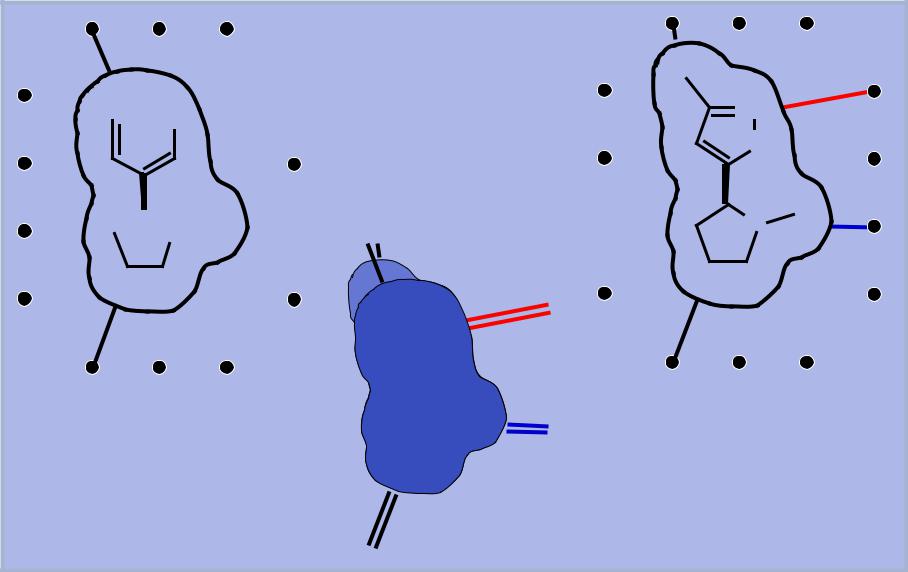
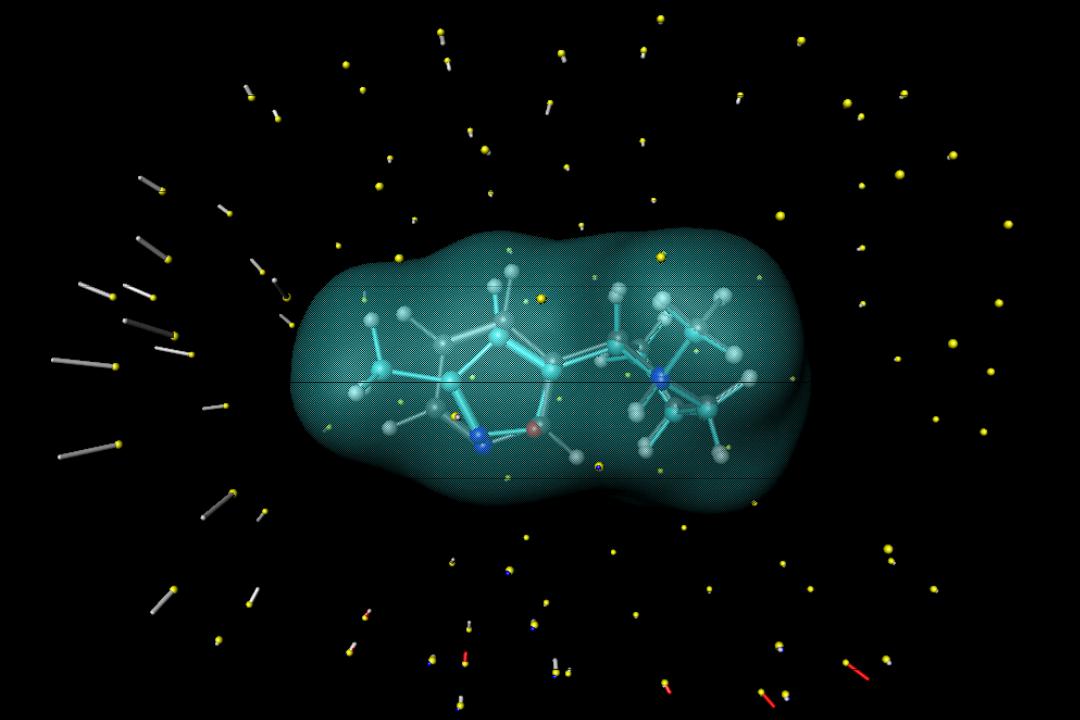
Morphological similarity: |
|
Measure the molecules from the outside |
||
|
|
|
 N
N  N
N
O
 N
N

 N
N
Similarityrity betweenbetween moleculesules isis defineddefined asas aa functionon ofof thethe differencesdifferences in surfaceface measurementsmeasurements from observationbservation pointspoints..
UCSF |
Data |
|
|
|
|
Data from: G. Jones, P. Willett, R. C. Glen, A. R. Leach, & R. Taylor, J. Mol. Biol
267(1997) 727-748
♦134 protein/ligand complexes (> 20 different proteins with multiple ligands)
♦74 related pairs of molecules (small sample from space of all possible related pairs of molecules)
♦680 unrelated pairs (randomly selected set above, avoiding pairs known to bind competitively)
See: A. N. Jain. Morphological Similarity...
J. Comp.-Aided Mol. Design. 14: 199-213, 2000.
For each technique, we compute an estimate of two distributions
♦Distribution of random variable X (similarity function of ω, the pair of molecules) for ω in the space of related pairs
♦Distribution of random variable X (similarity function of ω, the pair of molecules) for ω in the space of unrelated pairs
♦Compare the estimated density functions and the cumulative distribution functions
UCSF |
Molecular similarity: 2D |
|
|
|
|
2D similarity
♦Graph-based approach to comparing organic structures
♦Very efficient algorithm
♦Can search 100,000 compounds in seconds
What is the algorithm?
♦We compute all atomic paths of length K in a molecule of size N atoms
♦We mark a bit in a long bitstring if the corresponding path exists
♦We fold the bitstring in half many times, performing an OR, thus yielding a short bitstring
♦Given bitstrings A and B, we compute the number of bits in common divided by the total number of bits in either
N |
|
N |
N |
N |
|
|
|||
|
|
|
|
|
N |
|
N |
N |
N |
|
|
|||
|
|
|
|
|
|
|
|
N |
HO |
1.00 |
|
0.99 |
00..8989 |
|
|
00..9090 |
|||
N |
|
N |
N |
N |
|
|
|
|
|
N |
|
O |
|
|
|
N |
|
|
|
O |
O |
N |
N |
|
|
|
|||
|
|
|
||
0.82 |
|
0.73 |
00..6565 |
00..5858 |
N |
|
N |
N |
O |
|
|
|
||
|
|
|
O |
|
|
|
|
O |
|
|
|
|
|
|
N |
|
N |
N |
N+ |
0.57 |
|
0.54 |
00..4545 |
00..1313 |
Complexity: Computing the bitstring is O(N); computing S(A,B) is essentially constant time (small constant!)