

AutoPeri(NM)
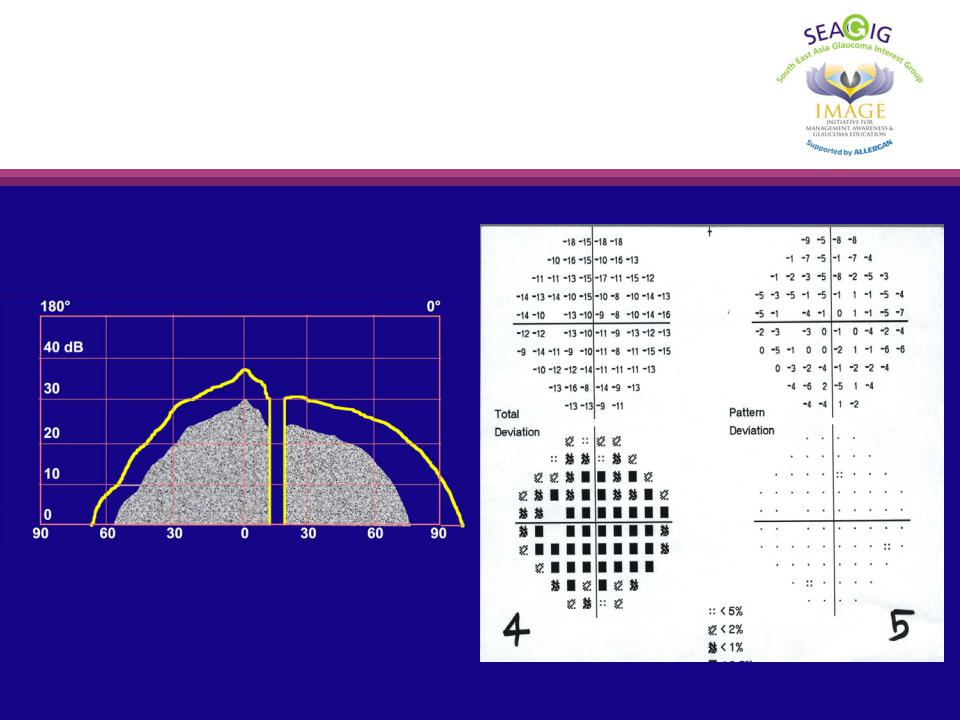
.pdfGeneralised depression with ‘hidden’ localised scotoma
180° |
|
|
|
|
|
0° |
40 dB |
|
|
|
|
|
|
30 |
|
|
|
|
|
|
20 |
|
|
|
|
|
|
10 |
|
|
|
|
|
|
0 |
|
|
|
|
|
|
90 |
60 |
30 |
0 |
30 |
60 |
90 |
|
|
|
|
|
|
© Thomas R |

Pattern deviation plot: scotoma revealed after adjusting for generalised depression
|
|
|
|
|
|
180° |
0° |
40 dB
30
20
10
0 |
|
|
|
|
|
|
90 |
60 |
30 |
0 |
30 |
60 |
90 |
© Thomas R

Zone 5: pattern deviation
•Reveals focal defects after adjusting for overall depression
(or elevation) of the hill of vision
•Confirms a scotoma
© Thomas R

Examples of total and pattern deviation plots in different situations

Normal ‘hill’ of vision
© Thomas R

‘Normal’ hill of vision with localised scotoma
180° |
|
0° |
40 dB |
|
|
30 |
|
|
20 |
|
|
10 |
|
|
0 |
|
|
90 |
30 |
60 |
© Thomas R

Generalised depression with
‘hidden’ localised scotoma
© Thomas R
Generalised depression
© Thomas R

© Thomas R

Global indices
•All the information from all the points tested is reduced to single numbers
MD |
–2.18 dB |
PSD |
4.63 dB; p < 1% |
SF |
1.24 dB |
CPSD |
4.44 dB; p < 0.5% |
|
|
MD, mean deviation; PSD, pattern standard deviation; SF, short-term fluctuation; CPSD, corrected PSD.
© Thomas R