

Therapeutic Micro-Nano Technology BioMEMs - Tejlal Desai & Sangeeta Bhatia
.pdfENGINEERING BIOCOMPATIBLE QUANTUM DOTS FOR ULTRASENSITIVE |
143 |
(A) |
|
E |
E |
E |
|
Conduction |
|
|
|
|
Band |
|
|
|
|
hv |
|
|
|
|
Valence |
E |
E |
E |
|
Band |
|||
|
|
|
|
|
(B) |
|
E |
E |
E |
|
Conduction |
|
|
|
|
Band |
|
|
|
|
hv 2 |
|
|
|
|
|
E |
E |
E |
|
Valence |
|
|
|
|
Band |
|
|
|
FIGURE 8.3. Schematic diagram describing the physical process of QD optical emission. (A) QDs are excited with an energy that exceeds bandgap (energy difference between a conduction and valence band, Ev). Upon optical excitation (hv), the electrons (which are in the valence band) become mobile (which enters the conduction band) and form a hole. (B) After a certain lifetime ( 15 ns), the electrons recombine with the holes, producing an emission or fluorescence (hv2). An electron-hole pair is called an exciton and the associated fluorescence is generally called an excitonic fluorescence.
band is completely filled with electrons while the conduction band is empty. When the semiconductor is optically or electrically stimulated by an energy exceeding the bandgap energy, electrons become “mobile” and are promoted from the valence to the conduction band; holes are formed in this process. The excited electrons eventually return to the valence band and recombine with the hole, forming an “exciton”. The recombination of electrons with holes can be either radiative or non-radiative. Radiative recombination refers to the emission of photons while non-radiative recombination refers to the absence of photon emission.
When semiconductors are in the nanometer-scale, quantum confinement effects occur [28, 52]. The Ev’s are dependent upon the size of the nanoparticles. The optical emission of QDs is a perfect example of how the optical and electronic properties of nanoscale materials are dependent upon the size. Figure 8.1a shows the emission of the ZnS-capped CdSe of a series of QDs with different sizes and their corresponding bandgap energy (which is shown as a discrete fluorescence emission). In figure 8.1a, 2.0 and 6.0 nm CdSe QDs emit blue
144 |
WEN JIANG ET AL. |
light and red light, respectively, upon optical excitation. The classical quantum mechanical “Particle-in-a-box” model is used to explain and describe the QD’s size-dependent fluorescence emission. In this model, the potential energy is considered to be infinitely high outside of the box, essentially trapping the particle inside the box. The model predicts that the wavefunction of the confined particle is dependent upon the size of the box. In QDs, the mobile carriers can be viewed as the trapped particle that is confined within the dimensions of the QD (i.e. the box).
Therefore, the wavefunction (i.e. bandgap energy and, hence, peak fluorescence emission wavelength) of the carriers is dependent upon the QD size. The bandgap energies of QDs are roughly proportional to 1/R2, where R is the QD radius. Due to the tunability of nanometer-sized QDs, their optical properties can be “custom-designed” to the needs of the researcher during the synthesis. In contrast, to make a series of uniquely fluorescent organic dye molecules, new synthetic procedures may be needed for each unique fluorescence emission. The simplicity of modifying the size and shape of QDs to produce a unique fluorescence emitter renders QDs advantageous over organic fluorophores for multiplexed detection and imaging.
Another advantage of QDs over organic-based fluorophores is their broad continuous absorption spectra [18, 53]; figure 8.1b shows measured absorbance spectra of a series of ZnS-capped CdSe QDs. For multiplexed analysis, a continuous absorption spectrum provides enhanced spectral separation between the fluorescence emission and excitation energy (minimizes leakage of excitation energy into detector or camera); additionally, QDs of different optical emission can all be excited using a single wavelength (figure 8.1c). In contrast, the use of organic fluorophores is limited to three-to-four colors because maximal excitation is confined to the absorbance peak (which has a specific wavelength window for each organic fluorophore). To permit the use of > four organic fluorophores, multiple optical excitation sources are generally needed; in effect, this leads to complication in instrumentation design and increase in cost of instrument.
QDs also have narrow and symmetric fluorescence spectra (i.e. narrow spectral linewidths). In bulk measurements, the excitonic fluorescence spectrum of a typical solution of ZnS-capped CdSe QDs in phosphate buffer saline (pH = 7.4) has a full-width at half maximum (FWHM) of 30 to 35 nm and is symmetric. However, the FWHM of single QDs has been shown to be approximately 13 nm, which is 2.5 times narrower than the typical bulk measurement [18]. The broadness in the fluorescence peak can be attributed to the size distribution within the measured bulk sample. As synthetic approaches improve, the theoretical limit of 13 nm may be reachable. In contrast to QDs, the fluorescence spectra of organic dye molecules typically have FWHMs of greater than 45 nm. In addition, the fluorescence peaks of organic dyes typically have broad “tails” [4, 11]. In applications where multiple fluorophores are simultaneously employed and detected, complicated filter systems are often needed to discriminate between the unique spectra of each organic fluorophore. This overlap leads to spectral cross-talking, which can affect the overall detection efficiency. Of note, in some QD samples a fluorescence tailing or fronting is observed in the spectra; this can be attributed to non-uniform growth of QDs during the synthesis [32]. This problem can be alleviated during the synthesis where growth kinetics and thermodynamics can be altered by injection of excess precursor solvents in the reaction flask; the adjustment of reaction conditions during synthesis can lead to QDs with symmetric fluorescence
ENGINEERING BIOCOMPATIBLE QUANTUM DOTS FOR ULTRASENSITIVE |
145 |
A |
B |
|
|
|
|
20AA..UU.. |
|
..((AU..)) |
|
|
|
|
|
1 |
1 |
3 |
4 |
5 |
|
|
|
|
|
2 |
|
|
|
2 |
Intensityity |
|
|
|
|
|
3 |
|
|
|
|
|
|
4 |
|
|
|
|
|
|
5 |
|
|
|
|
|
|
|
|
0 |
50 |
100 |
150 |
200 |
|
|
|
|
Distance (Pixel) |
|
|
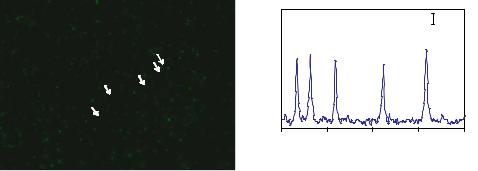
FIGURE 8.4. Single QD imaging. (A) Single QDs are imaged using a conventional epifluorescence microscope ( ex = 430 + / − 25, em = 535 + / − 25) with a 100 W Hg lamp excitation and a 100x objective (N.A. = 1.3). These QDs are blinking on/off, a property that is common with single fluorescent molecule. (B) Linewidth measurements of five single QDs. This shows the relative brightness of each QD to background.
spectra. The narrower spectral linewidths and symmetric emission peaks of QDs bestow QDs ideal probes for multiplexed detection and analysis.
In addition to the size-tuneable and broad absorption profile, QDs exhibit large molar extinction coefficients and stability against photobleaching. Most small organic fluorophores have molar extinction coefficients (ε) of 103 to 104 M−1 cm−1, while the ε of QDs are 10 to 100 times larger [54–56]. These relatively large molar extinction coefficients are one of the main reasons that single QDs can be easily imaged using a conventional epifluorescence microscope under ambient temperatures (see figure 8.4). A single QD is estimated to be 10 to 20 times brighter than that of a single organic fluorescent molecule [18, 41].
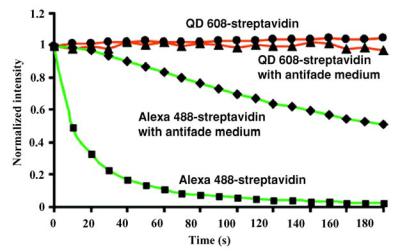
The fluorescence emission of QDs is extremely stable under constant photoexcitation. Figure 8.5 compares the photobleaching rate of inorganic QDs to the organic dye molecule alexa-488 in cells. Wu et al. stained a cell’s microtubule with QDs and the nucleus with alexa-488. The cells were fixed with either the antifade Vectashield or glycerol [41]. Then the cells were excited using a 100W Hg lamp.
Fluorescence images were obtained at 10s intervals for 3 minutes and the fluorescence intensity measured at each of the intervals (see figure 8.5 for comparative photobleaching curve of qdots to the organic dye molecules). They showed that QD emission signal remained constant while the alexa-488’s fluorescence signal decreased slowly in antifade and rapidly in glycerol. QDs are estimated to be 100 to 200 times more stable against photobleaching than organic dye molecules [18, 41, 57]. QDs have also been shown to be more photostable than fluorescent proteins (e.g., phycoerytherin) [58]. QDs do photobleach under extremely high power (beyond the typical power used for most biological imaging experiments). The photobleaching of QDs is due to photo-oxidation and desorption of atoms from the QD surface. Van Sark et al. showed that a 5 nm ZnS-capped CdSe QD shrank 1 nm when the QDs were excited with 468 nm line of Ar-Kr CW laser at a power density of 20 kW/ cm2 [59]. The capping of QDs with a thick semiconductor layer (e.g., CdS or ZnS onto CdSe) to form a core/shell QD structure can slow the photodegradation process and enhance the photostability of the QDs [60].
146 |
WEN JIANG ET AL. |
FIGURE 8.5. Photostability comparison of QDs with organic dye molecules. Fluorescence intensity measurements of cells stained with either QD-streptavidin or alexa 488-streptavidin. Within the same mammalian cell, microtubules were stained with QDs while the nucleus was stained with alexa 488-dye and the cells was mounted either with glycerol or antifade mounting medium Vectashield. The cells were excited using Hg lamp and the fluorescence intensity was measured every 10 s for 3 min. This graph shows the preservation of fluorescence intensity of QD-stained microtubules while the fluorescence intensity of alexa 488-stained nucleus slowly diminished. This experiment showed the superior photostability of QDs to organic dye molecules. Reprinted with permission from corresponding author (Dr. X. Wu). Wu et al., Nature Biotechnology, 21: 41-46. Copyright 2004 NPG.
In this section, we have briefly discussed some of the unique properties of QDs that makes them appealing in a number of biological applications. For a more in-depth review paper on the photophysics and other properties of QDs, we refer the reader to a number of excellent reviews by Alivisatos [28, 52].
8.4. APPLICATIONS
The development of optical probes for biological detection and imaging has impacted many areas of biomedical research, such as high-throughput drug screening, gene profiling, and medical diagnosis. Quantum dots (QDs) comprise a new generation of optical probes that have stirred tremendous excitement in the biological and medical community since their introduction in 1998. QDs offer novel properties that are superior to most organic dye molecules for biological research and applications, and will provide researchers with greater flexibility in experimental design. In this section, we discuss some of the successfully demonstrated biological uses of QDs.
8.4.1. In Vitro Immunoassays & Nanosensors
QDs have been incorporated into numerous in vitro assays for detecting proteins, DNA, and small organic molecules. One of the simplest immunoassay designs for biomolecule
ENGINEERING BIOCOMPATIBLE QUANTUM DOTS FOR ULTRASENSITIVE |
147 |
detection is the latex agglutination test, in which detection is achieved by QD-aggregation. Chan and Nie successfully demonstrated how this assay is used to detect the presence of Immunoglobulin G (IgG) [12]. By coating the surface of ZnS-capped CdSe QDs with the antibody to Immunoglobulin G (IgG), they were able to detect the presence of IgG. The IgG acted as a bridge between anti-IgG coated QDs, effectively causing aggregation of anti-IgG coated QDs. Mitchell and coworkers used a similar aggregation-based scheme for the detection of oligonucleotides [61]. While Zhu and coworkers used QD-streptavidin conjugates for the immunofluorescence labelling of Cryptosporidium parvum and Giardia lamblia cells [62].
QDs have also been employed in surface-based assays. Thompson and coworkers and Xiao and Barker extended the use of QD-oligonucleotide probes for fluorescence in situ hybridization, a popular approach for detecting genetic mutations in human metaphase chromosomes [63, 64]. Patolsky et al., labelled and studied the dynamics of telomerization using QDs [65]. Apart from DNA analysis, extensive work by Mattoussi and coworkers has advanced QDs as detection probes for ELISA (Enzyme Linked ImmunoAssorbant Assays)- type assays [66, 67]. Traditional ELISA detection schemes are based on an enzyme-linked color change for identifying biomolecules. Although medical and biological researchers commonly use this technique for protein detection, ELISA typically suffers from low sensitivity and cannot be used for high-throughput analyte detection. Mattoussi and et al. demonstrated the detection of proteins and toxins with a detection sensitivity of ng/mL using QD-antibody conjugates as the detection probe. Recently, they demonstrated the successful detection of four toxins (Ricin, Cholera Toxin, Shiga-like toxin 1, and staphylococcal enterotoxin B) in a single well simultaneously [43]. This was accomplished by designing four uniquely emitting QD-probes, with each probe specifically targeting toxins captured on a surface.
Nie and coworkers engineered a more sophisticated multianalyte detection system than the Mattoussi and coworkers system for the high-throughput analysis of biomolecules. They designed QD-based molecular barcodes [68–70]. Barcoding is a concept used in grocery stores to rapidly identify products during checkout. Using a similar concept, microbead barcodes are created by the infusion of QDs (at different concentrations and mixtures) into polystyrene beads; barcodes are developed based on the emission of the QDs and intensity of QDs inside the beads. For example, QDs of 6 different colours and 10 different intensity levels can be used to theoretically produce microbeads with one million unique optical signatures. Each of these optical signatures or “barcodes” can then be uniquely assigned to one million different biomolecules by tagging each uniquely-emitting microbead with a distinct targeting biomolecule (e.g., gene sequences). These QD microbeads can then be added to a solution (e.g., blood) containing both the molecule of interest and QDs conjugated to a secondary targeting molecule. The molecule of interest (or to be detected) acts as a bridge to join the QD microbeads with the QD-conjugates. Single-bead spectroscopy can then be used to identify the binding via the fluorescence spectra (i.e. if peaks for both QDs in microbeads and QD conjugates are observed, the molecule of interest has been successfully detected).
QDs can also be used to develop robust nanosensors (figure 8.6). In one example, QDs have been incorporated into fluorescence resonance energy transfer (FRET)-based nanosensors. FRET is an optical process that involves a pair of fluorescent agents—a donor and an acceptor. In a FRET assay, the energy emission from the donor excites the acceptor
148 |
WEN JIANG ET AL. |
a
Excitation
Excitation |
FRET quenching |
|
|
Emission |
Maltose
β-cyclodextrin-QSY-9
b |
c |
Absorbance (normalized)
1.0 |
|
|
|
|
|
|
|
0.8 |
|
|
|
|
|
|
|
|
|
|
|
|
|
560QD |
|
0.6 |
|
|
β-CD-QSY9 |
|
|
||
|
|
|
|
|
|
|
|
|
|
|
|
|
|
|
|
0.4 |
|
|
|
|
|
|
|
560QD |
|
|
|
|
|
||
0.2 |
|
|
|
|
|
|
|
0 |
|
|
|
|
|
|
|
400 |
500 |
600 |
700 |
||||
Wavelength (nm)
1.0 |
|
|
0.8 |
Pl |
|
0.2 |
||
(normalized) |
||
0.6 |
|
|
0.4 |
|
|
0 |
|
PL (AU)
6 × 10⁶ |
|
|
560QD with 20 MBP/QD |
|
||
|
|
|
560QD with 20 MBP/QD |
|
||
|
|
|
+1 μM free QSY9 dye |
|
||
4 × 10⁶ |
|
|
|
|
|
|
|
|
|
|
|
|
|
|
|
|
560QD with 20 MBP/QD |
|
|
|
2 × 10⁶ |
|
|
+1 μM β –CD-QSY9 |
|
|
|
|
|
560QD No MBP |
|
|
||
0 |
|
|
|
|
|
|
500 |
550 |
600 |
650 |
|
700 |
|
450 |
|
|||||
Wavelength (nm)
d |
|
|
e |
|
2.5 |
× 106 |
10 mM Maltose |
1.00 |
Kapp = 6.9 + 0.2 μM |
|
|
100 μM Maltose |
|
|
2 |
× 106 |
10 μM Maltose |
0.75 |
|
PL(AU) |
1 |
× 106 |
|
Saturation |
|
|
1.5 |
× 106 |
1 μM Maltose |
|
0.50 |
|
|
|
|
||
|
|
|
|
|
0 Maltose |
0.25 |
|
2.5× 10⁶
2.0× 10⁶
1.5 × 10⁶
0.5 × 10⁶ |
|
|
|
|
|
1.0 × 10⁶ |
|||
|
|
|
|
0.00 |
|
|
|
|
|
0 |
|
|
|
|
|
|
0 |
|
|
|
480 500 520 540 560 580 600 620 |
|
|
|
10−3 10−2 10−1 100 101 102 103 104 |
10 |
5 |
|
|
|
640 |
|
|
|
|||||
|
Wavelength (nm) |
|
|
|
Maltose concentration (μm) |
|
|
|
|
|
|
|
|
|
|
|
|
|
|
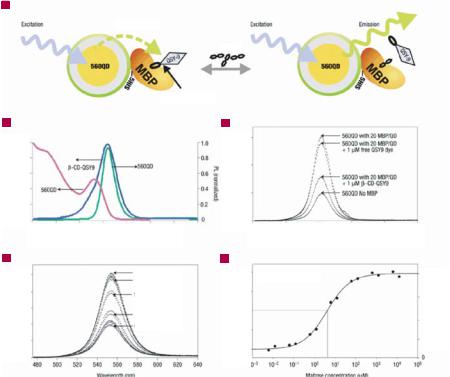
(AU) PL
FIGURE 8.6. Function and properties of the 5600 QD-MBP nanosensor. (A) 560QD-MBP nanosensor function schematic. Each 560-nm-emitting QD is surrouded by an average of 10 MBP moieties; a single MBP is shown for simplicity. Formation of QD-MBP-β-CD-QSY9 (maximum absorption 565nm) results in quenching of QD emissioin. Added maltose displaces β-CD-QSY9 from the sensor assembly, resulting in an increase in direct QD emission. (B) Spectral properties of 560QD-MBP sensor. Absorption (pink) and emission spectra (green) of MBP-conjugated 560 QD are displayed along with the absorption spectra (blue) of β-CD-QSY9. Samples were excited at 400 nm and emission spectra recorded from 420 nm to 750 nm. Arrows indicate the reference axis.
(C) Demonstration of 5600 QD-MBP FRET quenching. PL spectra (AU = arbitrary units) were collected from 560QDs and 560QDs mixed with an average of 20 MBP/QD (saturated for effect). Note the resulting increase in PL ( 300%). These same QD-MBP conjugates were then mixed either 1μM free QSY9 dye or 1μM β-CD- QSY9. (D) 560 QD-10MBP maltose sensing. Titration of a 5600QD-10MBP/QD conjugate (quantum yield 39%) preassembled with 1μM β-CD-QSY9 with increasing concentrations of maltose. (E) Transformation of titration data. The right axis shows PL at 560 nm and fractional saturation is shown on the left axis. The point corresponding to 50% saturation was used to derive the maltose apparent dissociation constant (Kapp) value. Assuming a range of useful measurement to be determined between 10 and 90% saturation translates into a sensing range of 500 nm to 10 μM maltose. Reprinted with permission from corresponding author (Dr. Hedi Mattoussi)—Medintz, I. et al. Nature Materials, 2003, 2: p.630–638. Both figure and caption are not modified from original publication. Copyright, 2004 NPG. CD = cyclodextrin, MBP = maltose binding protein.
when two fluorescent agents interact at a close distance. Recently, Medintz et al. designed QD-FRET nanosensors for the detection of sugar molecules. In their design, the surfaces of QDs were coated with maltose binding protein (MBP) that was initially bound to maltose molecules-conjugated to the quencher molecule QSY-7 [48]. As a result, the fluorescence emission of QDs was quenched by about 50%. Subsequently, the addition of maltose to a
ENGINEERING BIOCOMPATIBLE QUANTUM DOTS FOR ULTRASENSITIVE |
149 |
solution containing these QD-FRET nanosensors dislodged the maltose-quencher conjugate from the surface of the QDs, which restored the fluorescence intensities of the QDs to their prequenched state. The successful energy transfer can be used to identify a successful binding event and, hence, detection of the molecule of interest. QDs are ideal FRET donors since their emission energy can be tuned (i.e. by altering the size or composition) to match the optimal excitation energy of the acceptor.
8.4.2. Cell Labeling and Tracking Experiments
Cells are complicated systems in which biological molecules play a key role in maintaining cell viability and function. Currently, the interactions of biomolecules involved in many cellular processes (e.g., differentiation, proliferation) are not fully understood. Powerful optical probes, such as QDs, provide new tools to image and study biomolecules in action both in fixed and live cells. Early work on QD-bioconjugates demonstrated the feasibility of simultaneously identifying and imaging multiple cellular components (e.g., nuclei and cytoskeleton) within fixed mouse fibroblast cells [19]. Theoretically, by engineering a set of QDs with varying emission wavelengths, researchers could simultaneously stain and track greater than 10 cellular components within a single cell. Using a conventional epifluorescence microscope, these studies may help elucidate many of the unknown activities of biomolecules.
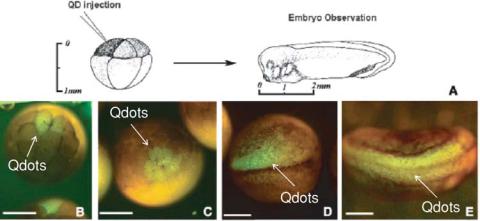
Various groups have also taken advantage of the long-term photostability and bright luminescence of QDs for live cell imaging [40, 57, 60]. Simon and coworkers tracked and imaged the behavior of starving D. Dictyostelium cells using QDs over 12 days [26]. Derfus and coworkers also used QDs to detect cellular interactions and reorganizations of co-cultures of hepatocytes (liver cells that are highly involved in the detoxification process) and fibroblast cells for 7 days [35]. Finally, Dubertret et al. injected phospholipid-coated QDs into embryos and monitored the embryogenesis process, see figure 8.7 [37].
All three of these published reports suggested that QDs do not interfere with normal cell function, and that QDs maintained their photostability and luminescence properties inside living cells. Despite these successful investigations, a great deal of work remains to be conducted to investigate the potential cytotoxicity of QDs. Derfus and coworkers demonstrated that high levels of CdSe core QDs may kill hepatocytes, but that ZnS-capped CdSe QDs cause minimal cellular toxicity [35]. Further studies on the fundamentals (including toxicity) of QD activities in cells should help optimize the parameters for using QDs for live cell imaging.
Research conducted by Dahan and coworkers opened the possibility of using QDbioconjugates to probe the interactions of individual biomolecules in/on living cells in real-time [71]. They described the use of QD-bioconjugates to track the motion of a single glycine receptor on the surface of live neurons. This study provided kinetic information of glycine receptors that could not be obtained using 500 nm microbeads or organic dye molecules. The traditional labeling approaches are hampered by large sizes and an inability to perform long-term analysis, respectively. Similarly, Mansson et al. demonstrated the photostability and brightness of single-QDs to track the sliding of actin filaments [72]. By conducting studies similar to that of Dahan and Mansson and their coworkers, biologists may gain more in-depth information about the roles and activities of biomolecules in and on living cells and tissues.
150 |
|
|
|
|
|
|
|
|
|
|
|
|
|
WEN JIANG ET AL. |
||
|
|
|
|
|
|
|
|
|
|
|
|
|
|
|
|
|
|
|
|
QD injection |
|
|
|
|
|
|
|
|
|
|
|
||
|
|
|
|
|
|
|
|
|
|
Embryo Observation |
|
|
|
|||
|
|
|
|
|
|
|
|
|
||||||||
|
|
|
|
|
|
|
|
|
|
|
|
|
|
|
|
|
|
0 |
|
|
|
|
|
|
|
|
|
|
|
|
|
||
|
|
|
0 |
|
|
|
|
|
|
|||||||
|
|
|
|
|
|
2 mm |
|
|
|
|||||||
|
|
|
|
|
|
|
|
1 |
|
|
|
A |
|
|||
|
|
1 mm |
|
|||||||||||||
|
|
|
|
|
|
|
|
|
|
|||||||
|
|
|
|
|
|
|
|
|
||||||||
FIGURE 8.7. Long-term tracking of embryogenesis using quantum dots. (A) Schematic of quantum dot injection into embryo. Quantum dots were injected into the blastomere during early cleavage stages at a concentration of 2.1 × 10⁹ to 4.2 × 10⁹ particles per cell. The embryos were then monitored at each stage of development. (B) Initial injection of QDs into embryo. (C) One hour after the injection. (D) Formation of daughter cells was labeled.
(E) Two neural embryos were labeled. This experiment clearly showed the ability of QDs for long-term biological lineage tracking. Reprinted with permission from AAAS (Dubertret et al., SCIENCE 298:1759-62). Copyright 2002 AAAS.
Larabel and coworkers demonstrated an interesting application of QDs for cell biology research [73, 74]. Instead of using QDs to tag biological molecules, Larabel and coworkers developed QD surfaces to track cell migration—a process that is important in cancer and tissue engineering. They coated the surface of a glass slide with a thin layer of silicacoated ZnS-capped CdSe QDs. Cells (e.g., MCF 10A, breast tumor MDA-MB-231 cells) are cultured on these QD layers. These cells can non-specifically uptake these silica-coated QDs. The optical excitation of the surface shows a non-fluorescent or dark track in the direction and path of the cell migration. Although the uptake of QDs is dependent upon their surface coating, this application provides an interesting use of QDs as a platform for cell research.
8.4.3. In Vivo Live Animal Imaging
Beyond simple assays and cell analysis, QDs may find use in live animal imaging. Such a technology will be useful for analyzing and detecting disease onset and progression, optically guiding surgery during tumor resection, and for elucidating biological process and kinetics in live animal models. For optimum in vivo optical imaging, traditional organic probes suffer from low tissue penetration. Optical probes emitting in the near-IR are better for in vivo imaging than visible emitting probes due to low tissue and water absorption in the near-IR emitting region [75-77]. Near-IR emitting organic fluorophores suffer from low quantum yield and weak emission; QDs can potentially overcome these problems.
As a start toward using QDs as contrast agents for in vivo animal imaging, Ruoslahti and coworkers first demonstrated the successful use of QDs for in vivo imaging

ENGINEERING BIOCOMPATIBLE QUANTUM DOTS FOR ULTRASENSITIVE |
151 |
by targeting peptide-coated QDs to the vasculatures of tumours and organs in living mice [78]. Two of these peptides were conjugated onto the surface of two QDs with distinct emission wavelengths. These peptide-conjugated QDs were then introduced into mice bearing xenograft tumours through injection into the tail vein. After 20 minutes, optical excitation revealed two distinct fluorescence signals from tumour tissues corresponding to two distinct emission wavelengths. Co-staining with markers showed red-emitting QDs localized in the blood vessels, while green-emitting QDs localized in the lymphatic vessels of the tumor. No significant QD emission was apparent in other nearby tissues and organs. Targeting molecules (e.g. peptides, antibodies) have been identified for tumour vessels and normal vessels in the brain, kidney, lungs, skin, pancreas, and other tissues [79]. In cell cultures, several groups have now shown the intracellular targeting of QDs to cellular organelles [80, 81]. This general strategy of integrating targeting molecules with nanostructures should provide a means of delivering contrast agents to specific organelles, cells, and tissues in vivo for ultrasensitive and multi-color optical imaging.
Recently, Gao and coworkers demonstrated the simultaneous targeting and imaging of ZnS-capped CdSe QDs [82, 83]. They conjugated prostate-specific membrane antigen (PSMA)-monoclonal antibody to ZnS-capped CdSe QDs and injected them into mouse bearing tumors in the prostate gland. Then, they placed the animal under a macroscopic imaging system and showed the accumulation of the PSMA-conjugated QDs in the prostate gland. The signal appeared as a bright orange stain that was clearly distinct from the animal’s autofluorescence.
Frangioni and coworkers showed the practicality of using QDs in vivo to guide tumour resection, by demonstrating the use of QDs to guide the removal of the sentinel lymph node [42]. The sentinel lymph node is the first drainage site for the lymph ducts of the breast; the removal of sentinel lymph node is a popular clinical strategy for preventing the metastasis of cancer cells. As shown in figure 8.8, near-IR emitting QDs were injected into the left paw
a |
|
|
|
|
|
Color video 5 min |
|
NIR fluorescence 5 min |
|
Pre-injection |
|
|
||
autofluorescence |
|
post-injection |
|
post-injection |
b |
Color video |
NIR fluorescence |
c |
(autofluorescence) |
||
|
|
Pre-injection |
|
|
|
30 sec |
post-injection |
|
|
|
|
|
|
4 min |
post-injection |
|
|
|
|
|
|
|
|
|
|
Image-guided |
resection |
|
|
|
|
Color video |
|
NIR fluorescence |
Color-NIR merge |
FIGURE 8.8. Sentinel lymph node mapping using near-IR QDs. (A) 10 pmol of QDs were injected into the left paw of the mouse and the flow of QDs to the lymph nodes was observed (arrow shows the axillary sentinel lymph node). (B) Isosulfan blue, a colorimetric stain, for sentinel lymph nodes was also injected into the left paw. The co-localization of the blue-stain with the QDs verifies that the QDs were located in the lymph node region. (C) QDs were then injected into 35 kg pigs and this image shows the flow of QDs in the lymphatic system. Row 4 shows the use of fluorescence to guide resection in pigs. Reprinted with permission from corresponding author (Dr. J. Frangioni). Kim et al., Nature Biotechnology, 22: 93–98. Copyright 2004 NPG.
152 |
WEN JIANG ET AL. |
of a mouse or the thigh of a 35 kg pig at a concentration of 400 pmol and guided the removal of the lymph node. The surgeons were able to monitor the flow of QDs to the sentinel lymph nodes by the fluorescence emission of the QDs. In vivo imaging depth of 1 cm using an excitation power density of 5mW/cm2 was demonstrated using QD-contrast agents. This experiment demonstrated the feasibility of using QDs for assistance and optical guidance in surgical procedures.
8.5. FUTURE WORK
We predict that, over the next decade, a great deal of research will be conducted in the biological applications of semiconductor QDs. We have already seen advances in the synthesis and biocompatibility of QDs that have led to the commercialization of these highly luminescent probes. Proof-of-concept studies have also demonstrated the great promise of QDs for biomedical imaging and detection applications. However, before QDs reach large-scale clinical application, research will be required to elucidate the effects of surface conjugated molecules on QDs, cellular responses to the uptake of QDs, and the in vivo pharmacokinetics and toxicity of QDs. In the meantime, QDs will continue to be incorporated into sensors for biomolecule detection and high-throughput analytic devices. QDs will also be used to probe the activities of biomolecules in live cells and tissues, and used as ultrasensitive contrast agents for the early detection of diseases. Of note, there have been several recent publications demonstrating the use of QDs for therapeutic applications [84, 85]. Lastly, we envision that the next decade will reveal numerous unique applications and experiments using QDs that cannot be done with traditional probes and results obtained from these experiments will reveal a deeper insight into fundamental biology that can guide the design of new therapeutics and diagnostics.
ACKNOWLEDGEMENTS
W. C. W. C. would like to acknowledge the following funding sources for support of research: Canadian Foundation for Innovation (CFI) and Ontario Innovation Fund (OIT)— New Opportunity and Infrastructure Operating Fund (CFI), National Science and Engineering Council of Canada (NSERC)—Discovery Grant, Canadian Institute of Health Research (CIHR)—Regenerative Medicine and Nanomedicine Grant and Novel Technologies in Health Research Grant, and Connaught Foundation. W. J. and H. F. would like to acknowledge the Ontario Government for the Ontario Graduate Scholarship, A. S. would like to acknowledge NSERC for summer undergraduate fellowship, and S. M. would like to acknowledge NSERC for graduate fellowship.
REFERENCES
[1]J.Y. Adams et al. Visualization of advanced human prostate cancer lesions in living mice by a targeted gene transfer vector and optical imaging. Nat. Med., 8(8):891–897, 2002.
[2]W.C.W. Chan et al. Luminescent quantum dots for multiplexed biological detection and imaging. Curr. Opini. Biotechnol., 13:40–46, 2002.