


Active cellular protrusion: continuum theories and models |
215 |
||
a monomer, we have |
|
|
|
n (bump) 10 kB T |
θn (bump) |
, |
(10.22) |
|
|||
VM |
|||
where n is the spatially averaged stress density that will contribute in the network momentum equation (Eq. 10.6). Note here that a proper treatment would integrate n from a network concentration of 0 to θn , including a threshold effect (see Fig. 10-3) and would also yield a θn2 term instead of θn . Considering the other uncertainties of the problem, we have preferred to sacrifice accuracy to simplicity.
If we use typical biological numbers, for example actin, VM = (4π/3)(2.7 × 10−7cm)3, and maximal volume fractions of cytoskeleton θn 2%, we obtain a maximum swelling stress of the cytoskeleton of order 105 dyn cm−2 (104 Pa, 100 cm H2O), the same as the maximum stress for the network–membrane interaction.
Network dynamics with swelling
It is obvious that network–network repulsion will tend to smooth out nonuniform cytoskletal distributions by expansion of overdense regions into underdense regions. It is thus of interest to look at the dynamics of a clump of network in a low-density environment. If the principal retarding force is taken to be viscosity of the network itself, simple dimensional analysis shows that the time scale of expansion is:
τ = |
ν |
(10.23) |
n . |
Of note is that there is no intrinsic scale to the problem; instead it is set by the length scale of the clump of overdense network d, and so the characteristic velocity is v = d/τ . In addition, if both ν and n have the same functional dependence (for example, linear) on the network volume fraction θn , then τ becomes independent of θn . We have used and provided experimental support for ν = ν0θn where ν0 = 6 × 10⁶ poise (Herant et al. 2003) and from the calculation above, the swelling stress n = 0n θn is such that at most 0n 5 × 10⁶ dyn cm−2 (there is no reason it cannot be much less), which gives a minimal expansion time scale of order one second.
Other theories of protrusion
For the sake of completeness, we would like to briefly touch upon alternative theories of protrusion that are not currently in vogue because they do not fit in the standard cartoon (Fig. 10-1). Of note is that all these theories are also amenable to modeling within the RIF formalism and that it is out of concern for keeping this survey within a reasonable length that we do not pursue a quantitative analysis for each of these models (see Fig. 10-4).
Hydrostatic pressure protrusion. Hydrostatic pressure-driven protrusion is a venerable model (Mast, 1926) that probably has applicability in a limited number of circumstances. The basic idea is that an increase in internal pressure (presumably due to contractile activity somewhere in the cell) leads to bulging and protrusion of the membrane. Hidden behind the apparent simplicity of the concept are a number of
216 M. Herant and M. Dembo
H2O 

 H2O
H2O
Cortical |
|
Shearing |
|
Contraction/Weakening |
Hypertonicity |
||
Myosins |
|||
|
Permeability |
||
|
|
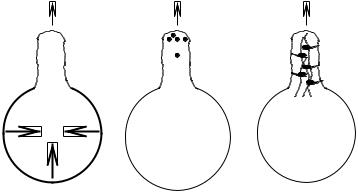
Fig. 10-4. Three alternative theories of cellular protrusion.
factors that merit consideration. In order for there to be a local protrusion of membrane, either the increase of hydrostatic pressure has to be local to the region, or the compliance of the cortical membrane must increase locally. Except in very large cells (for example, Amoeba proteus), or in compartmentalized organisms, the former condition is difficult to realize. This is because the hydraulic resistance to cytosolic flow through the cytoskeleton is typically extremely small. As a result, any local pressure excess tends to be quickly erased by solvent flow. The only way around this constraint is to have a large distance leading to a large hydraulic resistance, or an isolated compartment in which pressure can be locally increased without driving cytosolic flow to other parts of the cell.
The alternative is that of a local weakening of the cortical tension driving a local Marangoni-type of flow. Again there are some difficulties with such a mechanism. Recall that cell cortical tension is the result of contributions from the tension of the plasma membrane and from the cytoskeletal cortex underlying the membrane. It is unlikely that membrane tension can be lowered locally, because the massless, fluid-mosaic nature of the plasma membrane should make it a good conductor of stress that equilibrates surface tension rapidly around the cell. (Experimental and modeling evidence hint at the membrane tension being a global property of the cell, Raucher and Sheetz, 1999; Herant et al., 2003.) It is, however, possible for the cytoskeletal cortex to be locally weakened (see Lee et al., 1997). In a regime in which it carries substantial (tensile) stresses, such a weakening may result in pseudopod formation.
Hypertonic protrusion. Although as far as we are aware they have not been the subject of much recent study, models based on osmotic swelling accompanied by modified membrane permeability were once actively pursued, especially in the context of the extension of the acrosomal process of the Thyone sperm, a setting that may not have general applicability to ameboid protrusion (Oster and Perelson, 1987). Here the basic idea is that through the action of locally activated severing enzymes, osmotic tension