

СТАТИСТИКА 1 / Демографическая СТАТИСТИКА / 06WorldDataSheet - Население стран мира
.pdfP O P U L A T I O N R E F E R E N C E B U R E A U
inform |
empower |
advance |
www.prb.org |
2006World
Population
DATA SHEET


The World’s 10 Largest Countries in Population
|
2006 |
|
Population |
Country |
(millions) |
China |
1,311 |
India |
1,122 |
United States |
299 |
Indonesia |
225 |
Brazil |
187 |
Pakistan |
166 |
Bangladesh |
147 |
Russia |
142 |
Nigeria |
135 |
Japan |
128 |
2050 |
|
|
Population |
Country |
(millions) |
India |
1,628 |
China |
1,437 |
United States |
420 |
Nigeria |
299 |
Pakistan |
295 |
Indonesia |
285 |
Brazil |
260 |
Bangladesh |
231 |
Dem. Rep. of Congo |
183 |
Ethiopia |
145 |
The Top 15 HIV/AIDS Prevalence Countries (2005)
Africa |
|
|
Percent of |
Country |
population |
Swaziland |
33.4 |
Botswana |
24.1 |
Lesotho |
23.2 |
Zimbabwe |
20.1 |
Namibia |
19.6 |
South Africa |
18.8 |
Zambia |
17.0 |
Mozambique |
16.1 |
Malawi |
11.8 |
Central African Rep. |
10.7 |
Gabon |
7.9 |
Côte d’Ivoire |
7.1 |
Uganda |
6.7 |
Tanzania |
6.5 |
Kenya |
6.1 |
Outside Africa
|
Percent of |
Country |
population |
Haiti |
3.8 |
Bahamas |
3.3 |
Trinidad and Tobago |
2.6 |
Belize |
2.5 |
Guyana |
2.4 |
Suriname |
1.9 |
Papua New Guinea |
1.8 |
Cambodia |
1.6 |
Barbados |
1.5 |
Honduras |
1.5 |
Jamaica |
1.5 |
Thailand |
1.4 |
Ukraine |
1.4 |
Estonia |
1.3 |
Myanmar |
1.3 |
Countries With the
Highest Share of
Their Surface Area
Protected (2006)
|
|
Percent of |
Country |
surface area protected |
|
Venezuela |
|
63 |
China, Hong Kong SAR |
51 |
|
Zambia |
|
42 |
Liechtenstein |
|
40 |
Brunei |
|
38 |
Tanzania |
|
38 |
Saudi Arabia |
|
37 |
Dominican Republic |
33 |
|
Colombia |
|
32 |
Estonia |
|
31 |
Guatemala |
|
31 |
Belize |
|
30 |
Botswana |
|
30 |
Germany |
|
30 |
Switzerland |
|
29 |
Protected area as a percentage of a country’s total surface area is an indicator for the UN Millennium Development Goals. Protected areas contribute to environmental sustainability in multiple ways by maintaining biodiversity, safeguarding genetic resources, preventing soils from eroding, and supporting local livelihoods. They can provide valuable social and economic benefits. However, designation of protected areas alone is not sufficient to ensure these benefits. Protected areas must be carefully selected and managed for conservation goals.
© 2006 Population Reference Bureau |
2006 World Population Data Sheet 1 |
W O R L D P O P U L A T I O N H I G H L I G H T S
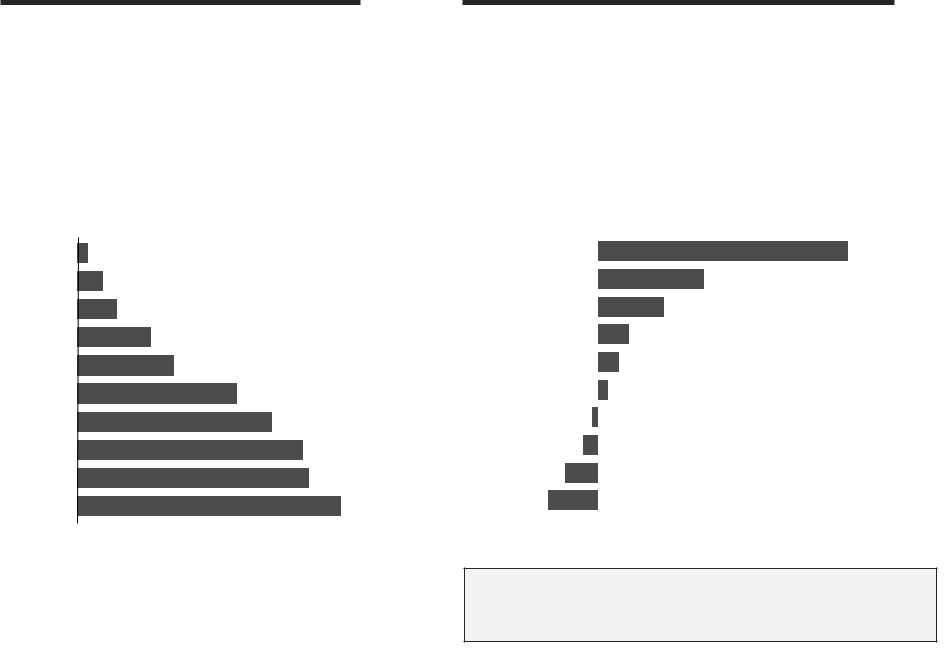
In Many—But Not All—Countries, Most Married Women Wish to Limit Childbearing to Two Children.
One very useful indicator of women’s ability to limit their number of children—and of the prospect for future fertility decline—is their desire to cease childbearing. In Vietnam, 92 percent of women who had two living children said that they did not wish to have any more children. In Nigeria, by contrast, that figure was only 4 percent.
Percent of married reproductive-age women with two living children who do not want another child
Nigeria |
4 |
|
(2003) |
||
|
||
Cameroo |
9 |
|
(2004) |
||
|
||
Jordan |
14 |
|
(2002) |
||
|
||
Madagascar |
26 |
|
(2003–04) |
||
|
||
Kenya |
34 |
|
(2003) |
||
|
||
Philippines |
56 |
|
(2003) |
||
|
||
Bangladesh |
68 |
|
(2004) |
||
|
||
Colombi |
79 |
|
(2005) |
||
|
||
Romania |
81 |
|
(1999) |
||
|
||
Vietnam |
92 |
|
(2002) |
||
|
Sources: ORC Macro, MEASURE DHS STAT compiler, 2006; and Romanian Association of Public Health and Health Management and U.S. Centers for Disease Control and Prevention,
Reproductive Health Survey, Romania, 1999 (2001).
Net Migration Rates Vary Dramatically
Around the World.
International migrants make up about 3 percent of the world’s population. Economic conditions, social and political tensions, and historical traditions can influence a nation’s level of migration. Net migration rates can mask offsetting trends (such as immigration of unskilled workers along with emigration of more-educated residents). Migration trends vary over time. For example, the Netherlands recently experienced a net outflow of people for the first time since the early 1980s.
Net migration rate per 1,000 population (2005)
Ireland |
13.0 |
Australia |
5.5 |
United States |
3.4 |
France |
1.6 |
South Africa |
1.1 |
Costa Rica |
0.5 |
Poland |
-0.3 |
|
|
South Korea |
-0.8 |
|
|
Netherlands |
-1.7 |
|
|
Lithuania |
-2.6 |
|
|
|
|
Source: PRB, 2006 World Population Data Sheet.
For the graphic, “Many Governments Have Policies to Address Fertility Levels,” please go to www.prb.org/wpds/map.pdf.
© 2006 Population Reference Bureau |
2006 World Population Data Sheet 2 |

W O R L D P O P U L A T I O N H I G H L I G H T S
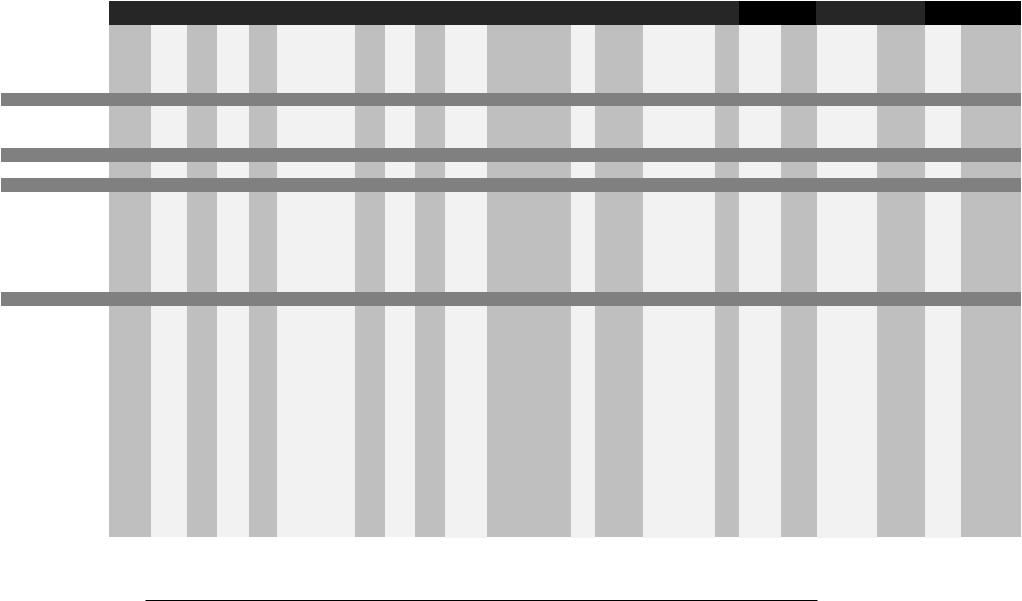
In Many Parts of the World, Rural Populations Still Lack Adequate Sanitation.
Worldwide, only 58 percent of the population has access to one of life’s most fundamental needs: adequate or improved sanitation facilities. There are, however, wide regional and rural/urban disparities. In developing regions, only one-quarter to onehalf of all rural residents have access to improved sanitation.
Percent of population with access to improved sanitation (2002)
South Centra |
25 |
Rural |
Asia |
66 |
Urban |
Sub-Saharan |
26 |
|
Africa |
55 |
|
East Asia |
32 |
74 |
|
||
|
|
|
Latin America & |
44 |
84 |
the Caribbean |
|
|
Southeast Asia |
50 |
79 |
|
||
|
|
|
Western Asia |
50 |
94 |
|
||
|
|
|
Northern Africa |
49 |
82 |
|
||
|
|
|
More Developed |
|
92 |
Regions |
|
100 |
|
|
|
Source: UNICEF and WHO, Country, Regional, and Global Estimates on Water and Sanitation (2004).
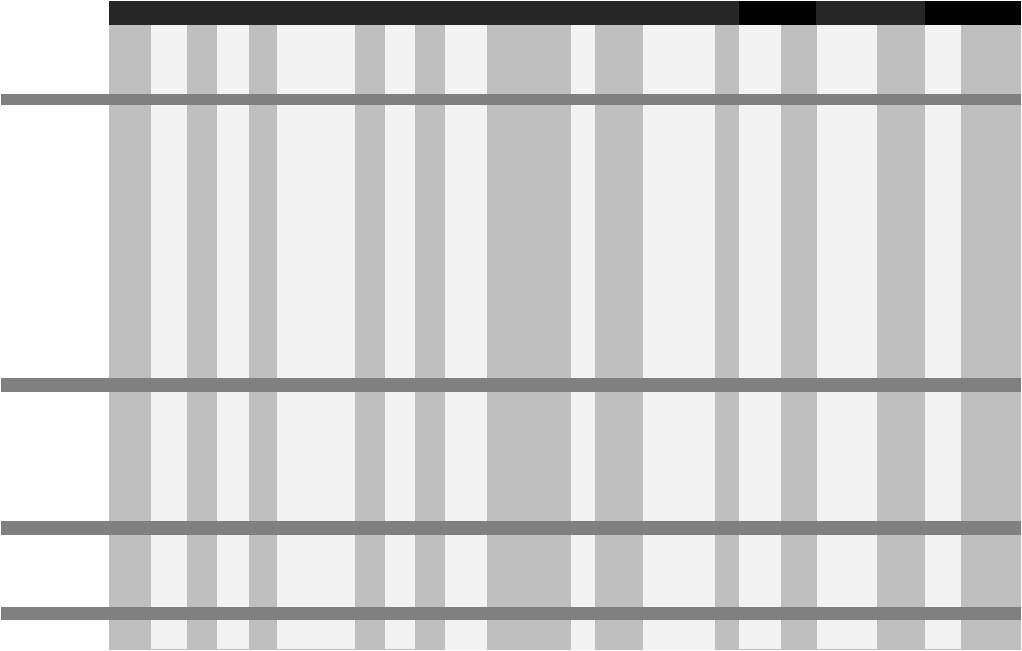
In Some Poor Countries, More Than
One-Fourth of Adolescent Girls Have
Given Birth.
Fertility among women ages 15 to 19 presents a special concern, as these young women may lack the physical development and social support needed to carry a pregnancy to full term. Early childbearing can also curtail a young woman’s education and reduce her potential earnings. Adolescents in the poorest countries—particularly in sub-Saharan Africa—are more likely to have given birth than adolescents in other countries.
Percent of women ages 15–19 who have given birth
Morocco |
4 |
|
(2003–04) |
||
|
||
Ukraine |
6 |
|
(1999) |
||
|
||
Ghana |
10 |
|
(2003) |
||
|
||
Colombi |
16 |
|
(2005) |
||
|
||
Dominican Republic |
19 |
|
(2002) |
||
Nigeria |
21 |
|
(2003) |
||
Bangladesh |
28 |
|
(2004) |
||
Chad |
30 |
|
(2004) |
||
Mozambique |
34 |
|
(2003) |
||
|
|
Sources: ORC Macro, MEASURE DHS STAT compiler, 2006; and Centers for Disease Control and Prevention and Macro International, Reproductive, Maternal and Child Health in Eastern Europe and Eurasia: A Comparative Report (2003).
© 2006 Population Reference Bureau |
2006 World Population Data Sheet 3 |

W O R L D P O P U L A T I O N H I G H L I G H T S
Gains in Life Expectancy Since the 1950s Have Not Been Uniform.
In the early 1950s, life expectancy in China, Vietnam, Honduras, and Kenya was about 40 years—more than 30 years lower than in Sweden. Over the past half-century, China, Vietnam, and Honduras have each improved life expectancy by about 30 years—although they have taken different paths. For example, China experienced dramatic health improvements in the 1960s, while Vietnam’s improvements became more pronounced in the 1970s and 1980s. As for Kenya, the HIV/AIDS crisis of the last 25 years has reversed much of the life expectancy gains of earlier decades.
Life expectancy at birth (years)
90 |
|
|
|
|
|
80 |
|
|
|
|
|
Sweden |
|
|
|
|
|
70 |
|
China |
|
|
|
|
|
|
Honduras |
||
60 |
|
|
|
||
|
|
|
|
|
|
50 |
|
|
|
|
Kenya |
|
|
Vietnam |
|
|
|
40 |
|
|
|
|
|
|
|
|
|
|
|
30 |
|
|
|
|
|
20 |
|
|
|
|
|
10 |
|
|
|
|
|
0 |
|
|
|
|
|
1950– |
1960– |
1970– |
1980– |
1990– |
2000– |
1955 |
1965 |
1975 |
1985 |
1995 |
2005 |
In Some Industrialized Countries,
a Significant Share of the Population
Lives in Economic Distress.
Almost everyone in the world’s more developed countries lives well above the international poverty threshold of US$2 a day ($730 annually). That does not mean, however, that all persons in the industrialized world are economically welloff. Indeed, in many industrialized countries, more than one-tenth of residents have incomes below 50 percent of their country’s median household income.
Percent of population in relative poverty (around 2000).
Norway |
6.4 |
Germany |
8.3 |
Canada |
11.4 |
United Kingdom |
12.4 |
Italy |
12.7 |
Ireland |
16.5 |
United States |
17.0 |
Russia |
18.8 |
|
|
Source: Luxembourg Income Study, LIS Key Figures (www.lisproject.org, accessed July 23, 2006).
Source: United Nations Population Division, World Population Prospects: The 2004 Revision.
© 2006 Population Reference Bureau |
2006 World Population Data Sheet 4 |
|
|
|
Demographic Data and Estimates for the Countries and Regions of the World |
|
|
|
Economy |
Area & Density |
Environment |
|
||||||||||||||||||||||
|
|
|
|
|
|
|
|
|
Projected |
|
|
|
|
|
|
|
|
|
|
|
|
|
|
|
|
|
|
Population |
|
|
|
|
|
|
|
|
|
|
|
|
|
Pop. |
|
|
|
|
|
|
|
|
|
% of |
Percent of Married |
Govt. |
GNI |
% Pop. |
|
Percent of |
Pop. With Access |
|
|||||
|
|
|
Deaths |
Rate of |
Net |
|
|
|
Change |
|
|
Percent |
|
|
Life Expectancy |
|
Population |
Women 15–49 Using |
View |
PPP |
Living |
|
Density |
Surface |
to Improved |
|
||||||
|
Population |
Births per |
per |
Natural |
Migration |
Projected Population |
2006– |
Infant |
Total |
of Pop. |
|
|
at Birth |
|
|
Ages 15–49 |
Contraception |
of the |
per |
Below |
Area of |
per |
Area |
Sanitation (%) |
|
|||||||
|
mid–2006 |
1,000 |
1,000 |
Increase |
per 1,000 |
(millions) |
2050 |
Mortality |
Fertility |
of Age |
|
|
(years) |
|
% |
with HIV/AIDS |
All |
Modern |
|
Birth |
Capita |
US$2 |
Country |
Square |
Protected |
2002 |
|
|
||||
|
|
|
|
|
|
|
|
|||||||||||||||||||||||||
|
(millions) |
Population |
Pop. |
(percent) |
Pop. |
mid–2025 |
mid–2050 |
|
(%) |
Ratea |
Rateb |
<15 |
65+ |
|
Total |
Males |
Females |
Urban 2003 |
2005 |
Methods |
Methods |
Ratec |
2005 |
per Day |
(Square Miles) |
Mile |
2006 |
Urban |
Rural |
|
||
WORLD |
6,555 |
21 |
9 |
1.2 |
0 |
7,940 |
9,243 |
|
41 |
52 |
2.7 |
29 |
7 |
67 |
65 |
69 |
48 |
1.0 |
1.0 |
61 |
54 |
|
|
$9,190 |
53 |
51,789,601 |
127 |
12 |
81 |
37 |
|
|
MORE DEVELOPED |
1,216 |
11 |
10 |
0.1 |
2 |
1,255 |
1,261 |
|
4 |
6 |
1.6 |
17 |
15 |
77 |
73 |
80 |
77 |
0.5 |
0.5 |
68 |
58 |
|
|
27,790 |
— |
19,814,584 |
61 |
14 |
100 |
92 |
|
|
LESS DEVELOPED |
5,339 |
23 |
8 |
1.5 |
-1 |
6,685 |
7,982 |
|
50 |
57 |
2.9 |
32 |
5 |
65 |
64 |
67 |
41 |
1.2 |
1.2 |
59 |
53 |
|
|
4,950 |
56 |
31,975,017 |
167 |
12 |
73 |
31 |
|
|
LESS DEVELOPED (Excl. China) |
4,028 |
27 |
9 |
1.8 |
-1 |
5,209 |
6,545 |
|
63 |
61 |
3.4 |
35 |
5 |
63 |
62 |
65 |
42 |
1.5 |
1.6 |
50 |
42 |
|
|
4,410 |
59 |
28,278,917 |
142 |
12 |
74 |
32 |
|
|
AFRICA |
924 |
38 |
15 |
2.3 |
-0 |
1,355 |
1,994 |
|
116 |
84 |
5.1 |
42 |
3 |
52 |
51 |
53 |
37 |
4.9 |
4.9 |
28 |
22 |
|
|
2,480 |
66 |
11,698,111 |
79 |
10 |
62 |
30 |
|
|
SUB-SAHARAN AFRICA |
767 |
40 |
16 |
2.4 |
-0 |
1,151 |
1,749 |
|
128 |
90 |
5.5 |
44 |
3 |
48 |
47 |
49 |
34 |
6.2 |
6.1 |
22 |
15 |
|
|
1,970 |
— |
9,379,573 |
82 |
11 |
55 |
26 |
|
|
NORTHERN AFRICA |
198 |
26 |
6 |
2.0 |
-1 |
265 |
329 |
|
66 |
42 |
3.2 |
35 |
4 |
69 |
67 |
70 |
47 |
0.4 |
0.4 |
49 |
44 |
|
|
4,350 |
29 |
3,286,031 |
60 |
5 |
82 |
49 |
|
|
Algeria |
33.5 |
21 |
4 |
1.7 |
-1 |
43.1 |
49.7 |
|
48 |
30 |
2.4 |
31 |
5 |
75 |
74 |
76 |
49 |
0.1 |
0.1 |
57 |
52 |
|
H |
6,770 |
15 |
919,591 |
36 |
5 |
99 |
82 |
|
|
Egypt |
75.4 |
27 |
6 |
2.1 |
-1 |
101.1 |
125.9 |
|
67 |
33 |
3.1 |
35 |
5 |
70 |
67 |
72 |
43 |
<0.1 |
<0.1 |
59 |
57 |
|
H |
4,440 |
44 |
386,660 |
195 |
13 |
84 |
56 |
|
|
Libya |
5.9 |
27 |
4 |
2.4 |
0 |
8.3 |
10.8 |
|
83 |
26 |
3.4 |
34 |
4 |
76 |
74 |
78 |
86 |
— |
— |
49 |
26 |
|
S |
— |
— |
679,359 |
9 |
z |
97 |
96 |
|
|
Morocco |
31.7 |
21 |
6 |
1.6 |
-1 |
38.8 |
45.2 |
|
43 |
40 |
2.5 |
30 |
5 |
70 |
68 |
72 |
55 |
0.1 |
0.1 |
63 |
55 |
|
S |
4,360 |
14 |
172,413 |
184 |
1 |
83 |
31 |
|
|
Sudan |
41.2 |
36 |
9 |
2.6 |
-3 |
61.3 |
84.2 |
|
104 |
64 |
5.0 |
44 |
2 |
58 |
57 |
59 |
36 |
1.6 |
1.6 |
10 |
7 |
|
H |
2,000 |
— |
967,494 |
43 |
5 |
50 |
24 |
|
|
Tunisia |
10.1 |
17 |
6 |
1.1 |
-1 |
11.6 |
12.2 |
|
20 |
21 |
2.0 |
27 |
7 |
73 |
71 |
75 |
65 |
0.1 |
0.1 |
63 |
53 |
|
S |
7,900 |
7 |
63,170 |
160 |
1 |
90 |
62 |
|
|
Western Sahara |
0.4 |
28 |
8 |
2.0 |
6 |
0.7 |
0.9 |
|
152 |
53 |
3.9 |
34 |
3 |
64 |
62 |
66 |
93 |
— |
— |
— |
— |
— |
— |
— |
97,344 |
4 |
7 |
— |
— |
|
||
WESTERN AFRICA |
271 |
43 |
17 |
2.6 |
-0 |
414 |
637 |
|
135 |
102 |
5.8 |
44 |
3 |
48 |
47 |
48 |
40 |
3.1 |
3.2 |
14 |
9 |
|
|
1,270 |
83 |
2,370,015 |
114 |
7 |
54 |
25 |
|
|
Benin |
8.7 |
41 |
12 |
2.9 |
2 |
14.3 |
22.1 |
|
154 |
102 |
5.6 |
44 |
3 |
54 |
53 |
55 |
40 |
2.0 |
1.8 |
19 |
7 |
|
H |
1,110 |
74 |
43,483 |
200 |
23 |
58 |
12 |
|
|
Burkina Faso |
13.6 |
44 |
19 |
2.5 |
1 |
23.2 |
39.1 |
|
187 |
81 |
6.2 |
46 |
3 |
48 |
48 |
49 |
16 |
2.1 |
2.0 |
14 |
9 |
|
H |
1,220 |
72 |
105,792 |
129 |
15 |
45 |
5 |
|
|
Cape Verde |
0.5 |
30 |
5 |
2.5 |
-6 |
0.7 |
0.9 |
|
90 |
28 |
3.5 |
38 |
6 |
71 |
68 |
74 |
55 |
— |
— |
53 |
46 |
|
H |
6,000 |
— |
1,556 |
312 |
z |
61 |
19 |
|
|
Côte d’Ivoire |
19.7 |
39 |
14 |
2.5 |
4 |
27.1 |
36.1 |
|
84 |
104 |
5.1 |
41 |
3 |
51 |
49 |
53 |
47 |
7.0 |
7.1 |
15 |
7 |
|
H |
1,490 |
49 |
124,502 |
158 |
16 |
61 |
23 |
|
|
Gambia |
1.5 |
38 |
12 |
2.7 |
3 |
2.4 |
3.7 |
|
148 |
75 |
5.1 |
42 |
3 |
53 |
52 |
55 |
50 |
2.2 |
2.4 |
10 |
9 |
|
H |
1,920 |
83 |
4,363 |
338 |
4 |
72 |
46 |
|
|
Ghana |
22.6 |
33 |
10 |
2.3 |
-0 |
32.7 |
47.3 |
|
110 |
59 |
4.4 |
39 |
4 |
57 |
57 |
58 |
44 |
2.3 |
2.3 |
25 |
19 |
|
H |
2,370 |
79 |
92,100 |
245 |
15 |
74 |
46 |
|
|
Guinea |
9.8 |
41 |
13 |
2.8 |
-6 |
15.2 |
23.5 |
|
139 |
98 |
5.7 |
46 |
4 |
54 |
54 |
54 |
30 |
1.6 |
1.5 |
9 |
6 |
|
H |
2,240 |
— |
94,927 |
103 |
6 |
25 |
6 |
|
|
Guinea–Bissau |
1.4 |
50 |
20 |
3.0 |
-1 |
2.4 |
4.4 |
|
225 |
116 |
7.1 |
53 |
3 |
45 |
44 |
46 |
48 |
3.8 |
3.8 |
8 |
4 |
|
H |
700 |
— |
13,946 |
97 |
7 |
57 |
23 |
|
|
Liberia |
3.4 |
50 |
21 |
2.9 |
-8 |
5.8 |
10.7 |
|
217 |
142 |
6.8 |
47 |
2 |
43 |
41 |
44 |
45 |
— |
— |
— |
— |
H |
— |
— |
43,000 |
78 |
13 |
49 |
7 |
|
||
Mali |
13.9 |
50 |
18 |
3.2 |
-2 |
24.0 |
42.0 |
|
202 |
130 |
7.1 |
48 |
3 |
49 |
48 |
49 |
30 |
1.8 |
1.7 |
8 |
6 |
|
H |
1,000 |
91 |
478,838 |
29 |
2 |
59 |
38 |
|
|
Mauritania |
3.2 |
42 |
14 |
2.8 |
2 |
5.0 |
7.5 |
|
137 |
74 |
5.8 |
43 |
3 |
54 |
53 |
55 |
40 |
0.7 |
0.7 |
8 |
5 |
|
H |
2,150 |
63 |
395,954 |
8 |
2 |
64 |
9 |
|
|
Niger |
14.4 |
55 |
21 |
3.4 |
0 |
26.4 |
50.2 |
|
248 |
149 |
7.9 |
49 |
2 |
44 |
44 |
44 |
21 |
1.1 |
1.1 |
14 |
4 |
|
H |
800 |
86 |
489,189 |
29 |
7 |
43 |
4 |
|
|
Nigeria |
134.5 |
43 |
19 |
2.4 |
-0 |
199.5 |
298.8 |
|
122 |
100 |
5.9 |
43 |
3 |
44 |
43 |
44 |
44 |
3.7 |
3.9 |
12 |
8 |
|
H |
1,040 |
92 |
356,668 |
377 |
6 |
48 |
30 |
|
|
Senegal |
11.9 |
39 |
10 |
2.9 |
-2 |
17.3 |
23.1 |
|
94 |
61 |
5.3 |
44 |
3 |
56 |
55 |
58 |
45 |
0.9 |
0.9 |
12 |
10 |
|
H |
1,770 |
63 |
75,954 |
157 |
11 |
70 |
34 |
|
|
Sierra Leone |
5.7 |
46 |
23 |
2.3 |
-3 |
8.7 |
13.8 |
|
143 |
163 |
6.5 |
43 |
3 |
41 |
39 |
42 |
36 |
1.6 |
1.6 |
4 |
4 |
|
H |
780 |
75 |
27,699 |
205 |
4 |
53 |
30 |
|
|
Togo |
6.3 |
38 |
12 |
2.6 |
0 |
9.6 |
13.5 |
|
115 |
90 |
5.1 |
44 |
3 |
55 |
53 |
57 |
33 |
3.2 |
3.2 |
26 |
9 |
|
H |
1,550 |
— |
21,927 |
288 |
11 |
71 |
15 |
|
|
NOTES
(—) Indicates data unavailable or inapplicable. z Rounds to zero.
aInfant deaths per 1,000 live births. Rates shown with decimals indicate national statistics reported as completely registered, while those without are estimates from the sources cited on reverse.
Rates shown in italics are based upon fewer than 50 annual infant deaths and, as a result, are subject to considerable yearly variability.
b Average number of children born to a woman during her lifetime. c H=too high; S=satisfactory; L=too low.
d Special Administrative Region. e The former Yugoslav Republic.
f Data are for the former Serbia and Montenegro. * Data prior to 2000 are shown in italics.
Data prepared by PRB demographer Carl Haub.
© 2006 Population Reference Bureau |
2006 World Population Data Sheet 5 |
|
|
|
Demographic Data and Estimates for the Countries and Regions of the World |
|
|
|
Economy |
Area & Density |
Environment |
|
||||||||||||||||||||||
|
|
|
|
|
|
|
|
|
Projected |
|
|
|
|
|
|
|
|
|
|
|
|
|
|
|
|
|
|
Population |
|
|
|
|
|
|
|
|
|
|
|
|
|
Pop. |
|
|
|
|
|
|
|
|
|
% of |
Percent of Married |
Govt. |
GNI |
% Pop. |
|
Percent of |
Pop. With Access |
|
|||||
|
|
|
Deaths |
Rate of |
Net |
|
|
|
Change |
|
|
Percent |
|
|
Life Expectancy |
|
Population |
Women 15–49 Using |
View |
PPP |
Living |
|
Density |
Surface |
to Improved |
|
||||||
|
Population |
Births per |
per |
Natural |
Migration |
Projected Population |
2006– |
Infant |
Total |
of Pop. |
|
|
at Birth |
|
|
Ages 15–49 |
Contraception |
of the |
per |
Below |
Area of |
per |
Area |
Sanitation (%) |
|
|||||||
|
mid–2006 |
1,000 |
1,000 |
Increase |
per 1,000 |
(millions) |
2050 |
Mortality |
Fertility |
of Age |
|
|
(years) |
|
% |
with HIV/AIDS |
All |
Modern |
|
Birth |
Capita |
US$2 |
Country |
Square |
Protected |
2002 |
|
|||||
|
|
|
|
|
|
|
||||||||||||||||||||||||||
|
(millions) |
Population |
Pop. |
(percent) |
Pop. |
mid–2025 |
mid–2050 |
|
(%) |
Ratea |
Rateb |
<15 |
65+ |
|
Total |
Males |
Females |
Urban 2003 |
2005 |
Methods |
Methods |
Ratec |
2005 |
per Day |
(Square Miles) |
Mile |
2006 |
Urban |
Rural |
|
||
EASTERN AFRICA |
284 |
41 |
16 |
2.4 |
-0 |
432 |
664 |
|
133 |
81 |
5.5 |
44 |
3 |
47 |
46 |
47 |
24 |
— |
— |
24 |
19 |
|
|
1,090 |
79 |
2,456,184 |
116 |
18 |
50 |
26 |
|
|
Burundi |
7.8 |
46 |
18 |
2.7 |
7 |
14.0 |
25.8 |
|
229 |
106 |
6.8 |
46 |
3 |
45 |
44 |
45 |
9 |
3.3 |
3.3 |
16 |
10 |
|
H |
640 |
88 |
10,745 |
729 |
6 |
47 |
35 |
|
|
Comoros |
0.7 |
37 |
7 |
2.9 |
-2 |
1.0 |
1.5 |
|
118 |
59 |
4.9 |
43 |
3 |
64 |
62 |
66 |
33 |
<0.1 |
<0.1 |
26 |
19 |
|
H |
2,000 |
— |
861 |
803 |
3 |
38 |
15 |
|
|
Djibouti |
0.8 |
31 |
12 |
1.9 |
-5 |
1.1 |
1.5 |
|
92 |
100 |
4.0 |
40 |
3 |
53 |
52 |
54 |
82 |
3.1 |
3.1 |
9 |
6 |
|
H |
2,240 |
— |
8,958 |
90 |
0 |
55 |
27 |
|
|
Eritrea |
4.6 |
39 |
11 |
2.8 |
9 |
7.4 |
11.2 |
|
146 |
61 |
5.3 |
45 |
2 |
55 |
53 |
57 |
19 |
2.4 |
2.4 |
8 |
5 |
|
H |
1,010 |
— |
45,405 |
100 |
3 |
34 |
3 |
|
|
Ethiopia |
74.8 |
39 |
15 |
2.4 |
-0 |
107.8 |
144.7 |
|
94 |
77 |
5.4 |
44 |
3 |
49 |
48 |
50 |
15 |
— |
— |
15 |
14 |
|
H |
1,000 |
78 |
426,371 |
175 |
17 |
19 |
4 |
|
|
Kenya |
34.7 |
40 |
15 |
2.5 |
0 |
49.4 |
64.8 |
|
87 |
77 |
4.9 |
43 |
2 |
48 |
49 |
47 |
36 |
6.8 |
6.1 |
39 |
32 |
|
H |
1,170 |
58 |
224,081 |
155 |
13 |
56 |
43 |
|
|
Madagascar |
17.8 |
40 |
12 |
2.7 |
0 |
28.2 |
41.8 |
|
135 |
83 |
5.2 |
45 |
3 |
55 |
53 |
57 |
26 |
0.5 |
0.5 |
27 |
17 |
|
H |
880 |
85 |
226,656 |
78 |
3 |
49 |
27 |
|
|
Malawi |
12.8 |
44 |
18 |
2.6 |
-0 |
23.8 |
44.4 |
|
248 |
76 |
6.0 |
47 |
3 |
45 |
44 |
47 |
14 |
— |
11.8 |
33 |
28 |
|
H |
650 |
76 |
45,745 |
279 |
16 |
66 |
42 |
|
|
Mauritius |
1.3 |
15 |
7 |
0.8 |
0 |
1.4 |
1.5 |
|
20 |
14.8 |
1.8 |
24 |
7 |
72 |
69 |
76 |
42 |
0.2 |
0.6 |
76 |
42 |
|
S |
12,450 |
— |
788 |
1,592 |
1 |
100 |
99 |
|
|
Mayotte |
0.2 |
39 |
3 |
3.6 |
5 |
0.3 |
0.6 |
|
195 |
— |
4.5 |
42 |
2 |
74 |
72 |
76 |
28 |
— |
— |
— |
— |
— |
— |
— |
145 |
1,297 |
17 |
— |
— |
|
||
Mozambique |
19.9 |
41 |
20 |
2.0 |
-0 |
27.6 |
37.6 |
|
89 |
108 |
5.4 |
43 |
3 |
42 |
41 |
42 |
32 |
16.0 |
16.1 |
17 |
12 |
|
H |
1,170 |
78 |
309,494 |
64 |
9 |
51 |
14 |
|
|
Reunion |
0.8 |
19 |
5 |
1.4 |
2 |
1.0 |
1.1 |
|
34 |
7 |
2.4 |
27 |
7 |
77 |
72 |
80 |
89 |
— |
— |
70 |
— |
— |
— |
— |
969 |
818 |
3 |
— |
— |
|
||
Rwanda |
9.1 |
43 |
17 |
2.7 |
-0 |
13.8 |
20.6 |
|
128 |
86 |
6.1 |
47 |
2 |
47 |
46 |
48 |
17 |
3.8 |
3.1 |
17 |
10 |
|
H |
1,320 |
84 |
10,170 |
890 |
8 |
56 |
38 |
|
|
Seychelles |
0.1 |
18 |
8 |
1.0 |
-21 |
0.1 |
0.1 |
|
13 |
16 |
2.1 |
26 |
8 |
71 |
66 |
76 |
50 |
— |
— |
— |
— |
S |
15,940 |
— |
174 |
460 |
1 |
— |
100 |
|
||
Somalia |
8.9 |
46 |
17 |
2.9 |
5 |
14.9 |
25.5 |
|
188 |
119 |
6.9 |
45 |
3 |
48 |
46 |
50 |
34 |
0.9 |
0.9 |
8 |
1 |
|
S |
— |
— |
246,201 |
36 |
1 |
47 |
14 |
|
|
Tanzania |
37.9 |
42 |
17 |
2.5 |
-2 |
53.6 |
72.7 |
|
92 |
68 |
5.7 |
44 |
4 |
45 |
44 |
45 |
32 |
6.6 |
6.5 |
26 |
20 |
|
H |
730 |
90 |
364,900 |
104 |
38 |
54 |
41 |
|
|
Uganda |
27.7 |
47 |
16 |
3.1 |
-1 |
55.5 |
130.1 |
|
371 |
81 |
6.9 |
50 |
3 |
47 |
47 |
47 |
12 |
6.8 |
6.7 |
20 |
19 |
|
H |
1,500 |
— |
93,066 |
297 |
26 |
53 |
39 |
|
|
Zambia |
11.9 |
41 |
23 |
1.9 |
-2 |
16.4 |
22.8 |
|
92 |
92 |
5.7 |
45 |
3 |
37 |
38 |
37 |
35 |
16.9 |
17.0 |
34 |
23 |
|
H |
950 |
94 |
290,583 |
41 |
42 |
68 |
32 |
|
|
Zimbabwe |
13.1 |
30 |
23 |
0.7 |
-1 |
14.4 |
15.8 |
|
21 |
61 |
3.6 |
41 |
3 |
37 |
38 |
37 |
34 |
22.1 |
20.1 |
54 |
50 |
|
H |
1,940 |
83 |
150,873 |
87 |
15 |
69 |
51 |
|
|
MIDDLE AFRICA |
116 |
44 |
16 |
2.8 |
-0 |
190 |
309 |
|
166 |
98 |
6.3 |
46 |
3 |
48 |
47 |
50 |
35 |
4.0 |
4.0 |
26 |
6 |
|
|
1,310 |
— |
2,553,151 |
45 |
11 |
47 |
22 |
|
|
Angola |
15.8 |
49 |
22 |
2.6 |
2 |
25.9 |
42.0 |
|
165 |
139 |
6.8 |
47 |
3 |
41 |
39 |
42 |
33 |
3.7 |
3.7 |
6 |
5 |
|
H |
2,210 |
— |
481,351 |
33 |
12 |
56 |
16 |
|
|
Cameroon |
17.3 |
37 |
14 |
2.3 |
-0 |
24.3 |
32.3 |
|
87 |
74 |
4.9 |
43 |
3 |
51 |
50 |
52 |
53 |
5.5 |
5.4 |
26 |
13 |
|
H |
2,150 |
51 |
183,568 |
94 |
9 |
63 |
33 |
|
|
Central African Republic |
4.3 |
37 |
19 |
1.7 |
0 |
5.5 |
6.5 |
|
51 |
94 |
4.9 |
43 |
4 |
44 |
43 |
44 |
41 |
10.8 |
10.7 |
28 |
7 |
|
S |
1,140 |
84 |
240,533 |
18 |
16 |
47 |
12 |
|
|
Chad |
10.0 |
48 |
20 |
2.8 |
-3 |
17.2 |
31.5 |
|
214 |
101 |
6.7 |
47 |
3 |
44 |
43 |
45 |
24 |
3.4 |
3.5 |
11 |
2 |
|
S |
1,470 |
— |
495,753 |
20 |
9 |
30 |
0 |
|
|
Congo |
3.7 |
40 |
14 |
2.6 |
-6 |
5.9 |
9.7 |
|
161 |
75 |
5.3 |
45 |
3 |
51 |
50 |
52 |
52 |
5.4 |
5.3 |
44 |
13 |
|
H |
810 |
— |
132,046 |
28 |
14 |
14 |
2 |
|
|
Congo, Dem. Rep. of |
62.7 |
45 |
14 |
3.1 |
0 |
108.0 |
183.2 |
|
192 |
95 |
6.7 |
48 |
3 |
50 |
49 |
52 |
30 |
3.2 |
3.2 |
31 |
4 |
|
S |
720 |
— |
905,351 |
69 |
8 |
43 |
23 |
|
|
Equatorial Guinea |
0.5 |
43 |
20 |
2.3 |
0 |
0.8 |
1.1 |
|
127 |
102 |
5.6 |
44 |
4 |
44 |
43 |
44 |
39 |
3.2 |
3.2 |
— |
— |
S |
7,580 |
— |
10,830 |
47 |
14 |
60 |
46 |
|
||
Gabon |
1.4 |
33 |
13 |
2.0 |
-2 |
1.8 |
2.3 |
|
62 |
57 |
4.3 |
40 |
4 |
54 |
53 |
55 |
81 |
7.7 |
7.9 |
33 |
12 |
|
L |
5,890 |
— |
103,347 |
14 |
16 |
37 |
30 |
|
|
Sao Tome and Principe |
0.2 |
34 |
9 |
2.5 |
-3 |
0.2 |
0.3 |
|
94 |
80 |
4.1 |
42 |
4 |
63 |
62 |
64 |
38 |
— |
— |
29 |
27 |
|
H |
— |
— |
371 |
410 |
— |
32 |
20 |
|
|
SOUTHERN AFRICA |
54 |
24 |
19 |
0.5 |
1 |
55 |
55 |
|
3 |
55 |
2.9 |
33 |
5 |
46 |
44 |
48 |
50 |
19.3 |
19.5 |
54 |
53 |
|
|
11,460 |
36 |
1,032,730 |
52 |
14 |
84 |
41 |
|
|
Botswana |
1.8 |
26 |
27 |
-0.1 |
-1 |
1.7 |
1.7 |
|
-6 |
56 |
3.1 |
38 |
3 |
34 |
35 |
33 |
54 |
24.0 |
24.1 |
40 |
39 |
|
H |
10,250 |
50 |
224,606 |
8 |
30 |
57 |
25 |
|
|
Lesotho |
1.8 |
28 |
25 |
0.3 |
-4 |
1.7 |
1.6 |
|
-11 |
91 |
3.5 |
39 |
5 |
36 |
35 |
36 |
13 |
23.7 |
23.2 |
37 |
35 |
|
H |
3,410 |
56 |
11,718 |
154 |
z |
61 |
32 |
|
|
Namibia |
2.1 |
29 |
15 |
1.4 |
-0 |
2.5 |
3.1 |
|
49 |
44 |
3.9 |
43 |
3 |
47 |
47 |
47 |
33 |
19.5 |
19.6 |
44 |
43 |
|
S |
7,910 |
56 |
318,259 |
6 |
15 |
66 |
14 |
|
|
South Africa |
47.3 |
23 |
18 |
0.5 |
1 |
48.0 |
48.4 |
|
2 |
54 |
2.8 |
32 |
5 |
47 |
45 |
49 |
53 |
18.6 |
18.8 |
56 |
55 |
|
S |
12,120 |
34 |
471,444 |
100 |
6 |
86 |
44 |
|
|
Swaziland |
1.1 |
29 |
28 |
0.1 |
-1 |
1.0 |
0.8 |
|
-34 |
74 |
3.7 |
41 |
3 |
34 |
33 |
35 |
23 |
32.4 |
33.4 |
28 |
26 |
|
H |
5,190 |
— |
6,703 |
169 |
3 |
78 |
44 |
|
|
NORTHERN AMERICA |
332 |
14 |
8 |
0.6 |
4 |
387 |
462 |
|
39 |
7 |
2.0 |
20 |
12 |
78 |
75 |
81 |
79 |
0.6 |
0.6 |
73 |
69 |
|
|
40,980 |
— |
7,699,508 |
43 |
17 |
100 |
100 |
|
|
Canada |
32.6 |
11 |
7 |
0.3 |
7 |
37.6 |
41.9 |
|
29 |
5.3 |
1.5 |
18 |
13 |
80 |
77 |
82 |
79 |
0.3 |
0.3 |
75 |
73 |
|
L |
32,220 |
— |
3,849,670 |
8 |
7 |
100 |
99 |
|
|
United States |
299.1 |
14 |
8 |
0.6 |
3 |
349.4 |
419.9 |
|
40 |
6.7 |
2.0 |
20 |
12 |
78 |
75 |
80 |
79 |
0.6 |
0.6 |
73 |
68 |
|
S |
41,950 |
— |
3,717,796 |
80 |
23 |
100 |
100 |
|
|
© 2006 Population Reference Bureau |
See Notes on page 5. |
2006 World Population Data Sheet 6 |
Demographic Data and Estimates for the Countries and Regions of the World |
Economy |
Area & Density Environment |
|
|
|
|
|
|
|
|
Projected |
|
|
|
|
|
|
|
|
|
|
|
|
|
|
|
|
|
|
|
|
Pop. |
|
|
|
|
|
|
|
% of |
Percent of Married |
Govt. |
||
|
|
Deaths |
Rate of |
Net |
|
|
|
Change |
|
|
Percent |
|
Life Expectancy |
Population |
Women 15–49 Using |
View |
||||
Population |
Births per |
per |
Natural |
Migration |
Projected Population |
2006– |
Infant |
Total |
of Pop. |
|
at Birth |
Ages 15–49 |
Contraception |
of the |
||||||
mid–2006 |
1,000 |
1,000 |
Increase |
per 1,000 |
(millions) |
2050 |
Mortality |
Fertility |
of Age |
|
(years) |
% with HIV/AIDS |
All |
Modern |
|
Birth |
||||
(millions) |
Population |
Pop. |
(percent) |
Pop. |
mid–2025 |
mid–2050 |
|
(%) |
Ratea |
Rateb |
<15 |
65+ |
|
Total Males Females |
Urban 2003 |
2005 |
Methods |
Methods |
Ratec |
|
GNI |
% Pop. |
|
Population |
Percent of |
Pop. With Access |
|
PPP |
Living |
|
Density |
Surface |
to Improved |
|
per |
Below |
Area of |
per |
Area |
Sanitation (%) |
|
Capita |
US$2 |
Country |
Square |
Protected |
2002 |
|
2005 |
per Day |
(Square Miles) |
Mile |
2006 |
Urban |
Rural |
LATINAMERICA/CARIBBEAN |
566 |
21 |
6 |
1.5 |
-1 |
700 |
797 |
41 |
26 |
2.5 |
30 |
6 |
72 |
69 |
75 |
76 |
0.5 |
0.5 |
71 |
63 |
|
7,950 |
24 |
7,946,684 |
71 |
18 |
84 |
44 |
CENTRAL AMERICA |
149 |
24 |
5 |
1.9 |
-3 |
187 |
214 |
43 |
24 |
2.7 |
34 |
5 |
74 |
71 |
76 |
68 |
0.5 |
0.5 |
66 |
57 |
|
8,640 |
25 |
957,452 |
156 |
12 |
88 |
45 |
Belize |
0.3 |
27 |
5 |
2.3 |
10 |
0.4 |
0.5 |
61 |
31 |
3.3 |
41 |
3 |
70 |
67 |
74 |
50 |
2.1 |
2.5 |
56 |
49 |
H |
6,740 |
— |
8,865 |
34 |
30 |
71 |
25 |
Costa Rica |
4.3 |
17 |
4 |
1.3 |
1 |
5.6 |
6.3 |
48 |
10 |
1.9 |
28 |
6 |
79 |
77 |
81 |
59 |
0.3 |
0.3 |
80 |
72 |
S |
9,680 |
8 |
19,730 |
217 |
23 |
89 |
97 |
El Salvador |
7.0 |
26 |
6 |
2.0 |
-1 |
9.1 |
10.8 |
55 |
25 |
3.0 |
36 |
5 |
70 |
67 |
73 |
59 |
0.9 |
0.9 |
67 |
61 |
S |
5,120 |
41 |
8,124 |
862 |
1 |
78 |
40 |
Guatemala |
13.0 |
34 |
6 |
2.8 |
-4 |
20.0 |
27.9 |
115 |
35 |
4.4 |
43 |
4 |
67 |
63 |
71 |
39 |
0.9 |
0.9 |
43 |
34 |
H |
4,410 |
32 |
42,042 |
310 |
31 |
72 |
52 |
Honduras |
7.4 |
31 |
6 |
2.5 |
-2 |
10.7 |
14.7 |
100 |
30 |
3.9 |
42 |
3 |
71 |
67 |
74 |
47 |
1.5 |
1.5 |
62 |
51 |
H |
2,900 |
44 |
43,278 |
170 |
20 |
89 |
52 |
Mexico |
108.3 |
22 |
5 |
1.7 |
-4 |
129.4 |
139.0 |
28 |
21 |
2.4 |
32 |
5 |
75 |
73 |
78 |
75 |
0.3 |
0.3 |
68 |
59 |
S |
10,030 |
20 |
756,062 |
143 |
9 |
90 |
39 |
Nicaragua |
5.6 |
29 |
5 |
2.4 |
-4 |
7.7 |
9.4 |
67 |
36 |
3.3 |
40 |
3 |
69 |
66 |
70 |
59 |
0.2 |
0.2 |
69 |
66 |
H |
3,650 |
80 |
50,193 |
112 |
18 |
78 |
51 |
Panama |
3.3 |
22 |
5 |
1.7 |
0 |
4.2 |
5.0 |
52 |
19 |
2.7 |
30 |
6 |
75 |
73 |
78 |
62 |
0.9 |
0.9 |
— |
— |
S |
7,310 |
17 |
29,158 |
113 |
25 |
89 |
51 |
CARIBBEAN |
39 |
20 |
8 |
1.2 |
-3 |
48 |
55 |
41 |
40 |
2.6 |
29 |
8 |
69 |
67 |
71 |
64 |
1.5 |
1.6 |
61 |
57 |
|
— |
— |
90,653 |
433 |
8 |
82 |
51 |
Antigua and Barbuda |
0.1 |
18 |
6 |
1.3 |
-6 |
0.1 |
0.1 |
0 |
21 |
2.3 |
28 |
5 |
71 |
69 |
74 |
37 |
— |
— |
— |
— |
S |
11,700 |
— |
170 |
406 |
1 |
98 |
94 |
Bahamas |
0.3 |
19 |
9 |
1.0 |
-2 |
0.3 |
0.3 |
7 |
12.7 |
2.3 |
29 |
6 |
70 |
67 |
73 |
89 |
2.9 |
3.3 |
— |
— |
S |
— |
— |
5,359 |
57 |
1 |
100 |
100 |
Barbados |
0.3 |
14 |
8 |
0.6 |
-1 |
0.3 |
0.3 |
-1 |
14.2 |
1.7 |
22 |
12 |
72 |
70 |
74 |
50 |
1.6 |
1.5 |
— |
— |
L |
— |
— |
166 |
1,626 |
z |
99 |
100 |
Cuba |
11.3 |
11 |
7 |
0.4 |
-3 |
11.8 |
11.1 |
-2 |
5.8 |
1.5 |
20 |
11 |
77 |
75 |
79 |
76 |
0.1 |
0.1 |
73 |
72 |
S |
— |
— |
42,803 |
263 |
15 |
99 |
95 |
Dominica |
0.1 |
15 |
7 |
0.8 |
-16 |
0.1 |
0.1 |
19 |
22.2 |
1.9 |
28 |
8 |
74 |
71 |
77 |
71 |
— |
— |
— |
— |
S |
5,560 |
— |
290 |
238 |
4 |
86 |
75 |
Dominican Republic |
9.0 |
23 |
6 |
1.7 |
-3 |
11.6 |
14.2 |
57 |
31 |
2.8 |
33 |
5 |
68 |
66 |
69 |
64 |
1.2 |
1.1 |
70 |
66 |
H |
7,150 |
11 |
18,815 |
479 |
33 |
67 |
43 |
Grenada |
0.1 |
19 |
7 |
1.2 |
-15 |
0.1 |
0.1 |
-3 |
17 |
2.1 |
32 |
5 |
71 |
— |
— |
39 |
— |
— |
54 |
49 |
H |
7,260 |
— |
131 |
754 |
z |
96 |
97 |
Guadeloupe |
0.5 |
16 |
6 |
1.0 |
-1 |
0.5 |
0.5 |
5 |
7.9 |
2.2 |
26 |
9 |
78 |
75 |
82 |
100 |
— |
— |
— |
— |
— |
— |
— |
660 |
698 |
3 |
64 |
61 |
Haiti |
8.5 |
36 |
13 |
2.3 |
-3 |
13.0 |
18.9 |
121 |
73 |
4.7 |
42 |
3 |
52 |
51 |
54 |
36 |
3.8 |
3.8 |
28 |
22 |
H |
1,840 |
78 |
10,714 |
795 |
z |
52 |
23 |
Jamaica |
2.7 |
19 |
6 |
1.3 |
-7 |
3.0 |
3.4 |
27 |
24 |
2.3 |
31 |
7 |
71 |
69 |
73 |
52 |
1.5 |
1.5 |
66 |
63 |
H |
4,110 |
13 |
4,243 |
628 |
14 |
90 |
68 |
Martinique |
0.4 |
14 |
7 |
0.7 |
-1 |
0.4 |
0.4 |
-11 |
6 |
2.0 |
22 |
12 |
79 |
76 |
82 |
95 |
— |
— |
— |
— |
— |
— |
— |
425 |
937 |
11 |
— |
— |
Netherlands Antilles |
0.2 |
13 |
8 |
0.5 |
21 |
0.2 |
0.2 |
14 |
9 |
2.0 |
23 |
10 |
76 |
72 |
79 |
69 |
— |
— |
— |
— |
— |
— |
— |
309 |
625 |
1 |
— |
— |
Puerto Rico |
3.9 |
13 |
7 |
0.6 |
-1 |
4.1 |
3.8 |
-4 |
8.6 |
1.8 |
22 |
12 |
77 |
73 |
81 |
94 |
— |
— |
78 |
68 |
— |
— |
— |
3,456 |
1,137 |
2 |
— |
— |
St. Kitts–Nevis |
0.05 |
18 |
9 |
1.0 |
-6 |
0.1 |
0.1 |
34 |
15 |
2.4 |
29 |
9 |
70 |
68 |
72 |
33 |
— |
— |
— |
— |
S |
12,500 |
— |
139 |
338 |
10 |
96 |
96 |
Saint Lucia |
0.2 |
20 |
5 |
1.5 |
2 |
0.2 |
0.2 |
41 |
15.6 |
2.2 |
28 |
7 |
74 |
72 |
77 |
28 |
— |
— |
— |
— |
H |
5,980 |
— |
239 |
698 |
2 |
89 |
89 |
St. Vincent & the Grenadines |
0.1 |
18 |
7 |
1.1 |
-8 |
0.1 |
0.1 |
-13 |
18.1 |
2.1 |
31 |
6 |
71 |
68 |
74 |
45 |
— |
— |
— |
— |
S |
6,460 |
— |
151 |
737 |
1 |
— |
96 |
Trinidad and Tobago |
1.3 |
14 |
8 |
0.6 |
-3 |
1.3 |
1.2 |
-6 |
18.6 |
1.6 |
25 |
7 |
70 |
67 |
73 |
74 |
2.6 |
2.6 |
— |
— |
S |
13,170 |
— |
1,981 |
660 |
2 |
100 |
100 |
SOUTH AMERICA |
378 |
21 |
6 |
1.4 |
-1 |
465 |
528 |
40 |
25 |
2.4 |
29 |
6 |
72 |
69 |
76 |
80 |
0.5 |
0.5 |
75 |
66 |
|
8,210 |
23 |
6,898,579 |
55 |
19 |
83 |
42 |
Argentina |
39.0 |
18 |
8 |
1.1 |
-1 |
46.4 |
53.7 |
38 |
16.8 |
2.4 |
27 |
10 |
74 |
71 |
78 |
89 |
0.6 |
0.6 |
— |
— |
S |
13,920 |
23 |
1,073,514 |
36 |
6 |
— |
— |
Bolivia |
9.1 |
31 |
8 |
2.2 |
-2 |
12.1 |
14.5 |
59 |
54 |
3.8 |
39 |
4 |
64 |
62 |
66 |
63 |
0.1 |
0.1 |
58 |
35 |
S |
2,740 |
42 |
424,162 |
21 |
20 |
58 |
23 |
Brazil |
186.8 |
21 |
6 |
1.4 |
0 |
228.9 |
259.8 |
39 |
27 |
2.3 |
28 |
6 |
72 |
68 |
76 |
81 |
0.5 |
0.5 |
76 |
70 |
S |
8,230 |
21 |
3,300,154 |
57 |
19 |
83 |
35 |
Chile |
16.4 |
16 |
5 |
1.0 |
2 |
19.1 |
20.2 |
23 |
7.8 |
2.0 |
25 |
8 |
78 |
75 |
81 |
87 |
0.3 |
0.3 |
— |
— |
S |
11,470 |
10 |
292,135 |
56 |
21 |
96 |
64 |
Colombia |
46.8 |
20 |
5 |
1.5 |
-1 |
58.3 |
66.3 |
42 |
19 |
2.4 |
31 |
5 |
72 |
69 |
75 |
75 |
0.5 |
0.6 |
78 |
68 |
H |
7,420 |
18 |
439,734 |
106 |
32 |
96 |
54 |
Ecuador |
13.3 |
27 |
6 |
2.1 |
-4 |
17.5 |
20.4 |
54 |
29 |
3.2 |
33 |
6 |
74 |
71 |
77 |
61 |
0.3 |
0.3 |
73 |
59 |
S |
4,070 |
37 |
109,483 |
121 |
19 |
80 |
59 |
French Guiana |
0.2 |
31 |
4 |
2.7 |
10 |
0.3 |
0.4 |
87 |
10 |
3.9 |
35 |
4 |
75 |
72 |
79 |
75 |
— |
— |
— |
— |
— |
— |
— |
34,749 |
6 |
5 |
85 |
57 |
Guyana |
0.7 |
22 |
9 |
1.3 |
-11 |
0.7 |
0.5 |
-35 |
46 |
2.3 |
36 |
4 |
76 |
72 |
80 |
36 |
2.4 |
2.4 |
37 |
36 |
S |
4,230 |
— |
83,000 |
9 |
2 |
86 |
60 |
Paraguay |
6.3 |
22 |
5 |
1.7 |
-1 |
8.6 |
10.3 |
63 |
29 |
2.9 |
32 |
4 |
71 |
69 |
73 |
57 |
0.4 |
0.4 |
73 |
61 |
H |
4,970 |
33 |
157,046 |
40 |
6 |
94 |
58 |
Peru |
28.4 |
19 |
6 |
1.3 |
-2 |
34.1 |
35.9 |
27 |
33 |
2.4 |
31 |
6 |
70 |
67 |
72 |
73 |
0.5 |
0.6 |
71 |
47 |
H |
5,830 |
32 |
496,224 |
57 |
13 |
72 |
33 |
Suriname |
0.5 |
21 |
7 |
1.4 |
-7 |
0.5 |
0.5 |
-5 |
20 |
2.5 |
31 |
6 |
69 |
66 |
73 |
74 |
1.7 |
1.9 |
42 |
41 |
S |
— |
— |
63,039 |
8 |
12 |
99 |
76 |
Uruguay |
3.3 |
15 |
10 |
0.5 |
-3 |
3.5 |
3.7 |
12 |
15.3 |
2.2 |
24 |
13 |
75 |
71 |
79 |
93 |
0.4 |
0.5 |
— |
— |
L |
9,810 |
6 |
68,498 |
48 |
z |
95 |
85 |
Venezuela |
27.0 |
22 |
5 |
1.7 |
0 |
35.2 |
41.7 |
54 |
17.5 |
2.7 |
31 |
5 |
73 |
70 |
76 |
88 |
0.6 |
0.7 |
— |
— |
S |
6,440 |
28 |
352,143 |
77 |
63 |
71 |
48 |
© 2006 Population Reference Bureau |
See Notes on page 5. |
2006 World Population Data Sheet 7 |
|
|
|
Demographic Data and Estimates for the Countries and Regions of the World |
|
|
|
Economy |
Area & Density |
Environment |
|
||||||||||||||||||||||
|
|
|
|
|
|
|
|
|
Projected |
|
|
|
|
|
|
|
|
|
|
|
|
|
|
|
|
|
|
Population |
|
|
|
|
|
|
|
|
|
|
|
|
|
Pop. |
|
|
|
|
|
|
|
|
|
% of |
Percent of Married |
Govt. |
GNI |
% Pop. |
|
Percent of |
Pop. With Access |
|
|||||
|
|
|
Deaths |
Rate of |
Net |
|
|
|
Change |
|
|
Percent |
|
|
Life Expectancy |
|
Population |
Women 15–49 Using |
View |
PPP |
Living |
|
Density |
Surface |
to Improved |
|
||||||
|
Population |
Births per |
per |
Natural |
Migration |
Projected Population |
2006– |
Infant |
Total |
of Pop. |
|
|
at Birth |
|
|
Ages 15–49 |
Contraception |
of the |
per |
Below |
Area of |
per |
Area |
Sanitation (%) |
|
|||||||
|
mid–2006 |
1,000 |
1,000 |
Increase |
per 1,000 |
(millions) |
2050 |
Mortality |
Fertility |
of Age |
|
|
(years) |
|
% |
with HIV/AIDS |
All |
Modern |
|
Birth |
Capita |
US$2 |
Country |
Square |
Protected |
2002 |
|
|||||
|
|
|
|
|
|
|
||||||||||||||||||||||||||
|
(millions) |
Population |
Pop. |
(percent) |
Pop. |
mid–2025 |
mid–2050 |
|
(%) |
Ratea |
Rateb |
<15 |
65+ |
|
Total |
Males |
Females |
Urban 2003 |
2005 |
Methods |
Methods |
Ratec |
2005 |
per Day |
(Square Miles) |
Mile |
2006 |
Urban |
Rural |
|
||
ASIA |
3,968 |
20 |
7 |
1.2 |
-0 |
4,739 |
5,277 |
|
33 |
49 |
2.4 |
29 |
6 |
68 |
66 |
70 |
38 |
0.4 |
0.4 |
65 |
59 |
|
|
5,960 |
59 |
12,262,691 |
324 |
11 |
74 |
31 |
|
|
ASIA (Excl. China) |
2,657 |
23 |
7 |
1.6 |
-0 |
3,263 |
3,840 |
|
45 |
54 |
2.8 |
33 |
6 |
66 |
64 |
68 |
39 |
0.6 |
0.6 |
54 |
45 |
|
|
5,640 |
66 |
8,566,591 |
310 |
10 |
77 |
33 |
|
|
WESTERN ASIA |
218 |
26 |
6 |
2.0 |
2 |
296 |
383 |
|
76 |
42 |
3.4 |
34 |
5 |
69 |
67 |
71 |
62 |
— |
— |
51 |
32 |
|
|
7,500 |
— |
1,823,873 |
119 |
18 |
94 |
50 |
|
|
Armenia |
3.0 |
13 |
9 |
0.4 |
-3 |
3.4 |
3.4 |
|
12 |
26 |
1.7 |
22 |
11 |
71 |
67 |
75 |
64 |
0.1 |
0.1 |
53 |
20 |
|
L |
5,060 |
31 |
11,506 |
262 |
10 |
96 |
61 |
|
|
Azerbaijan |
8.5 |
17 |
6 |
1.1 |
0 |
9.7 |
11.6 |
|
37 |
9 |
2.0 |
24 |
7 |
72 |
70 |
75 |
52 |
<0.1 |
0.1 |
55 |
12 |
|
S |
4,890 |
<2 |
33,436 |
254 |
7 |
73 |
36 |
|
|
Bahrain |
0.7 |
21 |
3 |
1.8 |
7 |
1.0 |
1.2 |
|
56 |
10 |
2.6 |
28 |
3 |
74 |
73 |
75 |
100 |
— |
— |
65 |
— |
H |
21,290 |
— |
266 |
2,793 |
1 |
100 |
— |
|
||
Cyprus |
1.0 |
11 |
7 |
0.4 |
16 |
1.1 |
1.1 |
|
4 |
5 |
1.5 |
20 |
11 |
78 |
75 |
80 |
66 |
— |
— |
— |
— |
L |
22,230 |
— |
3,571 |
290 |
4 |
100 |
100 |
|
||
Georgia |
4.4 |
12 |
11 |
0.1 |
-9 |
3.9 |
3.0 |
|
-33 |
25 |
1.6 |
19 |
13 |
72 |
69 |
75 |
52 |
0.1 |
0.2 |
47 |
27 |
|
L |
3,270 |
25 |
26,911 |
165 |
4 |
96 |
69 |
|
|
Iraq |
29.6 |
36 |
10 |
2.6 |
0 |
44.7 |
63.7 |
|
116 |
88 |
4.8 |
42 |
3 |
59 |
57 |
60 |
68 |
— |
— |
44 |
25 |
|
S |
— |
— |
169,236 |
175 |
z |
95 |
48 |
|
|
Israel |
7.2 |
21 |
5 |
1.5 |
2 |
9.3 |
11.0 |
|
52 |
4.2 |
2.8 |
28 |
10 |
80 |
78 |
82 |
91 |
— |
— |
— |
— |
L |
25,280 |
— |
8,131 |
890 |
16 |
100 |
— |
|
||
Jordan |
5.6 |
29 |
5 |
2.4 |
2 |
7.9 |
9.9 |
|
75 |
24 |
3.7 |
37 |
4 |
72 |
71 |
72 |
82 |
— |
— |
56 |
41 |
|
H |
5,280 |
7 |
34,444 |
164 |
11 |
94 |
85 |
|
|
Kuwait |
2.7 |
19 |
2 |
1.7 |
14 |
3.9 |
5.1 |
|
91 |
10 |
2.4 |
26 |
2 |
78 |
77 |
79 |
96 |
— |
— |
52 |
39 |
|
L |
24,010 |
— |
6,880 |
387 |
3 |
— |
— |
|
|
Lebanon |
3.9 |
19 |
5 |
1.5 |
-2 |
4.6 |
5.0 |
|
30 |
17 |
2.4 |
27 |
8 |
72 |
70 |
74 |
87 |
0.1 |
0.1 |
63 |
40 |
|
H |
5,740 |
— |
4,015 |
963 |
1 |
100 |
87 |
|
|
Oman |
2.6 |
24 |
4 |
2.0 |
12 |
3.1 |
3.9 |
|
50 |
10 |
3.4 |
33 |
3 |
74 |
73 |
75 |
71 |
— |
— |
24 |
18 |
|
H |
14,680 |
— |
82,031 |
31 |
11 |
97 |
61 |
|
|
Palestinian Territory |
3.9 |
37 |
4 |
3.3 |
— |
7.1 |
11.2 |
|
188 |
21 |
5.6 |
46 |
3 |
72 |
71 |
74 |
57 |
— |
— |
51 |
37 |
|
— |
— |
— |
2,417 |
1,609 |
— |
78 |
70 |
|
|
Qatar |
0.8 |
18 |
2 |
1.6 |
40 |
1.2 |
1.5 |
|
86 |
9 |
2.8 |
23 |
1 |
73 |
71 |
76 |
100 |
— |
— |
43 |
32 |
|
S |
— |
— |
4,247 |
196 |
1 |
100 |
100 |
|
|
Saudi Arabia |
24.1 |
30 |
3 |
2.7 |
2 |
35.6 |
47.4 |
|
96 |
23 |
4.5 |
38 |
3 |
72 |
70 |
74 |
86 |
— |
— |
32 |
29 |
|
S |
14,740 |
— |
829,996 |
29 |
37 |
100 |
— |
|
|
Syria |
19.5 |
29 |
4 |
2.5 |
0 |
28.1 |
35.9 |
|
84 |
18 |
3.5 |
37 |
3 |
73 |
71 |
75 |
50 |
— |
— |
47 |
35 |
|
S |
3,740 |
— |
71,498 |
273 |
2 |
97 |
56 |
|
|
Turkey |
73.7 |
19 |
6 |
1.3 |
0 |
86.0 |
90.5 |
|
23 |
25 |
2.2 |
29 |
6 |
71 |
69 |
74 |
59 |
— |
— |
71 |
43 |
|
S |
8,420 |
19 |
299,158 |
246 |
4 |
94 |
62 |
|
|
United Arab Emirates |
4.9 |
15 |
1 |
1.3 |
54 |
7.1 |
9.6 |
|
94 |
9 |
2.2 |
25 |
1 |
77 |
75 |
80 |
74 |
— |
— |
28 |
24 |
|
S |
24,090 |
— |
32,278 |
153 |
4 |
100 |
100 |
|
|
Yemen |
21.6 |
41 |
9 |
3.2 |
-1 |
38.8 |
68.1 |
|
214 |
75 |
6.2 |
46 |
4 |
60 |
59 |
62 |
26 |
— |
— |
23 |
13 |
|
H |
920 |
45 |
203,849 |
106 |
0 |
76 |
14 |
|
|
SOUTH CENTRAL ASIA |
1,642 |
25 |
8 |
1.7 |
-1 |
2,053 |
2,490 |
|
52 |
64 |
3.1 |
36 |
4 |
63 |
62 |
64 |
30 |
0.6 |
0.7 |
51 |
43 |
|
|
3,330 |
75 |
4,157,320 |
395 |
5 |
66 |
25 |
|
|
Afghanistan |
31.1 |
48 |
22 |
2.6 |
0 |
50.3 |
81.9 |
|
164 |
166 |
6.8 |
45 |
2 |
42 |
41 |
42 |
22 |
<0.1 |
<0.1 |
10 |
9 |
|
H |
— |
— |
251,772 |
123 |
z |
16 |
5 |
|
|
Bangladesh |
146.6 |
27 |
8 |
1.9 |
-0 |
190.0 |
231.0 |
|
58 |
65 |
3.0 |
35 |
3 |
61 |
61 |
62 |
23 |
<0.1 |
<0.1 |
58 |
47 |
|
H |
2,090 |
83 |
55,598 |
2,637 |
1 |
75 |
39 |
|
|
Bhutan |
0.9 |
20 |
7 |
1.3 |
0 |
1.3 |
1.8 |
|
99 |
40 |
2.9 |
33 |
5 |
63 |
62 |
64 |
31 |
<0.1 |
<0.1 |
— |
31 |
|
H |
— |
— |
18,147 |
49 |
26 |
65 |
70 |
|
|
India |
1,121.8 |
24 |
8 |
1.7 |
-0 |
1,363.0 |
1,628.0 |
|
45 |
58 |
2.9 |
36 |
4 |
63 |
62 |
63 |
29 |
0.9 |
0.9 |
53 |
46 |
|
H |
3,460 |
80 |
1,269,340 |
884 |
5 |
58 |
18 |
|
|
Iran |
70.3 |
18 |
6 |
1.2 |
-4 |
89.0 |
101.9 |
|
45 |
32 |
2.0 |
29 |
5 |
70 |
69 |
72 |
67 |
0.1 |
0.2 |
74 |
56 |
|
H |
8,050 |
7 |
630,575 |
112 |
7 |
86 |
78 |
|
|
Kazakhstan |
15.3 |
18 |
10 |
0.8 |
1 |
16.0 |
15.2 |
|
-1 |
29 |
2.2 |
27 |
8 |
66 |
61 |
72 |
57 |
0.1 |
0.1 |
66 |
53 |
|
L |
7,730 |
16 |
1,049,151 |
15 |
3 |
87 |
52 |
|
|
Kyrgyzstan |
5.2 |
21 |
7 |
1.4 |
-5 |
6.6 |
8.2 |
|
58 |
30 |
2.6 |
32 |
6 |
68 |
64 |
72 |
35 |
<0.1 |
0.1 |
60 |
49 |
|
S |
1,870 |
21 |
76,641 |
67 |
4 |
75 |
51 |
|
|
Maldives |
0.3 |
18 |
3 |
1.5 |
0 |
0.4 |
0.5 |
|
80 |
15 |
2.8 |
33 |
5 |
70 |
70 |
70 |
27 |
— |
— |
40 |
35 |
|
H |
— |
— |
116 |
2,573 |
0 |
100 |
42 |
|
|
Nepal |
26.0 |
31 |
9 |
2.2 |
-1 |
36.2 |
48.0 |
|
85 |
64 |
3.7 |
41 |
4 |
62 |
62 |
63 |
14 |
0.5 |
0.5 |
39 |
35 |
|
H |
1,530 |
69 |
56,826 |
457 |
16 |
68 |
20 |
|
|
Pakistan |
165.8 |
33 |
9 |
2.4 |
-1 |
228.8 |
295.0 |
|
78 |
79 |
4.6 |
41 |
4 |
62 |
61 |
63 |
34 |
0.1 |
0.1 |
28 |
20 |
|
H |
2,350 |
74 |
307,375 |
539 |
9 |
92 |
35 |
|
|
Sri Lanka |
19.9 |
19 |
6 |
1.3 |
-1 |
22.2 |
22.4 |
|
13 |
11 |
2.0 |
26 |
7 |
74 |
71 |
77 |
20 |
<0.1 |
<0.1 |
70 |
50 |
|
S |
4,520 |
42 |
25,332 |
784 |
17 |
98 |
89 |
|
|
Tajikistan |
7.0 |
30 |
8 |
2.2 |
-1 |
9.3 |
11.1 |
|
58 |
89 |
3.8 |
32 |
3 |
64 |
61 |
66 |
26 |
<0.1 |
0.1 |
34 |
27 |
|
H |
1,260 |
43 |
55,251 |
127 |
18 |
71 |
47 |
|
|
Turkmenistan |
5.3 |
25 |
8 |
1.6 |
-0 |
6.6 |
7.4 |
|
38 |
74 |
2.9 |
34 |
5 |
62 |
58 |
67 |
47 |
— |
<0.1 |
62 |
53 |
|
S |
— |
— |
188,456 |
28 |
4 |
77 |
50 |
|
|
Uzbekistan |
26.2 |
23 |
7 |
1.6 |
-2 |
33.0 |
37.5 |
|
43 |
58 |
2.7 |
35 |
5 |
67 |
63 |
70 |
36 |
0.1 |
0.2 |
68 |
63 |
|
S |
2,020 |
— |
172,741 |
152 |
5 |
73 |
48 |
|
|
© 2006 Population Reference Bureau |
See Notes on page 5. |
2006 World Population Data Sheet 8 |

|
|
|
Demographic Data and Estimates for the Countries and Regions of the World |
|
|
|
Economy |
Area & Density |
Environment |
|
||||||||||||||||||||||
|
|
|
|
|
|
|
|
|
Projected |
|
|
|
|
|
|
|
|
|
|
|
|
|
|
|
|
|
|
Population |
|
|
|
|
|
|
|
|
|
|
|
|
|
Pop. |
|
|
|
|
|
|
|
|
|
% of |
Percent of Married |
Govt. |
GNI |
% Pop. |
|
Percent of |
Pop. With Access |
|
|||||
|
|
|
Deaths |
Rate of |
Net |
|
|
|
Change |
|
|
Percent |
|
|
Life Expectancy |
|
Population |
Women 15–49 Using |
View |
PPP |
Living |
|
Density |
Surface |
to Improved |
|
||||||
|
Population |
Births per |
per |
Natural |
Migration |
Projected Population |
2006– |
Infant |
Total |
of Pop. |
|
|
at Birth |
|
|
Ages 15–49 |
Contraception |
of the |
per |
Below |
Area of |
per |
Area |
Sanitation (%) |
|
|||||||
|
mid–2006 |
1,000 |
1,000 |
Increase |
per 1,000 |
(millions) |
2050 |
Mortality |
Fertility |
of Age |
|
|
(years) |
|
% |
with HIV/AIDS |
All |
Modern |
|
Birth |
Capita |
US$2 |
Country |
Square |
Protected |
2002 |
|
|||||
|
|
|
|
|
|
|
||||||||||||||||||||||||||
|
(millions) |
Population |
Pop. |
(percent) |
Pop. |
mid–2025 |
mid–2050 |
|
(%) |
Ratea |
Rateb |
<15 |
65+ |
|
Total |
Males |
Females |
Urban 2003 |
2005 |
Methods |
Methods |
Ratec |
2005 |
per Day |
(Square Miles) |
Mile |
2006 |
Urban |
Rural |
|
||
SOUTHEAST ASIA |
565 |
21 |
6 |
1.4 |
-1 |
682 |
766 |
|
36 |
34 |
2.5 |
30 |
5 |
69 |
66 |
71 |
39 |
0.5 |
0.5 |
60 |
52 |
|
|
4,530 |
46 |
1,735,448 |
326 |
10 |
79 |
50 |
|
|
Brunei |
0.4 |
20 |
3 |
1.7 |
2 |
0.5 |
0.7 |
|
87 |
9 |
2.4 |
30 |
3 |
75 |
72 |
77 |
72 |
<0.1 |
<0.1 |
— |
— |
S |
— |
— |
2,228 |
164 |
38 |
— |
— |
|
||
Cambodia |
14.1 |
30 |
9 |
2.1 |
-0 |
19.6 |
25.5 |
|
81 |
91 |
3.7 |
37 |
3 |
60 |
57 |
63 |
15 |
2.0 |
1.6 |
24 |
19 |
|
H |
2,490 |
78 |
69,900 |
201 |
22 |
53 |
8 |
|
|
East Timor |
1.0 |
42 |
15 |
2.7 |
1 |
1.9 |
3.2 |
|
224 |
88 |
6.3 |
43 |
3 |
56 |
54 |
57 |
22 |
— |
— |
10 |
9 |
|
H |
— |
— |
5,741 |
170 |
1 |
65 |
30 |
|
|
Indonesia |
225.5 |
20 |
6 |
1.4 |
-1 |
263.7 |
284.6 |
|
26 |
35 |
2.4 |
29 |
5 |
69 |
67 |
72 |
42 |
0.1 |
0.1 |
60 |
57 |
|
H |
3,720 |
52 |
735,355 |
307 |
9 |
71 |
38 |
|
|
Laos |
6.1 |
36 |
13 |
2.3 |
-0 |
8.7 |
11.6 |
|
91 |
88 |
4.8 |
43 |
4 |
54 |
53 |
56 |
19 |
0.1 |
0.1 |
32 |
29 |
|
H |
2,020 |
74 |
91,429 |
66 |
16 |
61 |
14 |
|
|
Malaysia |
26.9 |
20 |
4 |
1.6 |
4 |
34.6 |
40.6 |
|
51 |
10 |
2.6 |
33 |
4 |
74 |
72 |
76 |
62 |
0.4 |
0.5 |
55 |
30 |
|
S |
10,320 |
9 |
127,317 |
211 |
17 |
— |
98 |
|
|
Myanmar |
51.0 |
21 |
10 |
1.1 |
0 |
59.0 |
63.7 |
|
25 |
75 |
2.5 |
32 |
5 |
60 |
57 |
63 |
29 |
1.4 |
1.3 |
37 |
33 |
|
S |
— |
— |
261,228 |
195 |
5 |
96 |
63 |
|
|
Philippines |
86.3 |
27 |
5 |
2.1 |
-2 |
115.7 |
142.2 |
|
65 |
27 |
3.4 |
35 |
4 |
70 |
67 |
72 |
48 |
<0.1 |
<0.1 |
49 |
33 |
|
H |
5,300 |
48 |
115,830 |
745 |
7 |
81 |
61 |
|
|
Singapore |
4.5 |
10 |
4 |
0.6 |
20 |
5.2 |
5.3 |
|
19 |
2.1 |
1.2 |
20 |
8 |
80 |
78 |
82 |
100 |
0.3 |
0.3 |
62 |
55 |
|
L |
29,780 |
— |
239 |
18,652 |
2 |
100 |
— |
|
|
Thailand |
65.2 |
14 |
7 |
0.7 |
-0 |
70.2 |
73.2 |
|
12 |
20 |
1.7 |
23 |
7 |
71 |
68 |
75 |
33 |
1.4 |
1.4 |
79 |
79 |
|
S |
8,440 |
25 |
198,116 |
329 |
19 |
97 |
100 |
|
|
Vietnam |
84.2 |
19 |
5 |
1.3 |
-0 |
102.9 |
115.1 |
|
37 |
18 |
2.1 |
29 |
7 |
72 |
70 |
73 |
26 |
0.4 |
0.5 |
77 |
66 |
|
S |
3,010 |
— |
128,066 |
657 |
4 |
84 |
26 |
|
|
EAST ASIA |
1,544 |
12 |
7 |
0.5 |
-0 |
1,708 |
1,639 |
|
6 |
25 |
1.6 |
20 |
9 |
73 |
71 |
75 |
43 |
0.1 |
0.1 |
84 |
82 |
|
|
9,050 |
47 |
4,546,050 |
340 |
14 |
74 |
32 |
|
|
China |
1,311.4 |
12 |
7 |
0.6 |
-0 |
1,476.0 |
1,437.0 |
|
10 |
27 |
1.6 |
20 |
8 |
72 |
70 |
74 |
37 |
0.1 |
0.1 |
87 |
86 |
|
S |
6,600 |
47 |
3,696,100 |
355 |
15 |
69 |
29 |
|
|
China, Hong Kong SARd |
7.0 |
8 |
6 |
0.3 |
5 |
8.1 |
8.7 |
|
24 |
2.4 |
1.0 |
14 |
12 |
81 |
79 |
84 |
100 |
— |
— |
— |
— |
— |
34,670 |
— |
413 |
16,915 |
51 |
— |
— |
|
||
China, Macao SARd |
0.5 |
8 |
3 |
0.4 |
44 |
0.6 |
0.6 |
|
12 |
3 |
0.9 |
16 |
8 |
79 |
77 |
82 |
99 |
— |
— |
— |
— |
— |
— |
— |
8 |
64,745 |
— |
— |
— |
|
||
Japan |
127.8 |
9 |
8 |
0.0 |
0 |
121.1 |
100.6 |
|
-21 |
2.8 |
1.3 |
14 |
20 |
82 |
79 |
86 |
79 |
<0.1 |
<0.1 |
56 |
48 |
|
L |
31,410 |
— |
145,869 |
876 |
9 |
100 |
100 |
|
|
Korea, North |
23.1 |
16 |
7 |
0.9 |
0 |
25.8 |
26.4 |
|
14 |
21 |
2.0 |
27 |
8 |
71 |
68 |
73 |
60 |
— |
— |
69 |
58 |
|
L |
— |
— |
46,541 |
497 |
2 |
58 |
60 |
|
|
Korea, South |
48.5 |
9 |
5 |
0.4 |
-1 |
49.8 |
42.3 |
|
-13 |
5 |
1.1 |
19 |
10 |
77 |
74 |
81 |
82 |
<0.1 |
<0.1 |
81 |
67 |
|
L |
21,850 |
<2 |
38,324 |
1,265 |
4 |
— |
— |
|
|
Mongolia |
2.6 |
18 |
6 |
1.2 |
0 |
3.1 |
3.5 |
|
35 |
21 |
1.9 |
29 |
4 |
66 |
64 |
68 |
57 |
<0.1 |
<0.1 |
67 |
54 |
|
L |
2,190 |
75 |
604,826 |
4 |
14 |
75 |
37 |
|
|
Taiwan |
22.8 |
9 |
6 |
0.3 |
1 |
23.6 |
19.8 |
|
-13 |
5.4 |
1.1 |
19 |
10 |
76 |
73 |
79 |
78 |
— |
— |
71 |
— |
L |
— |
— |
13,969 |
1,633 |
6 |
— |
— |
|
||
EUROPE |
732 |
10 |
12 |
-0.1 |
2 |
717 |
665 |
|
-9 |
7 |
1.4 |
16 |
16 |
75 |
71 |
79 |
75 |
0.5 |
0.5 |
68 |
53 |
|
|
21,120 |
— |
8,875,867 |
82 |
9 |
— |
— |
|
|
NORTHERN EUROPE |
97 |
12 |
10 |
0.2 |
4 |
103 |
107 |
|
11 |
5 |
1.7 |
18 |
16 |
78 |
75 |
81 |
82 |
0.2 |
0.2 |
82 |
76 |
|
|
31,570 |
— |
675,794 |
143 |
9 |
— |
— |
|
|
Channel Islands |
0.2 |
12 |
9 |
0.2 |
— |
0.2 |
0.2 |
|
15 |
3.4 |
1.4 |
15 |
13 |
78 |
76 |
80 |
31 |
— |
— |
— |
— |
— |
— |
— |
75 |
1,987 |
— |
— |
— |
|
||
Denmark |
5.4 |
12 |
10 |
0.2 |
1 |
5.6 |
5.5 |
|
1 |
4.4 |
1.8 |
19 |
15 |
78 |
76 |
80 |
72 |
0.2 |
0.2 |
— |
— |
S |
33,570 |
— |
16,637 |
327 |
7 |
— |
— |
|
||
Estonia |
1.3 |
11 |
13 |
-0.2 |
-0 |
1.2 |
1.0 |
|
-23 |
6 |
1.5 |
15 |
17 |
72 |
66 |
78 |
69 |
1.1 |
1.3 |
70 |
56 |
|
L |
15,420 |
8 |
17,413 |
77 |
31 |
93 |
— |
|
|
Finland |
5.3 |
11 |
9 |
0.2 |
1 |
5.4 |
5.3 |
|
0 |
3.0 |
1.8 |
17 |
16 |
79 |
75 |
82 |
62 |
0.1 |
0.1 |
79 |
78 |
|
L |
31,170 |
— |
130,560 |
40 |
8 |
100 |
100 |
|
|
Iceland |
0.3 |
14 |
6 |
0.8 |
5 |
0.3 |
0.4 |
|
17 |
2.5 |
2.1 |
22 |
12 |
81 |
79 |
83 |
93 |
0.2 |
0.2 |
— |
— |
S |
34,760 |
— |
39,768 |
8 |
6 |
— |
— |
|
||
Ireland |
4.2 |
15 |
7 |
0.8 |
13 |
4.5 |
4.7 |
|
11 |
4.7 |
1.9 |
21 |
11 |
78 |
75 |
80 |
60 |
0.2 |
0.2 |
— |
— |
S |
34,720 |
— |
27,135 |
156 |
1 |
— |
— |
|
||
Latvia |
2.3 |
9 |
14 |
-0.5 |
-0 |
2.2 |
1.8 |
|
-23 |
7 |
1.3 |
15 |
17 |
73 |
67 |
77 |
68 |
0.6 |
0.8 |
85 |
60 |
|
L |
13,480 |
5 |
24,942 |
92 |
14 |
— |
— |
|
|
Lithuania |
3.4 |
9 |
13 |
-0.4 |
-3 |
3.1 |
2.9 |
|
-15 |
7 |
1.3 |
17 |
15 |
72 |
66 |
78 |
67 |
0.1 |
0.2 |
47 |
30 |
|
L |
14,220 |
8 |
25,174 |
135 |
11 |
— |
— |
|
|
Norway |
4.7 |
12 |
9 |
0.3 |
4 |
5.2 |
5.8 |
|
25 |
3.1 |
1.8 |
20 |
15 |
80 |
78 |
83 |
78 |
0.1 |
0.1 |
— |
— |
S |
40,420 |
— |
125,050 |
37 |
5 |
— |
— |
|
||
Sweden |
9.1 |
11 |
10 |
0.1 |
4 |
9.9 |
10.5 |
|
16 |
2.4 |
1.8 |
17 |
17 |
81 |
78 |
83 |
84 |
0.2 |
0.2 |
— |
— |
S |
31,420 |
— |
173,730 |
52 |
9 |
100 |
100 |
|
||
United Kingdom |
60.5 |
12 |
10 |
0.2 |
4 |
65.8 |
69.2 |
|
14 |
5.1 |
1.8 |
18 |
16 |
78 |
76 |
81 |
89 |
0.2 |
0.2 |
84 |
79 |
|
S |
32,690 |
— |
94,548 |
640 |
13 |
— |
— |
|
|
|
187 |
10 |
9 |
0.1 |
2 |
190 |
184 |
|
-2 |
4 |
1.6 |
16 |
17 |
79 |
76 |
82 |
80 |
0.2 |
0.2 |
74 |
70 |
|
|
30,690 |
— |
427,702 |
437 |
19 |
— |
— |
|
|
Austria |
8.3 |
9 |
9 |
0.0 |
7 |
8.7 |
9.0 |
|
8 |
4.1 |
1.4 |
16 |
16 |
79 |
76 |
82 |
54 |
0.3 |
0.3 |
67 |
65 |
|
L |
33,140 |
— |
32,378 |
256 |
28 |
100 |
100 |
|
|
Belgium |
10.5 |
11 |
10 |
0.1 |
3 |
10.8 |
11.0 |
|
4 |
4.8 |
1.6 |
17 |
17 |
79 |
76 |
82 |
97 |
0.2 |
0.3 |
79 |
75 |
|
S |
32,640 |
— |
11,787 |
893 |
3 |
— |
— |
|
|
France |
61.2 |
13 |
9 |
0.4 |
2 |
63.4 |
64.0 |
|
5 |
3.6 |
1.9 |
18 |
16 |
80 |
77 |
84 |
76 |
0.4 |
0.4 |
75 |
69 |
|
L |
30,540 |
— |
212,934 |
287 |
12 |
— |
— |
|
|
Germany |
82.4 |
8 |
10 |
-0.2 |
1 |
82.0 |
75.1 |
|
-9 |
3.9 |
1.3 |
14 |
19 |
79 |
76 |
82 |
88 |
0.1 |
0.1 |
75 |
72 |
|
L |
29,210 |
— |
137,830 |
598 |
30 |
— |
— |
|
|
Liechtenstein |
0.04 |
11 |
6 |
0.5 |
2 |
0.04 |
0.04 |
26 |
2.9 |
1.4 |
18 |
11 |
80 |
79 |
82 |
21 |
— |
— |
— |
— |
L |
— |
— |
62 |
567 |
40 |
— |
— |
|
|||
Luxembourg |
0.5 |
12 |
8 |
0.4 |
3 |
0.5 |
0.6 |
|
37 |
3.9 |
1.7 |
19 |
14 |
78 |
75 |
81 |
91 |
0.2 |
0.2 |
— |
— |
S |
65,340 |
— |
999 |
460 |
17 |
— |
— |
|
||
Monaco |
0.03 |
23 |
16 |
0.6 |
8 |
0.04 |
0.1 |
|
67 |
— |
— |
13 |
22 |
|
— |
— |
— |
100 |
— |
— |
— |
— |
S |
— |
— |
1 |
44,000 |
26 |
100 |
— |
|
|
Netherlands |
16.4 |
12 |
8 |
0.3 |
-2 |
16.9 |
16.9 |
|
3 |
4.9 |
1.7 |
18 |
14 |
79 |
77 |
81 |
65 |
0.2 |
0.2 |
79 |
76 |
|
S |
32,480 |
— |
15,768 |
1,037 |
14 |
100 |
100 |
|
|
Switzerland |
7.5 |
10 |
8 |
0.2 |
5 |
7.4 |
7.2 |
|
-4 |
4.3 |
1.4 |
16 |
16 |
81 |
79 |
84 |
68 |
0.4 |
0.4 |
57 |
54 |
|
L |
37,080 |
— |
15,942 |
469 |
29 |
100 |
100 |
|
|
© 2006 Population Reference Bureau |
See Notes on page 5. |
2006 World Population Data Sheet 9 |