

Tolerance and Intolerance, 1976-1998
Jeffery J. Mondak; Mitchell S. Sanders
American Journal of Political Science, Vol. 47, No. 3. (Jul., 2003), pp. 492-502.
Stable URL: http://links.jstor.org/sici?sici=0092-5853%28200307%2947%3A3%3C492%3ATAI1%3E2.0.CO%3B2-S
American Journal of Political Science is currently published by Midwest Political Science Association.

STOR
 Your
use of the JSTOR archive indicates your acceptance of JSTOR's Terms
and Conditions of Use, available at
http://www.jstor.org/about/terms.html.
JSTOR's
Terms and Conditions of Use provides, in part, that unless you have
obtained prior permission, you may not download an entire issue of a
journal or multiple copies of articles, and you may use content in
the
JSTOR archive only for your personal, non-commercial use.
Your
use of the JSTOR archive indicates your acceptance of JSTOR's Terms
and Conditions of Use, available at
http://www.jstor.org/about/terms.html.
JSTOR's
Terms and Conditions of Use provides, in part, that unless you have
obtained prior permission, you may not download an entire issue of a
journal or multiple copies of articles, and you may use content in
the
JSTOR archive only for your personal, non-commercial use.
Please contact the publisher regarding any further use of this work. Publisher contact information may be obtained at http://www.jstor.org/journals/mpsa.html.
Each copy of any part of a JSTOR transmission must contain the same copyright notice that appears on the screen or printed page of such transmission.
J STOR
is an independent not-for-profit organization dedicated to and
preserving a digital archive of scholarly journals. Formore
information regarding JSTOR, please contact support@jstor.org.
STOR
is an independent not-for-profit organization dedicated to and
preserving a digital archive of scholarly journals. Formore
information regarding JSTOR, please contact support@jstor.org.
http://www.jstor.org Sat Feb 17 04:52:02 2007
Tolerance and Intolerance, 1976-1998
Jeffery J. Mondak Florida State University Mitchell S. Sanders University of Notre Dame
Early students of political tolerance projected a rapid rise in levels of tolerance, but subsequent research has failed to offer conclusive evidence regarding whether tolerance has, in fact, increased. The General Social Survey (GSS) included the same 15 dichotomous tolerance items in the period 1976-1998, seemingly permitting assessment of trends in tolerance through examination of a standard 0-15 scale. Unfortunately, the validity of these data is uncertain because we cannot rule out the possibility that changes in affect toward the five GSS target groups, not true changes in tolerance, drive movement in the longitudinal series. To address this problem, we reexamine the GSS data from the perspective of past discussions of the meaning of tolerance and intolerance. We argue that that the GSS scale captures two aspects of tolerance: whether respondents are tolerant or intolerant; and, among the intolerant, the breadth and depth of their intolerance. We further argue that the first of these dimensions can be measured validly using the GSS data. Our analyses reveal that, at most, tolerance has increased only marginally in the period 1976-1998.
Numerous theoretical and empirical questions arise when one contemplates the issue of political tolerance. At the empirical level, considerable attention has been directed toward the antecedents of tolerance and intolerance, the consequences of tolerant and intolerant attitudes for social and political behavior, levels of tolerance within a given polity, and trends in tolerance over time. In the present article, our concern is with this last matter, possible longitudinal variance in tolerance. We are hardly the first authors to express interest in this issue. In his classic study of tolerance, Stouffer (1955) speculated on the possibility that levels of tolerance would increase markedly in future years. In subsequent research, Cutler and Kaufman (1975), Davis (1975) and Nunn, Crockett, and Williams (1978) reported that tolerance had, in fact, increased from the 1950s to the 1970s, a claim that was almost immediately refuted by Sullivan, Piereson, and Marcus (1979, 1982). A round of counterclaims followed soon after (e.g., Mueller 1988; Sniderman et al. 1989). Nie, Junn, and Stehlik-Barry (1996) revisited this matter more recently and concluded, much like the 1970s authors, that tolerance is on the rise.
Although assessment of trends in tolerance may seem to be an uncomplicated matter, issues in the measurement of tolerance make it anything but simple. Measurement
was at the core of the Sullivan et al. critique of the Stouffer replications, and subsequent research on tolerance repeatedly has returned to various operational considerations (e.g., Gibson 1992; Finkel, Sigelman, and Humphries 1999; Hurwitz and Mondak 2002). Stouffer (1955) measured tolerance with items that focused on socialists, atheists, and Communists. Using similar items, Nunn, Crockett, and Williams (1978) found sharp increases in tolerance 20 years later, leading the authors to offer boldly optimistic conclusions about trends in tolerance. What Sullivan and his coauthors showed, however, is that the change in tolerance recorded by Nunn et al. most likely was illusory. Most Americans were perfectly willing to deny political rights to disliked groups in the 1970s; they just did not dislike socialists, atheists, and Communists as much in the 1970s as they had in the 1950s. When Sullivan et al. used tolerance questions focused on groups known to be disliked by respondents—a protocol they refer to as "content-controlled"—the resulting view of tolerance was much less optimistic.
Sullivan, Piereson, and Marcus's (1982) critiqueofthe Stouffer tolerance battery ultimately led to an awkward coexistence among two schools of researchers. Starting in 1976, the General Social Survey (GSS) began to use a modified, or balanced, version of the Stouffer battery that
Jeffery
J. Mondak is LeRoy Collins Professor of Political Science, Florida
State University, 540 Bellamy Building, Tallahassee, FL 32306-2230
(jmondak@garnet.acns.fsu.edu). Mitchell S. Sanders is Assistant
Professor of Political Science, University of Notre Dame, 217
O'Shaughnessy
Hall, Notre Dame, IN 46556-5611 (msanderl@nd.edu).
We wish to thank Damarys Canache, Bob Jackson, and several anonymous reviewers for their helpful comments. We are especially grateful to Jared Hurvitz for his research assistance and insightful feedback.
American Journal of Political Science, Vol. 47, No. 3, July 2003, Pp. 492-502
©2003 by the Midwest Political Science Association ISSN 0092-5853
492
TOLERANCE AND INTOLERANCE, 1976-1998
493
includes questions about five ideologically diverse target groups, and countless studies have made use of these data. But even use of a balanced list of target groups does not fully resolve the measurement problem, a fact that Sullivan et al. made quite clear (1982, 48). Gibson (1992) forged something of a reconciliation between the two camps by demonstrating that GSS and content-controlled tolerance dependent variables perform quite similarly in multivari-ate analyses. Unfortunately, that spirit of detente produced no insight regarding the question at hand, namely whether levels of tolerance have changed over time. As Gibson (1992) explained, the standard GSS battery might be adequate for cross-sectional research, but it is still deficient for longitudinal analysis. Thus, we are left with a most disconcerting dilemma: the one data set that provides comparable tolerance measures over an extended period of time is the one data set that does not support valid longitudinal study.
Our task in this article is to make the best of an admittedly imperfect situation. At question is whether meaningful insight regarding trends in tolerance can be gained from analysis of GSS tolerance data. We contend that the answer is yes. However, to derive this insight requires careful reconsideration of both what tolerance means and what the GSS data measure. Our analysis proceeds in three stages. We begin with an assessment of trends in tolerance as depicted by the standard GSS tolerance battery, and we explain in more detail the theoretical and empirical deficiencies associated with such inquiry. We then use these same data to devise an alternate indicator of tolerance. This portion of the presentation requires extended discussion because it is essential that the new indicator be linked explicitly to theoretical conceptions of tolerance and intolerance. Finally, we employ the new measure in a reexamination of trends in tolerance in an effort to determine whether there is any evidence that levels of tolerance have increased over time.
The GSS Modified Stouffer Battery
Since 1976, the GSS has included a modified, or balanced, rendition of the Stouffer tolerance battery. Unlike the original Stouffer items, which focused exclusively on actors on the political left (Communists, socialists, and atheists), the modified battery asks about an array of ideologically diverse groups: racists, militarists, atheists, homosexuals, and Communists. Respondents are asked three dichotomous items per group. The questions address whether members of the target groups should be permitted to deliver public speeches, have books that they
write be available in the public library, and teach in colleges and universities. In past discussions of these data analysts have claimed that the three acts involve fundamental civil liberties (e.g., Bobo and Licari 1989; Cigler and Joslyn 2002).l Researchers typically have summed responses to these items, yielding a 0-15 scale (e.g., Nie, Junn, and Stehlik-Barry 1996).2 We begin our analysis using such a scale, with high values representing greater intolerance.3
Were the modified Stouffer battery a valid indicator of tolerance, assessment of trends in tolerance would be straightforward. Simple review of the data for each available year would reveal whether levels of tolerance have changed. Nie and his coauthors (1996) discuss the GSS data for the period 1976 to 1994 and conclude that a substantial increase in tolerance has occurred. The extended series, with data through 1998, is depicted in Figure 1. Two aspects of the data warrant discussion. First, there appears to be a clear trend toward increasing tolerance. GSS respondents expressed intolerant views on an average of 7.24 of the 15 items in 1977, the second year the modified battery was used, but intolerance dropped to 5.28 out
'This point is debatable. If tolerance refers to the willingness to extend Constitutionally protected rights, then only the items concerning public speeches unequivocally measure tolerance. There is no Constitutional right to teach at a university or to have one's book available in a public library. Any unemployed academic with sluggish book sales can attest to these points. Nonetheless, the book and teaching items are pertinent as measures of tolerance in the sense that they implicitly tap discriminatory treatment; i.e., it is clear that the items are intended to measure whether being a racist, a homosexual, and so on, should disqualify a person from a teaching position and should provide grounds for removal of a book from a library. We feel that use of data from 15 items is appropriate. We are aware of no analyses demonstrating that respondents perceive the five free-speech items differently than the teaching and book questions, and factor analysis results provide evidence of no such distinction. Futher, Sullivan, Piereson, and Marcus (1982) reported that their respondents did not view tolerance questions from the perspective of a constitutional or legal rights framework. Thus, although we can read a legal distinction into the data, this is of no apparent relevance for analyses regarding respondents' perceptions.
2One exception is Bobo and Licari (1989), who draw on factor analysis results to construct three scales from the 15 GSS items.
3We code each of the 15 items as 0 if the respondent agreed that the act should be permitted, and 1 if not. We coded "don't know" responses as 1, meaning that a response counts as tolerant only if respondents explicitly indicate that an act should be permitted. Following Gibson (1992), we could have coded "don't know" responses as 0.5. However, that approach is not applicable with the alternate coding procedure we develop below. We also considered giving respondents the benefit of the doubt, with "don't know" responses coded as tolerant. However, in light of the possibility that some respondents select "don't know" to mask what they perceive to be socially undesirable views (e.g., Berinsky 1999), we opted for the more cautious coding option.
494
JEFFERYJ. MONDAK AND MITCHELL S. SANDERS
Figure 1 The 0-15 GSS Modified Stouffer Tolerance Battery, 1976-1998
(high scores represent intolerance)
1 5
5
7.24(1977)
5.28(1998)
1998
1976
of
15 by 1998, a decrease of over 27%.4
This stark change rivals
in magnitude the movement in tolerance that purportedly took
place from the 1950s to the 1970s (Nunn, Crockett,
and Williams 1978). Second, in all years Americans
seem to be more tolerant than intolerant. The GSS battery
offers respondents 15 opportunities to express intolerance,
but these data indicate that respondents chose tolerance
over half of the time in every year in the series. Unfortunately,
analysis of trends in tolerance is not so
easily accomplished. Reduced to its essentials, the objection
raised by Sullivan, Piereson, and Marcus (1982) to
the original Stouffer battery was two-fold: respondents almost
certainly differ in terms of how many of the target groups they
dislike, and, in the aggregate, affect toward
the target groups may change over time. Variants of these
same points apply to the modified Stouffer battery. Sullivan
and his colleagues argue that tolerance presupposes that the
individual dislikes the group or groups in question.
Using the 0-15 GSS scale, we have no means to determine
how often this prerequisite has been met. For
4The change is statistically significant. Two tests were conducted to establish this point. First, we simply regressed intolerance on year (b = —0.09, R2 = 0.90). Second, we used spline regression to determine whether the rate of change in intolerance varied during the 1976-1998 series. We estimated spline models with two knots, thus dividing the series into three segments. Doing so is useful for present purposes because it permits us to gauge whether change was especially abrupt for a limited period within the broader series. This is precisely what we found in the current case. The model that performed best was one with two knots, at 1988 and 1989 (R2 = 0.97). Significant coefficients were obtained for each segment, suggesting a steady decrease in intolerance until 1988 (b = -0.05), a sharp decrease from 1988 to 1989 (b = -0.60), and a second steady decrease starting in 1989 (b = —0.07).
example, respondents may receive scores of nine because they dislike three of the GSS groups and they are fully intolerant toward them, or because they dislike four of five of the groups but are willing to extend limited political rights to those groups.
More troubling for present purposes is the possibility of changing affect toward the GSS target groups. Sullivan et al. argued that this is precisely what took place between the 1950s and the 1970s with respect to atheists, socialists, and Communists. The increase in tolerance was an illusion because antipathy toward these target groups decreased, and the change in feelings toward these specific groups was mistaken for movement in tolerance. Unfortunately, there is no way to rule out a similar phenomenon with the modified Stouffer battery. Suppose, for example, that respondents in 1977 disliked an average of three of the five GSS groups. In this scenario, the typical respondent had nine opportunities to be intolerant, or three per disliked group. This would mean that these respondents expressed intolerance 80% of the time (7.24/9 = 0.80). Now suppose that in 1998 respondents disliked an average of only two of the GSS groups. In this scenario, intolerance would be greater in 1998 than in 1977 (in 1998, 5.28/6 = 0.88), but systematic change in group affect would create the illusion that intolerance has diminished.
Evidence that changes in group affect influence the apparent trend depicted in Figure 1 emerges when we break the 15 GSS items down by the five target groups referenced in those questions. If the trend portrayed in Figure 1 represents a true change in tolerance, then we should observe little variance when comparing the longitudinal data for the five GSS target groups. However, if the observed trend instead represents changing feelings toward one or more of the GSS groups, then we should see different longitudinal patterns when the data are disaggregated. Figure 2 depicts data for two GSS target groups, racists, and homosexuals. The patterns differ starkly. Intolerance toward homosexuals decreased by 44% from 1976 to 1998, but intolerance toward racists is quite steady during this period, decreasing by less than 9%.5 Intolerance toward each of the other three GSS groups—atheists,
5 For tolerance toward racists, the decline reported in Figure 2 attains statistical significance even though the substantive effect is slight (b = —0.005, R2 = 0.49). Much stronger results are obtained when tolerance toward homosexuals is regressed on year (b = —0.029, R2 = 0.91). We also used spline regression, once again estimating all possible models with two knots. For racists, the best model has knots at 1987 and 1989 (R2 = 0.78). The coefficient for the segment that runs from 1987to 1989 is statistically significant, butthe coefficients for the earlier and later segments are not. For homosexuals, the best model has knots at 1988 and 1989 (R2 = 0.97). The coefficients for all three segments are statistically significant, but the greatest substantive effect is for the brief 1988-1989 segment.
TOLERANCE AND INTOLERANCE, 1976-1998
495
Figure
2
Intolerance Toward Racists and
Homosexuals,
1976 to 1998
2
1.43(1985)
1.28 f 19981
Racists
Homosexuals
1.34(1977)

1976
1998
c ommunists,
and militarists—decreased by approximately
28% in this same period. These data suggest that the
trend depicted in Figure 1 likely is not
wholly
the consequence
of a general increase in tolerance, but instead is
at least partly the result of changes in group-specific attitudes.
ommunists,
and militarists—decreased by approximately
28% in this same period. These data suggest that the
trend depicted in Figure 1 likely is not
wholly
the consequence
of a general increase in tolerance, but instead is
at least partly the result of changes in group-specific attitudes.
Our claim is not that changes in group affect account for the entire trend observed in Figure 1, but rather that the GSS data provide no definitive means to rule out a role for group affect. As a result, it is simply not possible to speak confidently about trends in tolerance using the 0-15 scale.6 But this does not mean that the GSS data necessarily should be abandoned. The easiest treatment of the GSS data involves summing responses to the 15 tolerance items, but little in the way of theory justifies this approach. It is our contention that a more theoretically appropriate indicator of tolerance can be devised from the GSS data and that this indicator offers a functional means to assess longitudinal variance in tolerance. Demonstration of these points requires discussion of the meaning of tolerance and intolerance.
Tolerance and Intolerance
GSS data reveal what appears to be a substantial decrease in intolerance over the period 1976-1998, but application
6Note that our argument solely concerns changes in aggregate-level tolerance over time. Gibson (1992) demonstrates that analyses using the GSS battery and content-controlled data yield highly similar results in individual-level inquiries. As a result, Gibson concludes that the GSS data are adequate for cross-sectional study despite their deficiencies for longitudinal analysis. Nothing in our analysis counters this conclusion, although we will have a bit more to say below about use of the GSS data in individual-level tests.
of the logic outlined by Sullivan and his colleagues raises serious doubts regarding whether this decrease reflects a true change in tolerance. The dearth of more appropriate longitudinal data means that if we are to divine any insight regarding trends in tolerance, we must somehow make use of the GSS data, their warts and blemishes notwithstanding. But this does not mean that the only available course of action entails assessment of the conventional GSS 15-point tolerance index. We believe that an alternate treatment of the GSS data provides a more valid indicator of levels of tolerance. To demonstrate this point, it is necessary to reexamine both the meaning of tolerance and intolerance and what it is that the GSS items actually measure.
Although the content-controlled procedure developed by Sullivan, Piereson, and Marcus (1982) brought dramatic change to the study of political tolerance, these same authors' contributions at the theoretical level are equally important. Sullivan and his coauthors approach tolerance from several theoretical perspectives and carefully assess the role of tolerance from various conceptions of democracy. For present purposes, however, what is most important is the meaning of tolerance itself. Sullivan et al. argue that tolerance "implies a commitment to the 'rules of the game' and a willingness to apply them equally" (1982,2). "Political tolerance exists when respondents allow the full legal rights of citizenship to groups they themselves dislike" (1982, 76).
Many analysts have raised objections to Sullivan, Piereson, and Marcus's measurement procedure, but far fewer disagree with their conception of tolerance. For in stance, Nie, Junn, and Stehlik-Barry (1996) reject Sul livan et al.'s content-controlled approach in favor of the 0-15 GSS battery, yet their definition of tolerance is nearly identical to the one presented by Sullivan and his coau thors. Specifically, Nie et al. write that "Tolerance is the belief that all citizens have the right to express their po litical views, regardless of how dangerous or repugnant those views may be.... (T)olerance signals a fundamen tal commitment to the rules of the democratic game
(A) high degree of tolerance signifies the recognition of the importance of allowing all in the political community the right to express their views, regardless of the content" (1996,29).
We see three important implications in this view of tolerance. First, Sullivan, Piereson, and Marcus are correct that the definitive test of tolerance presupposes that the perceiver dislikes the target group.7 It does not count as
7 Some confusion exists in the tolerance literature because of a failure to distinguish clearly the standards for identification of tolerance and intolerance. Again, we concur with Sullivan et al. that negative
496
JEFFERYJ. MONDAKAND MITCHELL S. SANDERS
tolerance, for instance, if a Communist is willing to extend political rights to fellow Communists. This point places the GSS tolerance battery on uncertain ground. Gibson (1992, 574) captures well both the good news and the bad. The virtue of the GSS scale is that nearly everyone dislikes at least one of the five target groups, which means that nearly every respondent has some opportunity to express tolerance. The problem, as we have seen, is that some respondents may dislike only one or two of the five groups, whereas others may dislike three, four, or even all five.
The second implication we see in the Sullivan et al. definition of tolerance is that the question of tolerance versus intolerance is inherently dichotomous, not continuous. This point is critical to our argument. People are tolerant to the extent that they are willing to grant the full rights of citizenship uniformly and without exception. It follows that people are intolerant provided that they advocate any restriction of political acts that are otherwise permissible under law. Put differently, it is the exception that signals intolerance. When respondents answer "no, I do not believe that members of group X should be permitted to engage in act Y," they have carved out exceptions in the extension of political rights, and thus have identified themselves as being politically intolerant.
If we assume for the moment that all respondents dislike at least one of the five GSS groups, then all respondents have some opportunity to carve out an exception, thereby signaling intolerance. Viewed in this manner, what matters for diagnosing whether a person is tolerant is not the respondent's score on the 15-point GSS tolerance battery, but rather whether the respondent received a score of zero (tolerant) or greater than zero (intolerant). We know that a respondent is intolerant as soon as he or she expresses the desire to restrict political rights.8
Scores on the conventional GSS scale range from 0 to 15, yet we have argued that a single point on the scale
affect toward a group is a precondition for conclusive identification of tolerance. However, negative affect toward a group is not a precondition for identification of intolerance. Some people may wish to deny the full rights of citizenship to people or groups toward whom they hold neutral or even positive affect (see Finkel, Sigelman, and Humphries 1999; Hurwitz and Mondak 2002; Lawrence 1976; Sniderman et al. 1989). Intolerance toward groups one likes seems most plausible when the act in question is itself controversial. For instance, we highly doubt that many people would say that a book written by a New York firefighter or a renowned artist should be removed from a public library, but large numbers of survey respondents may say that the firefighter and artist should not be permitted to burn a U.S. flag.
8Mueller (1988, 5) presents an approach roughly comparable to ours in that he reported what portion of the original Stouffer respondents was willing to permit free speech rights to all of four groups: atheists, socialists, Communists, and alleged Communists.
divides tolerance from intolerance. What does this mean for values between 1 and 15? Surely, as Sniderman et al. (1989) note, it would be unfair to equate an individual who is intolerant toward only one group with a person who espouses intolerance at every opportunity. The third implication we see in the Sullivan et al. definition of tolerance is that levels of intolerance differ in both breadth and depth. Under our conceptualization, all GSS respondents who receive scores greater than zero are intolerant, but their levels of intolerance vary. At least three factors potentially contribute to this variance. First, respondents may differ in the number of groups they tolerate; i.e., in the breadth of intolerance. Consider two respondents, for example, both of whom dislike all five GSS groups. If one is fully intolerant of all five groups, and the other is intolerant of only two of the groups, their respective scores on the GSS battery will be 15 and 6. Second, and similarly, respondents may differ in the number of acts they tolerate; i.e., in the depth of intolerance. One respondent who dislikes atheists may wish to deny atheists all civil liberties, whereas a second respondent may feel that it is acceptable for the atheist to write a book or to deliver a public speech, but not to teach at a college or university.9 We see obvious importance in levels of intolerance and in efforts to identify factors that lead intolerance to vary in breadth and depth. Unfortunately, the GSS data simply are not well suited to this sort of inquiry. As we noted in the previous section, Sullivan and his colleagues provide the reason. For those GSS respondents who are intolerant, their scores will vary as a function of the breadth and depth of intolerance, but also as a function of a third factor, how many of the five GSS groups they dislike. Respondents who dislike all five GSS groups are afforded greater opportunity to express intolerance than are respondents who dislike only two of the groups. In most years, no data are available to determine conclusively how many of the five groups respondents dislike. As a result, we are left with a scale constructed with a known numerator but an unknown denominator.
9 At first glance, one criticism of Sullivan et al.'s content-controlled approach applies with equal or greater force to the view developed here. Finkel, Sigelman, and Humphries (1999, 214) say that the content-controlled measure "may tap a respondent's least typical response tendency" (see also Wagner 1986). The point is that content-controlled data do not reveal whether an intolerant individual is generally intolerant or intolerant only toward one or two select groups. On closer inspection, it should be clear that our approach is fully consistent with this point of view. The respondent who receives a score greater than zero is intolerant, but we do not know the depth or breadth of that person's intolerance. That information, however, is embedded in the 1-15 portion of the scale. That is, what Finkel and his coauthors have claimed is, in essence, that people who are intolerant vary in the breadth and depth of their intolerance.
TOLERANCE AND INTOLERANCE, 1976-1998
497
To reiterate, our claim is that assessments of tolerance and intolerance logically involve two questions: whether individuals are tolerant or intolerant, and, among the intolerant, whether that intolerance is broad or narrow in scope. Further, GSS data are not appropriate to measure possible variance over time in the breadth and depth of intolerance, but may be adequate to gauge whether the proportion of Americans who are tolerant has changed. The central problem with analyses concerning levels of intolerance is that longitudinal variance may be driven by changing affect toward the five GSS target groups. For example, if 50% of respondents are fully intolerant toward all groups they dislike, but they dislike fewer groups in 1998 than in 1976, then longitudinal analysis of GSS data would risk mistaking the change in group affect for a shift in levels of tolerance.
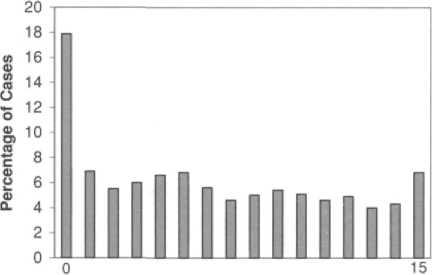
Figure 3 Responses to the GSS Modified Stouffer Tolerance Battery, 1976-1998 (bars indicate the number of acts toward which respondents express intolerance)
 A
Comment on Individual-Level Analysis
A
Comment on Individual-Level Analysis
Our empirical objective in this article is to provide what evidence we can regarding whether levels of tolerance have changed over time. However, it is worth noting that the view of the GSS tolerance battery developed here also has consequences for individual-level inquiries. Both theoretically and empirically, a score of 0 on the GSS battery is qualitatively different from scores between 1 and 15. Respondents who receive scores of 0 are presumed to be tolerant, whereas respondents who receive scores greater than 0 are intolerant. Most empirical studies that make use of the GSS data employ the 0-15 scale as the dependent variable in OLS regression models. One implication of our thesis is that modeling the data in such a manner is inappropriate. A one-unit shift from a score of 0 to a score of 1 is not comparable to any other one-unit shift, such as that from a score of 12 to a score of 13. The former marks the difference between tolerance and intolerance; the latter merely signals intolerance that varies slightly in scope.
The claim that 0 scores on the GSS battery are qualitatively unique rests on theory, but one bit of corroborative empirical evidence is provided by the actual raw data. Figure 3 depicts the distribution of responses on the 0-15 battery for the period 1976-1998. Nearly 18% of respondents received scores of 0, a mark nearly triple that of the next-highest category. This distribution is consistent with our thesis that the 0-15 scale encompasses more than a single unidimensional construct. Hence, whether viewed theoretically or empirically, scores of 0 on the GSS battery do indeed stand out from all other scale values.10
10Most authors who make use of the 0-15 measure simply assume that it represents a single unidimensional construct. Nie, Junn, and
Given the unique meaning of 0, how should the GSS data be treated in individual-level models? The clear implication of the preceding discussion is that conventional single-equation models are inappropriate because they do not capture the theoretical distinction between tolerance, as represented by scale values of 0, and levels of intolerance, as represented by values between 1 and 15. One alternate would be use of a selection equation, with the initial equation used to model tolerance versus intolerance and the second equation used to model the degree of intolerance. Zero-inflated techniques offer a second plausible alternate, as these allow the analyst to represent the unique meaning of scale values of 0 on the dependent variable. '' Selection models and zero-inflated models possess advantages and disadvantages relative to one another, and we will leave it to future discussion to determine if one is superior for analysis of individual-level GSS tolerance data. For now it is sufficient to note that each approach maps to the theorized underlying structure of the GSS data far better than does a single-equation OLS model.
Stehlik-Barry (1996) test the matter empirically, and find strong evidence that the 15 items load on a single factor and combine to form a highly reliable scale. Note, however, that empirical results such as these do not constitute evidence against the theory-based position we have taken. We do not claim that the various items in the GSS battery tap different constructs, but rather that the 0-15 scale itself captures multiple constructs.
nOur argument regarding alternate treatments of the 0-15 scale applies equally well to many other "count" variables. If our dependent variable were the number of murders a person has committed, for instance, a score of zero would be fundamentally different from any nonzero score. In the political realm, participation logically might be modeled using one of the approaches discussed here for reasons similar to those we have raised with respect to tolerance.
498
JEFFERYJ. MONDAKAND MITCHELL S. SANDERS
Strengths and Weaknesses of the Dichotomous Indicator
Returning to the central matter at hand, the question of whether tolerance levels have changed over time, additional discussion is warranted regarding our proposed dichotomous measure. We contend that respondents who receive scores greater than 0 can be labeled conclusively as intolerant because these respondents have expressed an unwillingness to extend full political rights to all citizens. Matters are not quite as clear with respect to respondents who receive scores of 0. Ideally, we would be able to claim that all respondents with scores of 0 are tolerant because these respondents are willing to apply political rights without exception. One constraint, however, is that some respondents may not have been asked about an actor, or, more specifically, an act-actor combination, toward which they feel antipathy. We are on solid ground only if Gibson (1992) is correct that the GSS battery offers something for everyone to dislike. Social desirability biases constitute a second possible constraint. If some respondents feel compelled to disguise intolerance, and especially if any such tendency has increased over time, then longitudinal analysis would be compromised.
Gibson's (1989, 1992) contention that the modified Stouffer battery offers something for everyone to dislike is premised on supplemental data gathered in conjunction with the 1987 GSS, the 1987 Freedom and Tolerance in the United States survey. Respondents were asked the GSS tolerance items, but they also were asked to identify the four groups they disliked the most. Four groups— Communists, atheists, militarists, and homosexuals— were common to the two batteries. Racists constitute the fifth group on the conventional GSS tolerance battery, a more than suitable match to two groups mentioned on the supplemental survey, the KKK and American Nazis.
For the dichotomous measure we have advanced to be on more solid ground it would have to be the case that all, or at least nearly all, respondents named one or more of the five GSS groups as being among the groups they most disliked. The relevant data are depicted in Table 1. The five GSS target groups provided the number one disliked group for 94% of respondents and the number one or number two group for over 99%. Every single respondent who named a disliked group listed a GSS target group as one of their four most disliked groups, and all but a handful of respondents named two. Gibson's assessment is right on the mark. Although respondents may vary in how many of the five GSS groups they dislike, all respondents dislike at least one of the groups, which means that
Table 1 Negative Affect Toward the Target
Groups on the GSS Modified Stouffer Battery (cell entries depict the percentage of respondents naming GSS groups as disliked among respondents who had at least one disliked group)
First
disliked group 94.0
First or second disliked group 99.4
First, second, or third disliked group 99.9
First, second, third, or fourth disliked group 100.0
Two or more groups among top four disliked groups 99.5
Source:Freedom
and Tolerance in the United States, main sample; N
= 945.
the modified Stouffer battery offers all respondents at least some opportunity to be intolerant.12
The data in Table 1 are from 1987, the midpoint of the longitudinal series under consideration. Our analyses still would be in question were it the case that 1987 marked a unique high point in antipathy toward the GSS groups, but we find this to be implausible. There certainly is no reason to suspect that Americans viewed these groups more favorably in the years prior to 1987, and thus empirical analysis should be on rock-solid ground for the period 1976-1987. Communists, of course, became less relevant as a target group soon after 1987, and we have seen that Americans' hostility toward homosexuals apparently lessened in the 1990s. These changes make analysis more speculative for the period 1987-1998, but only modestly so. Data in Figure 2 show that, at best, Americans' feelings toward racists warmed only fractionally in the 1990s, and the KKK was far and away the most disliked group in 1987. Thus, we are highly confident that essentially all GSS respondents in the period 1976—1998 were asked tolerance questions targeted toward one or more groups they strongly disliked.
Social desirability biases present the second possible source of error in our measure. If respondents perceive
!2These results clearly would be less noteworthy were it the case that the Freedom and Tolerance battery included a small number of groups, or if a large number of respondents reported disliking no groups, but neither of these occurred. Before being asked to identify their least-liked groups, respondents first were asked the extent to which they liked or disliked 13 groups, only six of which map to the standard GSS battery. Additionally, respondents were encouraged to name groups beyond these 13 that they also strongly disliked. Over 40 groups ultimately made the list among respondents' four most least-liked groups, yet 100% of respondents who named a disliked group included at least one GSS group among their four. Lastly, over 99.6% of respondents named at least one disliked group.
TOLERANCE AND INTOLERANCE, 1976-1998
499
tolerant answers to be socially preferred, then respondents with scores of 0 may include some people who are merely attempting to mask their intolerance. Given the present focus on possible changes in tolerance, a social desirability effect would be especially problematic were there reason to suspect that it operated most strongly at different points in the GSS series.
If tolerance data are, in fact, confounded by a time-varying social desirability effect, data gathered in accordance with the Sullivan, Piereson, and Marcus content-controlled procedure would not be immune to this bias. Thus, although the GSS data are imperfect on various counts, this is one situation in which the most commonly used alternate offers no improvement. But we know of no definitive evidence to suggest that the bias discussed here exists, let alone that it has increased in magnitude in recent years.
Although the possible existence of a time-varying social desirability effect cannot be tested conclusively, some relevant data are available. If a social desirability bias is present, it follows that some intolerant respondents deliberately disguised their true opinions by voicing tolerant answers. But an alternate form of disguise is also available, the "don't know" response. Focusing on survey questions about race, Berinsky (1999) demonstrated that "don't know" responses can be inflated by social desirability effects. In the present case, this would suggest that some intolerant respondents chose "don't know" as a middle ground option between admitting to socially undesirable intolerance and voicing disingenuous views. Provided that we can safely assume that any social pressure on respondents induces some to take refuge in the "don't know" response, analysis of trends in these responses should reveal whether there is circumstantial evidence of a time-varying effect.
The "don't know" marks for the 15-item GSS battery are depicted in Figure 4. The mean number of "don't know" responses is always quite small, and the data vary within a fairly narrow margin. "Don't know" responses do increase over time (b = 0.005, p < .05), but the change is very slight and, as can be observed in Figure 4, the increase is hardly steady. The evidence is consistent with the possibility that a social desirability bias has become minutely more pronounced over time, and thus caution will be warranted below when trends in intolerance are reconsidered.
The dichotomous measure of tolerance we have proposed is not ideal, but we believe that it represents our best available means to assess patterns in tolerance over time. Content-controlled measures are not available for a period sufficient to support meaningful longitudinal analysis, and the conventional 15-item GSS battery is of highly
F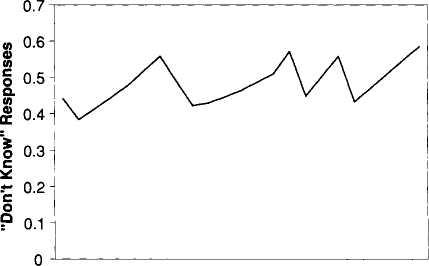 igure4
Mean Number of "Don't Know" Responses
on the GSS Modified Stouffer
Tolerance Battery, 1976-1998
igure4
Mean Number of "Don't Know" Responses
on the GSS Modified Stouffer
Tolerance Battery, 1976-1998
1998
1976
uncertain
validity. In comparison, the dichotomous measure fares quite
well. The bottom line is that respondents who receive scores greater
than zero on the GSS batterycan
be identified conclusively as intolerant, and respondents who
receive scores of zero can be identified with considerable
confidence as tolerant. Thus, analysis of the dichotomous
data will reveal the upper bound of tolerance
and the lower bound of intolerance for each available year
in the period 1976-1998.
Levels of Political Tolerance, 1976-1998
At the outset of this article we began discussion of trends in tolerance with a look at variance over time in mean levels of intolerance as measured by the GSS's 0-15 modified Stouffer scale. That analysis revealed two noteworthy points. First, intolerance appeared to have decreased rather substantially between 1976 and 1998, dropping over 27% in just 22 years. Second, Americans as a whole appeared to be more tolerant than intolerant during the entire series in that, on average, respondents each year were willing to permit a majority of the 15 act-actor combinations. As we have seen, though, great suspicion is cast on both of these points when the validity of the GSS modified Stouffer battery is taken into account.
As an alternate to the conventional GSS index, we have advocated use of a dichotomous measure that distinguishes respondents known to be intolerant from those who offered zero intolerant replies on the 15-item battery. The resulting data are shown in Figure 5. What do these
500
JEFFERYJ. MONDAKAND MITCHELL S. SANDERS
Figure 5 A Dichotomous Measure of Tolerance and Intolerance, 1976-1998
0.85(1988)
1
0.79(1998)
0.9 -- 0.8 -1 0.7 S 0.6-
1998
0.5 -0.4-0.3-0.2 0.1 -0
1976
data
reveal regarding possible changes in levels of tolerance?
First, intolerance does decrease over the course ofthe
series, albeit by the relatively modest margin of slightly less
than six percentage points, from highs of 85% in 1977 and
1988 to a low of just over 79% in 1998. Thus, most of the much
sharper decline seen in Figure 1 is the consequence of changing
levels of intolerance, and perhaps of
a waning of group-based antipathy. In contrast, actual tolerance
apparently increased only marginally. Second, virtually
no variance in levels of intolerance is observed in
the period 1976-1989; intolerance ranges between 82% and
85% during this entire period. This is important because
the validity of the dichotomous measure is much more certain through
1987, the year group dislike data are
available, than for later years.13
There is no
significant
change in intolerance during the 14-year period in which
validity is more assured. Third, the shift observed here marks the
greatest possible extent to which intolerance
decreased. We observe what appears to be a slight decrease
in intolerance after 1989, but we cannot rule out the
possibility that some of the observed change is attributable
to a warming of affect toward the GSS target groups
rather than to true movement toward tolerance. The
decrease in intolerance may be lower than suggested in
Figure 5 if some GSS respondents in the 1990s found
13A significant effect for time is recorded when we regress intolerance on year (b = —0.002, R2 = 0.54). Different results emerged, however, with spline regression. Once again, we estimated all possible spline models with two knots. The best fit was for a model with knots at 1989 and 1990 (R2 = 0.77). That model corroborates what visual inspection of Figure 5 suggests: intolerance is unchanged in the period 1976 to 1989 and in the period 1990 to 1998, but a statistically significant coefficient of —0.031 is recorded for the 1989-1990 segment.
no groups they disliked, meaning that they had no opportunity to voice intolerance. The bottom line is that intolerance as conceptualized apparently here did decrease in the period 1976-1998, but only by an extremely modest margin.
In their comparison of tolerance data gathered using a Stouffer battery and tolerance data gathered using the content-controlled procedure, Sullivan, Piereson, and Marcus (1982) noted that levels of tolerance appeared dramatically lower under the latter. A similar pattern of results emerges here. Although we saw in Figure 1 that most GSS respondents are willing to permit over half of the 15 acts, we now see that the vast majority of respondents are unwilling to extend civil liberties uniformly to all individuals and groups. In this sense, the current approach yields a depiction of tolerance quite similar to that presented by Sullivan et al. Our procedure offers a stringent test of tolerance because respondents are only deemed tolerant if they are willing to put up with three acts conducted by each of five controversial actors; overall, some 18% of GSS respondents pass this test, including only about 15% in the late 1970s and early 1980s. Similarly, using content-controlled data, Sullivan and his coauthors (1982, 67) found as few as 16% of respondents to be tolerant in 1978 as measured by the individual items on their six-question political-tolerance battery.
Our measure and the Sullivan et al. indicator produce comparably low estimates of political tolerance because both recognize tolerance only if respondents have agreed to put up with that which they find to be objectionable. It should be clear that neither of these approaches is perfect. A few people may extend rights to their most disliked groups while denying those same rights to others (McCutcheon 1985).14 Likewise, some respondents who received scores of 0 on the GSS battery may have garnered scores greater than 0 had the questions focused on other groups or other acts. But this means that, if anything, the best available measures of political tolerance slightly overstate, not understate, tolerance levels. Hence, any error would not alter the fundamental implications of the present analysis: in the years 1976 to 1998, only a small minority of Americans was willing to extend the full rights of citizenship without exception, and the ranks of this tolerant minority grew only haltingly over time.
14Our measure offers a slight improvement over Sullivan et al.'s content-controlled approach on this score. To reiterate, the problem is that some people may dislike multiple groups and express lesser intolerance of the group they like the least than of some other group. Given that nearly all GSS respondents dislike at least two of the five target groups, the current measure minimizes the risk of this type of error.
TOLERANCE AND INTOLERANCE, 1976-1998
501