

Диплом ИМЭ, ССК / Диплом / diplom / Приложения / HANDBOOK_DOD-Systems-Engineering-Guide-2001-01
.pdfChapter 14 Metrics
Product Affordability Metrics DoD and Industry Policy on Product Metrics
Estimated unit production cost can be tracked during the design effort in a manner similar to the TPM approach, with each CI element reporting an estimate based on current design. These estimates are combined at higher WBS levels to provide subsystem and system cost estimates. This provides a running engineering estimate of unit production cost, tracking of conformance to Design-to-Cost (DTC) goals, and a method to isolate design problems relating to production costs.
Life cycle affordability can be tracked through factors that are significant in parametric life cycle cost calculations for the particular system. For example, two factors that reflect life cycle cost for most transport systems are fuel consumption and weight, both of which can be tracked as metrics.
Timing
Product metrics are tied directly to the design process. Planning for metric identification, reporting, and analysis is begun with initial planning in the concept exploration phase. The earliest systems engineering planning should define the management approach, identify performance or characteristics to be measured and tracked, forecast values for those performances or characteristics, determine when assessments will be done, and establish the objectives of assessment.
Implementation is begun with the development of the functional baseline. During this period, systems engineering planning will identify critical technical parameters, time phase planned profiles with tolerance bands and thresholds, reviews or audits or events dependent or critical for achievement of planned profiles, and the method of estimation. During the design effort, from functional to product baseline, the plan will be implemented and continually updated by the systems engineering process. To support implementation, contracts should include provision for contractors to provide measurement, analysis, and reporting. The need to track product metrics ends in the production phase, usually concurrent with the establishment of the product (as built) baseline.
Analysis and control activities shall include performance metrics to measure technical development and design, actual versus planned; and to measure [the extent to which systems meet requirements]. DoD 5000.2-R.
The performing activity establishes and implements TPM to evaluate the adequacy of evolving solutions to identify deficiencies impacting the ability of the system to satisfy a designated value for a technical parameter. EIA IS-632, Section 3.
The performing activity identifies the technical performance measures which are key indicators of system performance...should be limited to critical MOPs which, if not met put the project at cost, schedule, or performance risk. IEEE 1220, Section 6.
14.2 EARNED VALUE
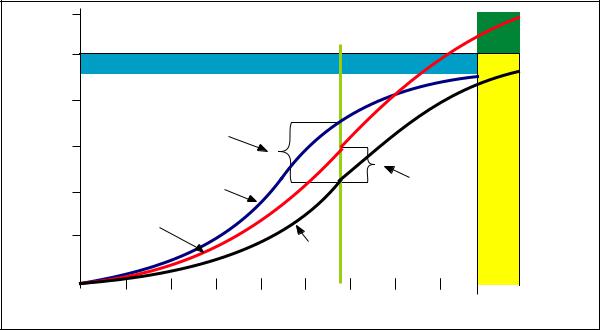
Earned Value is a metric reporting system that uses cost-performance metrics to track the cost and schedule progress of system development against a projected baseline. It is a “big picture” approach and integrates concerns related to performance, cost, and schedule. Referring to Figure 14-1, if we think of the line labeled BCWP (budgeted cost of work performed) as the value that the contractor has “earned,” then deviations from this baseline indicate problems in either cost or schedule. For example, if actual costs vary from budgeted costs, we have a cost variance; if work performed varies from work planned, we have a schedule variance. The projected performance is based on estimates of appropriate cost and schedule to perform the work required by each WBS element. When a variance occurs the system engineer can pinpoint WBS elements that have potential technical development problems. Combined with product metrics, earned value is a powerful technical management tool for detecting and understanding development problems.
Relationships exist between product metrics, the event schedule, the calendar schedule, and Earned
127
Systems Engineering Fundamentals |
Chapter 14 |
Total Allocated Budget |
Over |
EAC |
|
Budget |
|
|
|
|
|
Management Reserve |
|
|
P |
|
|
|
|
|
|
|
|
PMB |
|
|
R |
|
|
|
|
|
O |
|
|
|
|
|
J |
|
|
|
|
|
E |
|
|
Schedule Variancec |
|
|
C |
$ |
|
|
|
T |
|
|
|
|
|
E |
|
|
|
|
|
|
D |
|
|
BCWSc |
Cost Variancec |
|
S |
|
|
|
L |
||
|
|
|
|
|
I |
|
|
ACWPc |
|
|
P |
|
|
|
|
P |
|
|
|
|
|
|
A |
|
|
BCWPc |
|
|
G |
|
|
|
|
|
E |
|
|
|
|
||
|
|
Time |
Completion |
||
|
|
Now |
|
Date |
|
Figure 14-1. Earned Value Concept
Value:
•The Event Schedule includes tasks for each event/exit criteria that must be performed to meet key system requirements, which are directly related to product metrics.
•The Calendar (Detail) Schedule includes time frames established to meet those same product metric-related objectives (schedules).
•Earned Value includes cost/schedule impacts of not meeting those objectives, and, when correlated with product metrics, can identify emerging program and technical risk.
14.3 PROCESS METRICS
Management process metrics are measurements taken to track the process of developing, building, and introducing the system. They include a wide range of potential factors and selection is program unique. They measure such factors as availability of resources, activity time rates, items completed, completion rates, and customer or team satisfaction.
Examples of these factors are: number of trained personnel onboard, average time to approve/disapprove ECPs, lines of code or drawings released, ECPs resolved per month, and team risk identification or feedback assessments. Selection of appropriate metrics should be done to track key management activities. Selection of these metrics is part of the systems engineering planning process.
How Much Metrics?
The choice of the amount and depth of metrics is a planning function that seeks a balance between risk and cost. It depends on many considerations, including system complexity, organizational complexity, reporting frequency, how many contractors, program office size and make up, contractor past performance, political visibility, and contract type.
14.4 SUMMARY POINTS
•Management of technical activities requires use of three basic types of metrics: product metrics that track the development of the product, earned value which tracks conformance to the
128

Chapter 14 Metrics
planned schedule and cost, and management |
• TPMs are performance based product metrics |
process metrics that track management activi- |
that track progress through measurement of key |
ties. |
technical parameters. They are important to the |
|
systems engineering process because they con- |
• Measurement, evaluation and control of metrics |
nect operational requirements to measurable |
is accomplished through a system of periodic |
design characteristics and help assess how well |
reporting that must be planned, established, and |
the effort is meeting those requirements. TPMs |
monitored to assure metrics are measured |
are required for all programs covered by DoD |
properly, evaluated, and the resulting data |
5000.2-R. |
disseminated. |
|
129
Systems Engineering Fundamentals |
Chapter 14 |
SUPPLEMENT 14-A
TECHNICAL PERFORMANCE
MEASUREMENT
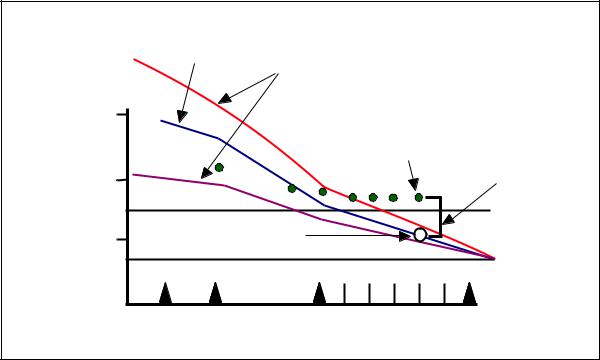
Technical Performance Measurement (TPM) is an analysis and control technique that is used to: (1) project the probable performance of a selected technical parameter over a period of time, (2) record the actual performance observed of the selected parameter, and (3) through comparison of actual versus projected performance, assist the manager in decision making. A well thought out program of technical performance measures provides an early warning of technical problems and supports assessments of the extent to which operational requirements will be met, as well as assessments of the impacts of proposed changes in system performance.
TPMs generally take the form of both graphic displays and narrative explanations. The graphic, an example of which is shown in Figure 14-2, shows the projected behavior of the selected parameter as a function of time, and further shows actual observations, so that deviations from the planned profile can be assessed. The narrative portion of the report should explain the graphic, addressing the reasons for deviations from the planned profile, assessing the seriousness of those deviations, explaining actions underway to correct the situation if required, and projecting future performance, given the current situation.
|
|
Planned |
|
|
|
Profile |
Tolerance |
|
|
|
|
|
|
|
Band |
|
15 |
|
|
Technical |
|
|
Achieved |
|
|
To Date |
|
Parameter |
10 |
|
Variation |
Value |
|
||
|
|
||
e.g., Weight |
|
|
Threshold |
|
|
Planned |
|
|
5 |
|
|
|
|
Value |
|
|
|
|
|
|
|
|
Goal |
|
|
|
Milestones |
|
|
|
TIME |
Figure 14-2. Technical Performance Measurement – The Concept
130
Chapter 14 |
Metrics |
Parameters to be tracked are typically based on the combined needs of the government and the contractor. The government program office will need a set of TPMs which provide visibility into the technical performance of key elements of the WBS, especially those which are cost drivers on the program, lie on the critical path, or which represent high risk items.
The TPMs selected for delivery to the government are expected to be traceable to the needs of the operational user. The contractor will generally track more items than are reported to the government, as the contractor needs information at a more detailed level than does the government program office.
TPM reporting to the government is a contractual issue, and those TPMs on which the government receives reports are defined as contract deliverables in the contract data requirements list. Which parameters are selected for reporting depends on a number of issues, among which are resources to purchase TPMs, the availability of people to review and follow the items, the complexity of the system involved, the phase of development, and the contractor’s past experience with similar systems.
A typical TPM graphic will take a form somewhat like that previously shown. The actual form of the projected performance profile and whether or not tolerance bands are employed will be a function of the parameter selected and the needs of the program office.
Another important consideration is the relationship between the TPM program and risk management. Generally, the parameters selected for tracking should be related to the risk areas on the program. If a particular element of the design has been identified as a risk area, then parameters should be selected which will enable the manager to track progress in that area. For example, if achieving a required aircraft range is considered to be critical and a risk area, then tracking parameters that provide insight into range would be selected, such as aircraft weight, specific fuel consumption, drag, etc. Furthermore, there should be consistency between TPMs and the Critical Technical Parameters
associated with formal testing, although the TPM program will not normally be limited just to those parameters identified as critical for test purposes.
Government review and follow up of TPMs are appropriate on a periodic basis when submitted by the contractor, and at other major technical events such as at technical reviews, test events, and program management reviews.
While TPMs are expected to be traceable to the needs of the user, they must be concrete technical parameters that can be projected and tracked. For example, an operational user may have a requirement for survivability under combat conditions. Survivability is not, in and of itself, a measurable parameter, but there are important technical parameters that determine survivability, such as radar cross section (RCS) and speed. Therefore, the technical manager might select and track RCS and speed as elements for TPM reporting. The decision on selection of parameters for TPM tracking must also take into consideration the extent to which the parameter behavior can be projected (profiled over a time period) and whether or not it can actually be measured. If the parameter cannot be profiled, measured, or is not critical to program success, then the government, in general, should not select it for TPM tracking. The WBS structure makes an excellent starting point for consideration of parameters for TPM tracking (see Figure 14-3).
A substantial effort has taken place in recent years to link TPMs with Earned Value Management in a way that would result in earned value calculations that reflect the risks associated with achieving technical performance. The approach used establishes statistical probability of achieving a projected level of performance on the TPM profile based on a statistical analysis of actual versus planned performance. Further information is available on the Internet at http://www.acq.osd.mil/api/tpm/.
In summary, TPMs are an important tool in the program manager’s systems analysis and control toolkit. They provide an early warning about deviations in key technical parameters, which, if not controlled, can impact system success in meeting user needs. TPMs should be an integral part of both
131

Systems Engineering Fundamentals Chapter 14
|
|
|
|
|
Fire |
|
|
|
|
|
|
|||
SUBSYSTEM |
Control |
|
|
|
|
|
|
|||||||
|
|
|
|
System |
|
|
|
|
|
|
||||
|
|
|
|
|
|
|
|
|
|
|
||||
|
|
|
|
WBS XXXX |
|
|
|
|
|
|
||||
|
|
|
|
|
|
|
|
|
|
|
|
|
|
|
|
|
|
|
|
|
Power Density |
Detection Range |
|||||||
|
|
|
|
|
|
Slew Time |
|
|
TI Ant Side Lobes |
|||||
|
|
|
|
|
|
CWI Ant Side Lobes |
TI Track Accuracy |
|||||||
|
|
|
|
|
|
AM noise |
|
|
FM Noise |
|||||
|
|
|
|
|
|
Pointing Accuracy |
Weight |
|||||||
|
|
|
|
|
|
Power |
|
|
MTBF |
|||||
|
|
|
|
|
|
MTTR |
|
|
Range Resolution |
|||||
Component |
|
|
Angular Resolution |
|
|
|
||||||||
|
|
|
|
|
|
|
|
|
|
|
||||
|
|
|
|
|
|
|
|
|
|
|
|
|
|
|
|
|
|
|
|
|
|
|
|
|
|
|
|
|
|
CW |
|
|
Data |
|
|
Antenna |
|
|
|
|||||
Transmitter |
|
|
Processor |
|
|
|
|
|
|
|
||||
WBS XXXX |
|
|
WBS XXXX |
|
|
WBS XXXX |
|
|
|
|||||
|
|
|
|
|
|
|
|
|
|
|
|
|
|
|
AM Noise |
MTBF |
Slew Time |
|
|
|
|||||||||
FM Noise |
Memory |
Beam Width |
|
|
|
|||||||||
Radiated Power |
Proc Speed |
Side Lobes |
|
|
|
|||||||||
MTBF |
MTTR |
MTTR |
|
|
|
|||||||||
Figure 14-3. Shipboard Fire Control System (Partial)
periodic program reporting and management fol- low-up, as well as elements for discussion in technical reviews and program management reviews. By thoughtful use of a good program of TPM, the
manager, whether technically grounded or not, can make perceptive judgments about system technical performance and can follow up on contractor plans and progress when deviations occur.
Relevant Terms
Achievement to date – Measured or estimated progress plotted and compared with planned progress by designated milestone date.
Current estimate – Expected value of a technical parameter at contract completion.
Planned value – Predicted value of parameter at a given point in time.
Planned profile – Time phased projected planned values.
Tolerance band – Management alert limits representing projected level of estimating error.
Threshold – Limiting acceptable value, usually contractual.
Variance – Difference between the planned value and the achievement-to-date derived from analysis, test, or demonstration.
132
Chapter 15 |
Risk Management |
CHAPTER 15
RISK MANAGEMENT
15.1 RISK AS REALITY
Risk is inherent in all activities. It is a normal condition of existence. Risk is the potential for a negative future reality that may or may not happen. Risk is defined by two characteristics of a possible negative future event: probability of occurrence (whether something will happen), and consequences of occurrence (how catastrophic if it happens). If the probability of occurrence is not known then one has uncertainty, and the risk is undefined.
Risk is not a problem. It is an understanding of the level of threat due to potential problems. A problem is a consequence that has already occurred.
In fact, knowledge of a risk is an opportunity to avoid a problem. Risk occurs whether there is an attempt to manage it or not. Risk exists whether you acknowledge it, whether you believe it,
whether if it is written down, or whether you understand it. Risk does not change because you hope it will, you ignore it, or your boss’s expectations do not reflect it. Nor will it change just because it is contrary to policy, procedure, or regulation. Risk is neither good nor bad. It is just how things are. Progress and opportunity are companions of risk. In order to make progress, risks must be understood, managed, and reduced to acceptable levels.
Types of Risk in a
Systems Engineering Environment
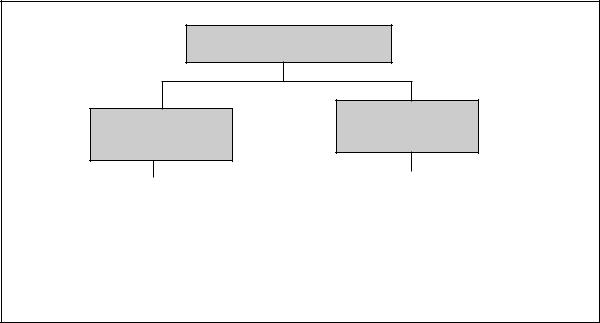
Systems engineering management related risks could be related to the system products or to the process of developing the system. Figure 15-1 shows the decomposition of system development risks.
Development Risk
Management of
Development
Management of
Development
|
|
|
|
|
|
|
|
|
|
|
|
|
|
|
|
|
|
|
|
|
|
Internal |
|
|
Prime |
|
|
|
||||
Process |
|
|
Mission |
|
|
|
||||
|
|
|
|
|
|
Product |
|
|
|
|
|
|
|
|
|
|
|
|
|
||
|
|
|
External |
|
|
|
|
Supporting |
||
|
|
|||||||||
|
|
|
Influences |
|
|
|
|
Products |
||
|
|
|
|
|
|
|
|
|
|
|
Figure 15-1. Risk Hierarchy
133
Systems Engineering Fundamentals |
Chapter 15 |
Risks related to the system development generally are traceable to achieving life cycle customer requirements. Product risks include both end product risks that relate to the basic performance and cost of the system, and to enabling products that relate to the products that produce, maintain, support, test, train, and dispose of the system.
Risks relating to the management of the development effort can be technical management risk or risk caused by external influences. Risks dealing with the internal technical management include those associated with schedules, resources, work flow, on time deliverables, availability of appropriate personnel, potential bottlenecks, critical path operations and the like. Risks dealing with external influences include resource availability, higher authority delegation, level of program visibility, regulatory requirements, and the like.
15.2 RISK MANAGEMENT
Risk management is an organized method for identifying and measuring risk and for selecting, developing, and implementing options for the
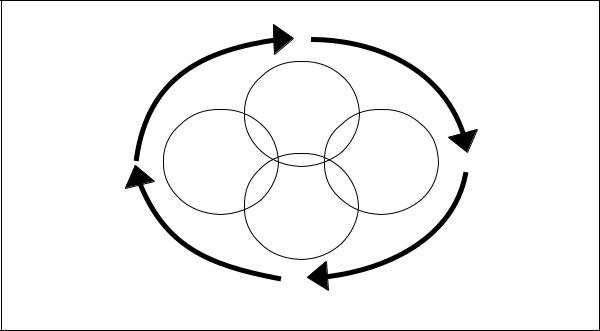
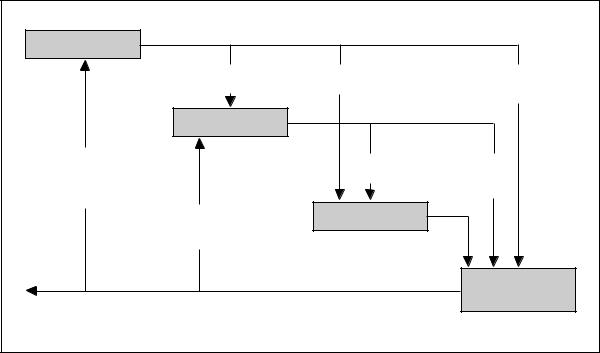
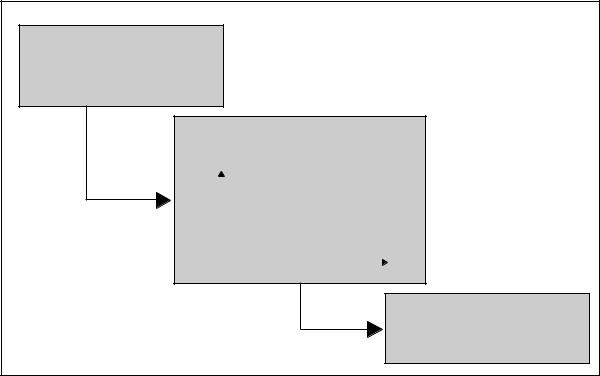
handling of risk. It is a process, not a series of events. Risk management depends on risk management planning, early identification and analysis of risks, continuous risk tracking and reassessment, early implementation of corrective actions, communication, documentation, and coordination. Though there are many ways to structure risk management, this book will structure it as having four parts: Planning, Assessment, Handling, and Monitoring. As depicted in Figure 15-2 all of the parts are interlocked to demonstrate that after initial planning the parts begin to be dependent on each other. Illustrating this, Figure 15-3 shows the key control and feedback relationships in the process.
Risk Planning
Risk Planning is the continuing process of developing an organized, comprehensive approach to risk management. The initial planning includes establishing a strategy; establishing goals and objectives; planning assessment, handling, and monitoring activities; identifying resources, tasks, and responsibilities; organizing and training risk management IPT members; establishing a method to track risk items; and establishing a method to
|
Plan |
|
(What, when, |
|
how) |
Monitor |
Assess |
and Report |
(Identify and |
(Know what’s |
analyze) |
happening) |
|
|
Handle |
|
(Mitigate the |
|
risk) |
A Continuous Interlocked Process—Not an Event
Figure 15-2. Four Elements of Risk Management
134
Chapter 15 |
Risk Management |
Planning |
|
|
|
How to |
How to |
How to |
|
Assess |
Handle |
Monitor/ |
|
|
|
Report |
|
Assessment |
|
|
|
Continuous |
What to |
What to |
|
Feedback for |
|||
Handle |
Monitor/ |
||
Planning |
|||
|
Report |
||
Adjustment |
|
||
|
|
||
Continuous |
Handling |
|
|
Feedback for |
|
|
|
Reassessment |
|
Risk |
|
|
|
||
|
|
Change |
|
|
|
Monitoring/ |
|
Continuous |
|
Reporting |
|
Feedback for |
|
|
|
Management |
|
|
Figure 15-3. Risk Management Control and Feedback
document and disseminate information on a continuous basis.
In a systems engineering environment risk planning should be:
•Inherent (imbedded) in systems engineering planning and other related planning, such as producibility, supportability, and configuration management;
•A documented, continuous effort;
•Integrated among all activities;
•Integrated with other planning, such as systems engineering planning, supportability analysis, production planning, configuration and data management, etc.;
•Integrated with previous and future phases; and
•Selective for each Configuration Baseline.
Risk is altered by time. As we try to control or alter risk, its probability and/or consequence will
change. Judgment of the risk impact and the method of handling the risk must be reassessed and potentially altered as events unfold. Since these events are continually changing, the planning process is a continuous one.
Risk Assessment
Risk assessment consists of identifying and analyzing the risks associated with the life cycle of the system.
Risk Identification Activities
Risk identification activities establish what risks are of concern. These activities include:
•Identifying risk/uncertainty sources and drivers,
•Transforming uncertainty into risk,
•Quantifying risk,
•Establishing probability, and
•Establishing the priority of risk items.
135
Systems Engineering Fundamentals |
Chapter 15 |
As shown by Figure 15-4 the initial identification process starts with an identification of potential risk items in each of the four risk areas. Risks related to the system performance and supporting products are generally organized by WBS and initially determined by expert assessment of teams and individuals in the development enterprise. These risks tend to be those that require follow-up quantitative assessment. Internal process and external influence risks are also determined by expert assessment within the enterprise, as well as through the use of risk area templates similar to those found in DoD 4245.7-M. The DoD 4245.7- M templates describe the risk areas associated with system acquisition management processes, and provide methods for reducing traditional risks in each area. These templates should be tailored for specific program use based on expert feedback.
After identifying the risk items, the risk level should be established. One common method is through the use of a matrix such as shown in Figure 15-5. Each item is associated with a block in the matrix to establish relative risk among them.
On such a graph risk increases on the diagonal and provides a method for assessing relative risk. Once the relative risk is known, a priority list can be established and risk analysis can begin.
Risk identification efforts can also include activities that help define the probability or consequences of a risk item, such as:
•Testing and analyzing uncertainty away,
•Testing to understand probability and consequences, and
•Activities that quantify risk where the qualitative nature of high, moderate, low estimates are insufficient for adequate understanding.
Risk Analysis Activities
Risk analysis activities continue the assessment process by refining the description of identified risk event through isolation of the cause of risk, determination of the full impact of risk, and the
Identify and List All Risks
•Product
•Supporting products
•Internal management processes
•External influences
Establish a Risk Definition Matrix and Assign Risks to a Risk Area
P |
Hi |
Establish Definitions Early in Program Life Cycle |
||||
R |
|
|
|
|
|
|
O |
|
|
Moderate |
High |
High |
|
B |
|
|
|
|
|
|
A |
|
|
|
|
|
|
|
|
|
|
|
|
|
B |
|
|
Low |
Moderate |
High |
|
I |
|
|
|
|
|
|
L |
|
|
|
|
|
|
|
|
|
|
|
|
|
I |
|
|
Low |
Low |
Moderate |
|
T |
|
|
|
|
|
|
Y |
Low |
|
|
|
Hi |
|
|
Consequence |
|
||||
|
|
|
|
|
|
|
Establish a Risk Priority List
• Prioritize risk based on matrix
• Establish critical “high risk” list
• Establish a “moderate risk” list
Figure 15-4. Initial Risk Identificaiton
136