

Accounting For Dummies, 4th edition
.pdf230 Part III: Accounting in Managing a Business
Irrelevant (or sunk) costs: Costs that should be disregarded when deciding on a future course of action; if brought into the analysis, these costs could cause you to make the wrong decision. An irrelevant cost is a vestige of the past — that money is gone. For this reason, irrelevant costs are also called sunk costs. For example, suppose that your supervisor tells you to expect a slew of new hires next week. All your staff members use computers now, but you have a bunch of typewriters gathering dust in the supply room. Should you consider the cost paid for those typewriters in your decision to buy computers for all the new hires? Absolutely not — that cost should have been written off and is no match for the cost you’d pay in productivity (and morale) for new employees who are forced to use typewriters.
Generally speaking, fixed costs are irrelevant when deciding on a future course of action, assuming that they’re truly fixed and can’t be increased or decreased over the short term. Most variable costs are relevant because they depend on which alternative is selected.
Although fixed costs themselves are usually irrelevant in decision making, these costs often indicate something about a business’s capacity — how much building space it has, how many machine-hours are available for use, how many hours of labor can be worked, and so on. Managers have to figure out the best way to utilize these capacities. For example, suppose your retail business pays an annual building rent of $200,000, which is a fixed cost (unless the rental contract with the landlord has a rent escalation clause based on sales revenue). The rent, which gives the business the legal right to occupy the building, provides 15,000 square feet of retail and storage space. You should figure out which sales mix of products will generate the highest total margin — equal to total sales revenue less total variable costs of making the sales, including the costs of the goods sold and all variable costs driven by sales revenue and sales volume.
Actual, budgeted, and standard costs
The actual costs a business incurs may differ (though we hope not significantly) from its budgeted and standard costs:
Actual costs: Historical costs, based on actual transactions and operations for the period just ended, or going back to earlier periods. Financial statement accounting is mainly (though not entirely) based on a business’s actual transactions and operations; the basic approach to determining annual profit is to record the financial effects of actual transactions and allocate historical costs to the periods benefited by the costs.
Budgeted costs: Future costs, for transactions and operations expected to take place over the coming period, based on forecasts and established goals. Fixed costs are budgeted differently than variable costs. For example, if sales volume is forecast to increase by 10 percent, variable costs will definitely increase accordingly, but fixed costs may or may not need to be
Chapter 11: Cost Concepts and Conundrums 231
increased to accommodate the volume increase. In Chapter 10, I explain the budgeting process and budgeted financial statements.
Standard costs: Costs, primarily in the area of manufacturing, that are carefully engineered based on detailed analysis of operations and forecast costs for each component or step in an operation. Developing standard costs for variable production costs is relatively straightforward because most are direct costs. In contrast, most fixed costs are indirect, and standard costs for fixed costs are necessarily based on more arbitrary methods (see “Direct versus indirect costs,” earlier in this chapter). Note: Some variable costs are indirect and have to be allocated to specific products in order to come up with a full (total) standard cost of the product.
Product versus period costs
Some costs are linked to particular products, and others are not:
Product costs: Manufacturing costs attached directly or allocated to particular products. The cost is recorded in the inventory asset account and stays in that asset account until the product is sold, at which time the cost goes into the cost of goods sold expense account. (See Chapters 4 and 5 for more about these accounts; also, see Chapter 7 for alternative methods for selecting which product costs are first charged to the cost of goods sold expense.)
For example, the cost of a new Ford Focus sitting on a car dealer’s showroom floor is a product cost. The dealer keeps the cost in the inventory asset account until you buy the car, at which point the dealer charges the cost to the cost of goods sold expense.
Period costs: Costs that are not attached to particular products. These costs do not spend time in the “waiting room” of inventory. Period costs are recorded as expenses immediately; unlike product costs, period costs don’t pass through the inventory account first. Advertising costs, for example, are accounted for as period costs and recorded immediately in an expense account. Also, research and development costs are treated as period costs (with some exceptions).
Separating product costs and period costs is particularly important for manufacturing businesses, as you find out in the following section.

232 Part III: Accounting in Managing a Business
Assembling the Product Cost
of Manufacturers
Businesses that manufacture products have several additional cost problems to deal with, compared with retailers and distributors. I use the term manufacture in the broadest sense: Automobile makers assemble cars, beer companies brew beer, automobile gasoline companies refine oil, DuPont makes products through chemical synthesis, and so on. Retailers (also called merchandisers) and distributors, on the other hand, buy products in a condition ready for resale to the end consumer. For example, Levi Strauss manufactures clothing, and Macy’s is a retailer that buys from Levi Strauss and sells the clothes to the public. The following sections describe costs unique to manufacturers.
Minding manufacturing costs
Manufacturing costs consist of four basic types:
Raw materials (also called direct materials): What a manufacturer buys from other companies to use in the production of its own products. For example, General Motors buys tires from Goodyear (or other tire manufacturers) that then become part of GM’s cars.
Direct labor: The employees who work on the production line.
Variable overhead: Indirect production costs that increase or decrease as the quantity produced increases or decreases. An example is the cost of electricity that runs the production equipment: You pay for the electricity for the whole plant, not machine by machine, so you can’t attach this cost to one particular part of the process. But if you increase or decrease the use of those machines, the electricity cost increases or decreases accordingly. (In contrast, the monthly utility bill for a company’s office and sales space probably is fixed for all practical purposes.)
Fixed overhead: Indirect production costs that do not increase or decrease as the quantity produced increases or decreases. These fixed costs remain the same over a fairly broad range of production output levels (see “Fixed versus variable costs,” earlier in this chapter). Three significant fixed manufacturing costs are
•Salaries for certain production employees who don’t work directly on the production line, such as a vice president, safety inspectors, security guards, accountants, and shipping and receiving workers.
•Depreciation of production buildings, equipment, and other manufacturing fixed assets.
•Occupancy costs, such as building insurance, property taxes, and heating and lighting charges.

Chapter 11: Cost Concepts and Conundrums 233
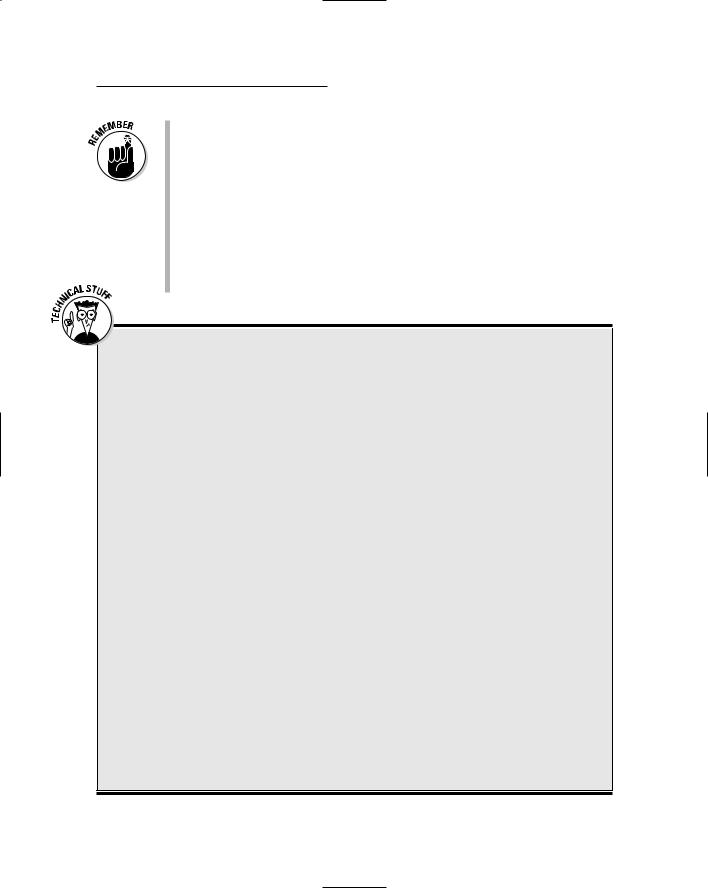
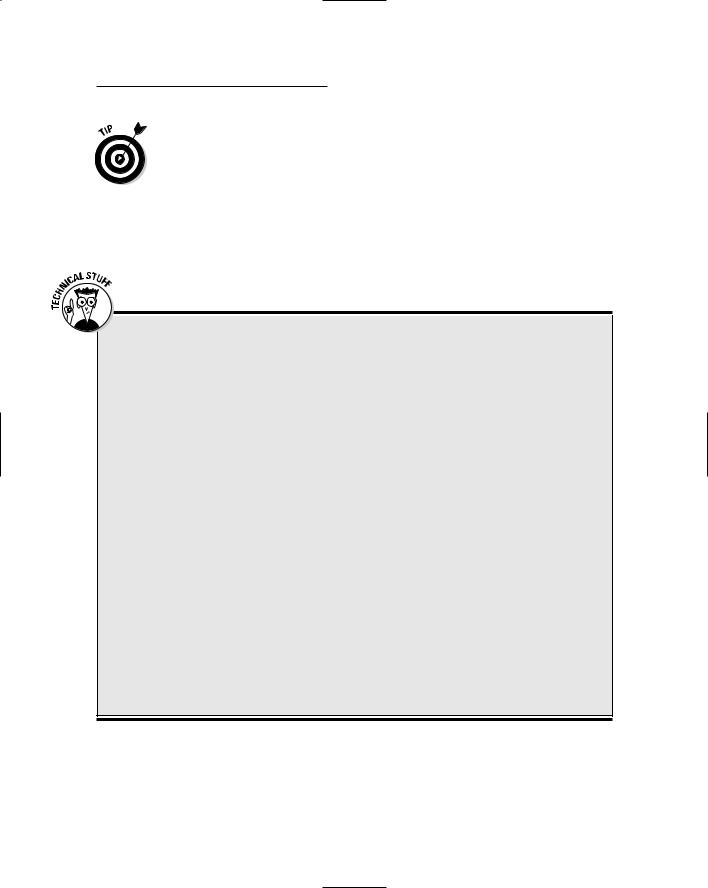
Figure 11-1 presents an annual income statement for a manufacturer and includes information about its manufacturing costs for the year. The cost of goods sold expense depends directly on the product cost from the summary of manufacturing costs that appears below the income statement. A business may manufacture 100 or 1,000 different products, or even more, and the business must prepare a summary of manufacturing costs for each product. To keep our example easy to follow (but still realistic), Figure 11-1 presents a scenario for a one-product manufacturer. The multi-product manufacturer has some additional accounting problems, but I can’t provide that level of detail here. This example illustrates the fundamental accounting problems and methods of all manufacturers.
Figure 11-1:
Example for determining the product cost of a manufacturer.
|
|
|
Income Statement for Year |
|
|
|
|
|
|
|
Sales volume |
110,000 |
units |
|
|
|
|
|
|
Per Unit |
|
Totals |
|
|
|
|
Sales revenue |
$1,400 |
$154,000,000 |
|
|
|
|
|
Cost of goods sold expense |
(760) |
|
(83,600,000) |
|
|
|
|
|
||||
|
|
|
Gross margin |
$640 |
$70,400,000 |
|
|
|
|
|
Variable operating expenses |
(300) |
|
(33,000,000) |
|
|
|
|
Margin |
$340 |
$37,400,000 |
|
|
|
|
|
Fixed operating expenses |
(195) |
|
(21,450,000) |
|
|
|
|
Earnings before interest and income tax (EBIT) |
$145 |
$15,950,000 |
|
|
|
|
|
Interest expense |
|
|
(2,750,000) |
|
|
|
|
|
|
|||
|
|
|
Earnings before income tax |
|
$13,200,000 |
|
|
|
|
|
Income tax expense |
|
|
(4,488,000) |
|
|
|
|
Net income |
|
$8,712,000 |
|
|
|
|
|
Manufacturing Costs for Year |
|
|
|
|
|
|
|
|
|
|
||
|
|
|
Production capacity |
150,000 |
units |
|
|
|
|
|
Actual output |
120,000 |
units |
|
|
|
|
|
Production Cost Components |
Per Unit |
|
Totals |
|
|
|
|
Raw materials |
$215 |
$25,800,000 |
|
|
|
|
|
Direct labor |
125 |
15,000,000 |
|
|
|
|
|
Variable manufacturing overhead costs |
70 |
|
8,400,000 |
|
|
|
|
Total variable manufacturing costs |
$410 |
$49,200,000 |
|
|
|
|
|
Fixed manufacturing overhead costs |
350 |
|
42,000,000 |
|
|
|
|
Total manufacturing costs |
$760 |
$91,200,000 |
|
|
|
|
|
To 10,000 units inventory increase |
|
|
(7,600,000) |
|
|
|
|
|
|
|||
|
|
|
To 110,000 units sold |
|
$83,600,000 |
|
|
|
|
|
|
|
|||
|
|
|
|
|
|
|
|
|
|
|
|
|
|
|
|
234 Part III: Accounting in Managing a Business
The information in the manufacturing costs summary below the income statement (see Figure 11-1) is highly confidential and for management eyes only. Competitors would love to know this information. A company may enjoy a significant cost advantage over its competitors and definitely does not want its cost data to get into their hands.
Classifying costs properly
Two vexing issues rear their ugly heads in determining product cost for a manufacturer:
Drawing a bright line between manufacturing costs and nonmanufacturing operating costs: The key difference here is that manufacturing costs are categorized as product costs, whereas non-manufacturing operating costs are categorized as period costs (refer to “Product versus period costs,” earlier in this chapter). In calculating product costs, you include only manufacturing costs and not other costs. Period costs are recorded right away as expenses — either in variable operating expenses or fixed operating expenses (see Figure 11-1). Here are some examples of each type of cost:
•Wages paid to production line workers are a clear-cut example of a manufacturing cost.
•Salaries paid to salespeople are a marketing cost and are not part of product cost; marketing costs are treated as period costs, which means they are recorded immediately to expense of the period.
•Depreciation on production equipment is a manufacturing cost, but depreciation on the warehouse in which products are stored after being manufactured is a period cost.
•Moving the raw materials and partially-completed products through the production process is a manufacturing cost, but transporting the finished products from the warehouse to customers is a period cost.
The accumulation of direct and indirect production costs starts at the beginning of the manufacturing process and stops at the end of the production line. In other words, product cost stops at the end of the production line — every cost up to that point should be included as a manufacturing cost.
If you misclassify some manufacturing costs as operating costs, your product cost calculation will be too low (see the following section, “Calculating product cost”). Also, the Internal Revenue Service may come knocking at your door if it suspects that you deliberately (or even innocently) misclassified manufacturing costs as non-manufacturing costs in order to minimize your taxable income.
Chapter 11: Cost Concepts and Conundrums 235
Allocating indirect costs among different products: Indirect manufacturing costs must be allocated among the products produced during the period. The full product cost includes both direct and indirect manufacturing costs. Creating a completely satisfactory allocation method is difficult; the process ends up being somewhat arbitrary, but it must be done to determine product cost. Managers should understand how indirect manufacturing costs are allocated among products (and, for that matter, how indirect non-manufacturing costs are allocated among organizational units and profit centers). Managers should also keep in mind that every allocation method is arbitrary and that a different allocation method may be just as convincing. (See the sidebar “Allocating indirect costs is as simple as ABC — not!”)
Allocating indirect costs is as simple as ABC — not!
Accountants for manufacturers have developed many methods and schemes for allocating indirect overhead costs, most of which are based on a common denominator of production activity, such as direct labor hours or machine hours. A different method has received a lot of press recently: activity-based costing (ABC).
With the ABC method, you identify each supporting activity in the production process and collect costs into a separate pool for each identified activity. Then you develop a measure for each activity — for example, the measure for the engineering department may be hours, and the measure for the maintenance department may be square feet. You use the activity measures as cost drivers to allocate costs to products.
The idea is that the engineering department doesn’t come cheap; including the cost of their slide rules and pocket protectors, as well as their salaries and benefits, the total cost per hour for those engineers could be $200 or more. The logic of the ABC cost-allocation method is that the engineering cost per hour should be allocated on the basis of the number of hours (the driver) required by each product. So if Product A needs
200 hours of the engineering department’s time and Product B is a simple product that needs only 20 hours of engineering, you allocate ten times as much of the engineering cost to Product A. In similar fashion, suppose the cost of the maintenance department is $20 per square foot per year. If Product C uses twice as much floor space as Product D, it would be charged with twice as much maintenance cost.
The ABC method has received much praise for being better than traditional allocation methods, especially for management decision making. But keep in mind that this method still requires rather arbitrary definitions of cost drivers, and having too many different cost drivers, each with its own pool of costs, is not too practical.
Cost allocation always involves arbitrary methods. Managers should be aware of which methods are being used and should challenge a method if they think that it’s misleading and should be replaced with a better (though still somewhat arbitrary) method. I don’t mean to put too fine a point on this, but cost allocation essentially boils down to a “my arbitrary method is better than your arbitrary method” argument.
236 Part III: Accounting in Managing a Business
Calculating product cost
The basic equation for calculating product cost is as follows (using the example of the manufacturer given in Figure 11-1):
$91,200,000 total manufacturing costs ÷ 120,000 units production output = $760 product cost per unit
Looks pretty straightforward, doesn’t it? Well, the equation itself may be simple, but the accuracy of the results depends directly on the accuracy of your manufacturing cost numbers. The business example we’re using in this chapter manufactures just one product. Even so, a single manufacturing process can be fairly complex, with hundreds or thousands of steps and operations. In the real world, where businesses produce multiple products, your accounting systems must be very complex and extraordinarily detailed to keep accurate track of all direct and indirect (allocated) manufacturing costs.
In our example, the business manufactured 120,000 units and sold 110,000 units during the year, and its product cost per unit is $760. The 110,000 total units sold during the year is multiplied by the $760 product cost to compute the $83.6 million cost of goods sold expense, which is deducted against the company’s revenue from selling 110,000 units during the year. The company’s total manufacturing costs for the year were $91.2 million, which is $7.6 million more than the cost of goods sold expense. The remainder of the total annual manufacturing costs is recorded as an increase in the company’s inventory asset account, to recognize that 10,000 units manufactured this year are awaiting sale in the future. In Figure 11-1, note that the $760 product cost per unit is applied both to the 110,000 units sold and to the 10,000 units added to inventory.
Note: The product cost per unit for our example business is determined for the entire year. In actual practice, manufacturers calculate their product costs monthly or quarterly. The computation process is the same, but the frequency of doing the computation varies from business to business. Product costs likely will vary each successive period the costs are determined. Because the product costs vary from period to period, the business must choose which cost of goods sold and inventory cost method to use. (If product cost happened to remain absolutely flat and constant period to period, the different methods would yield the same results.) Chapter 7 explains the alternative accounting methods for determining cost of goods sold expense and inventory cost value.
Chapter 11: Cost Concepts and Conundrums 237
Examining fixed manufacturing costs and production capacity
Product cost consists of two very distinct components: variable manufacturing costs and fixed manufacturing costs. In Figure 11-1, note that the company’s variable manufacturing costs are $410 per unit, and its fixed manufacturing costs are $350 per unit. Now, what if the business had manufactured ten more units? Its total variable manufacturing costs would have been $4,100 higher. The actual number of units produced drives variable costs, so even one more unit would have caused the variable costs to increase. But the company’s total fixed costs would have been the same if it had produced ten more units, or 10,000 more units for that matter. Variable manufacturing costs are bought on a per-unit basis, as it were, whereas fixed manufacturing costs are bought in bulk for the whole period.
Fixed manufacturing costs are needed to provide production capacity — the people and physical resources needed to manufacture products — for the period. After the business has the production plant and people in place for the year, its fixed manufacturing costs cannot be easily scaled down. The business is stuck with these costs over the short run. It has to make the best use it can from its production capacity.
Production capacity is a critical concept for business managers to stay focused on. You need to plan your production capacity well ahead of time because you need plenty of lead-time to assemble the right people, equipment, land, and buildings. When you have the necessary production capacity in place, you want to make sure that you’re making optimal use of that capacity. The fixed costs of production capacity remain the same even as production output increases or decreases, so you may as well make optimal use of the capacity provided by those fixed costs. For example, you’re recording the same depreciation amount on your machinery regardless of how you actually use those machines, so you should be sure to optimize the use of those machines (within limits, of course — overworking the machines to the point where they break down won’t do you much good).
The burden rate
The fixed cost component of product cost is called the burden rate. In our manufacturing example, the burden rate is computed as follows (see Figure 11-1 for data):
$42,000,000 fixed manufacturing costs for period ÷ 120,000 units production output for period = $350 burden rate
Note that the burden rate depends on the number divided into total fixed manufacturing costs for the period — that is, the production output for the period.

238 Part III: Accounting in Managing a Business
Now, here’s a very important twist on my example: Suppose the company had manufactured only 110,000 units during the period — equal exactly to the quantity sold during the year. Its variable manufacturing cost per unit would have been the same, or $410 per unit. But its burden rate would have been $381.82 per unit (computed by dividing the $42 million total fixed manufacturing costs by the 110,000 units production output). Each unit sold, therefore, would have cost $31.82 more simply because the company produced fewer units. (The burden rate is $381.82 at the 110,000 output level but only $350 at the 120,000 output level.)
If only 110,000 units were produced, the company’s product cost would have been $791.82 ($410 variable costs plus the $381.82 burden rate). The company’s cost of goods sold, therefore, would have been $3.5 million higher for the year ($31.82 higher product cost × 110,000 units sold). This rather significant increase in its cost of goods sold expense is caused by the company producing fewer units, even though it produced all the units that it needed for sales during the year. The same total amount of fixed manufacturing costs is spread over fewer units of production output.
Idle capacity
The production capacity of the business example in Figure 11-1 is 150,000 units for the year. However, this business produced only 120,000 units during the year, which is 30,000 units fewer than it could have. In other words, it operated at 80 percent of production capacity, which is 20 percent idle capacity:
120,000 units output ÷ 150,000 units capacity =
80% utilization, or 20% idle capacity
This rate of idle capacity isn’t unusual — the average U.S. manufacturing plant normally operates at 80 to 85 percent of its production capacity.
The effects of increasing inventory
Looking back at the numbers shown in Figure 11-1, the company’s cost of goods sold benefited from the fact that it produced 10,000 more units than it sold during the year. These 10,000 units absorbed $3.5 million of its total fixed manufacturing costs for the year, and until the units are sold this $3.5 million stays in the inventory asset account (along with the variable manufacturing costs, of course). It’s entirely possible that the higher production level was justified — to have more units on hand for sales growth next year. But production output can get out of hand, as I discuss in the following section, “Puffing Profit by Excessive Production.”
Chapter 11: Cost Concepts and Conundrums 239
Managers (and investors as well) should understand the inventory increase effects caused by manufacturing more units than are sold during the year. In the example shown in Figure 11-1, the cost of goods sold expense escaped $3.5 million of fixed manufacturing costs because the company produced 10,000 more units than it sold during the year, thus pushing down the burden rate. The company’s cost of goods sold expense would have been $3.5 million higher if it had produced just the number of units it sold during the year. The lower output level would have increased cost of goods sold expense and would have caused a $3.5 million drop in gross margin and earnings before income tax. Indeed, earnings before income tax would have been 27 percent lower ($3.5 million ÷ $13.2 million = 27 percent decrease).
The actual costs/actual output method and when not to use it
The product cost calculation for the business example shown in Figure 11-1 is based on the actual cost/actual output method, in which you take your actual costs — which may have been higher or lower than the budgeted costs for the year — and divide by the actual output for the year.
The actual costs/actual output method is appropriate in most situations. However, this method is not appropriate and would have to be modified in two extreme situations:
Manufacturing costs are grossly excessive or wasteful due to inefficient production operations: For example, suppose that the business represented in Figure 11-1 had to throw away $1.2 million of raw materials during the year. The $1.2 million should be removed from the calculation of the raw material cost per unit. Instead, you treat it as a period cost — meaning that you take it directly into expense. Then the cost of goods
sold expense would be based on $750 per unit instead of $760, which lowers this expense by $1.1 million (based on the 110,000 units sold). But you still have to record the $1.2 million expense for wasted raw materials, so EBIT would be $100,000 lower.
Production output is significantly less than normal capacity utilization: Suppose that the Figure 11-1 business produced only 75,000 units during the year but still sold 110,000 units because it was working off a large inventory carryover from the year before. Then its production output would be 50 percent instead of 80 percent of capacity. In a sense, the business wasted half of its production capacity, and you can argue that half of its fixed manufacturing costs should be charged directly to expense on the income statement and not included in the calculation of product cost.