

FanfareforEffectiveFreedom[1]
.pdfNow of course if that kind of presentation can be made for the flow of production it can be made for any other kind of dynamic system in which management may be interested: cash flow, for example, or the deployment and movement of people and of goods. And although we started out on this task under the aegis of Operational Research, I am hopeful that as people become accustomed to the idea we can use a better approach. Do we really need objective scientific enquiry to understand what the structure of the system is and how it should best be quantified? Actually not. The people who best understand what these systems are really like are the people who operate them. You do not need a string of degrees to understand how to make a quantified flow chart of the activity that surrounds your daily life. So here I hope will be the start of ‘participation’in the future: and OR expertise will be used merely in teaching and in guidance.
With this simple device we start on the road leading to the answer to those objections about overload. In cybernetics we have an actual measure of complexity which we call variety. By devising systems in which homeostats are set up between management and whatever is managed, we embark on the process that I have labelled ‘variety engineering’.
The quantified flock, chart is in itself a variety attenuating filter. In the first place, it can select its own degree of optical resolution. For example, it can show a box called simply steel production: or it can show three boxes identifying kinds of steel production - by open-hearth, electric arc, and converter. say: or it can show every individual furnace. By the same token, it can lump together all the materials that go into a steel-making furnace charge, or it can distinguish between them. This variety engineering concerns the account of the operation that has meaning for a particular management group, and the degree of optical resolution chosen depends on the level of recursion at which this operation is being considered. In the second place, iconic representation is also a variety attenuator in the suppression of words and numerical data: it is a product of Gestalt psychology, in which pattern is relied upon to convey information.
The next variety attenuator involved in this representation is the concept of capability. The real-time variation in actual flows and outputs is killed in the iconic quantified flow chart, and referred instead to a relatively static idea of 'what can be done'. You might think that this would be difficult to define, but in practice it is fairly easy. Capability is a systems concept: what outputs is the total system capable of generating in each part, given the limitations imposed on any part of the system by other parts? Then ‘capability’ is not to be confused with ‘capacity’ which is not a systems concept - because it alleges that some part of the system can in theory do something that may be rendered impossible by other parts. This variety attenuator is valuable because it reflects reality for the whole system concerned, and that has meaning for the recipient of the iconic representation.
However, we could - given a breakthrough of some kind - do better than the results of which we are currently capable. After all: if capacity exceeds capability in some parts of the system, there must be other parts of the system (called bottlenecks) that are actively restricting capability. These bottlenecks may have to do with low local capacities, or they may have to do with technological constraints. For example: a mill’s engine might be perfectly adequate to drive its rolls at twice their current speed - if only we had a better lubricant. Then these considerations define potentiality, which is something better than capability. Potentiality is the performance of which the system would be capable, “if only. . . . .” That does not mean that we look for pie in the sky: it means that we look for investment - in new equipment to cure the bottlenecks, or in research to cure technological shortcomings. It is not very difficult keeping one’s feet firmly on the ground, to define a system’s potentiality.
But if potentiality is better than capability, there is something worse - and that is actuality. The performance of systems cannot rise to their potentiality without investment of some kind, it cannot even rise to their capability unless activity is perfectly well organised. It never is. In consequence, what actually happens falls short of the capability expressed before. Moreover, actuality expresses that very reality of which I spoke earlier - the day-to-day vicissitudes of life. It was this continuous variation which drove our thinking down the road to real-time control. Somehow we have ended up with three versions of systemic truth: actuality, continuously fluctuating; capability, a much steadier variable; potentiality which is absolute until the system itself is structurally changed. And it is capability which the iconic representations represent. To make them show potentiality would for the moment, be unrealistic, to make them show actuality would, at all times, result in their dancing in perpetual fandango before our eyes. So this capability attenuator is a powerful but sensible reducer of operational variety.
11
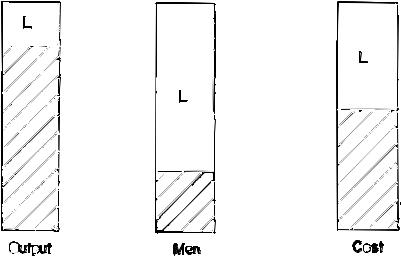
So be it, in so far as iconic flow charts are concerned. But what about continuous reporting and the problems of real-time control? Whatever information we collect, it is due to be hurled round dozens of homeostatic loops – those loops that make up the total systems design. That information has very high variety: and the analysis we have just made multiplies it by a factor of three -or so it seems, if we want a measure not only of actuality, but of capability and potentiality as well ..... But rescue is in sight. Both capability and potentiality are relatively static measures. If we take their ratio the resulting index will also be relatively static. Moreover, such a ratio will be a massive variety attenuator - because it ill be a pure number, varying between nought and one. So instead of trying to consider all-in-one-breath that we have a capability of 800,000 tons and a potentiality of 1,000,000 tons, we shall think of a ratio of 0.8. While the capability to use 110 men contrasted with a potentiality to use only 22 yields a ratio of 0.2, and the capability cost of an item of product at 120 escudos compared with a potential cost of 60 escudos indicates a ratio of 0.5. Well what is potential in current capability is a latent resource: and it could be freed by investment in some form. So I call the ratio between capability and potentiality the Latency Index. Looking at a new iconic diagram (Figure 4) we can see how potent a variety attenuator has been devised.
Figure 4. Iconic representation of relative Latencies (see text)
There is no need any longer to try and assimilate the numbers that characterise the units measured. That is the strength of an index -it is a pure number, varying over a fixed range. Hundreds of thousands of tons: hundreds and tens of men, units of money, there is no need to wrestle with them. Nor, if we stick to our ideas about iconic diagrams is there any real need to use digits at all. We can distinguish very clearly, using our eyes, between the levels represented in the iconic diagram. It might satisfy an accountant, but it would make no difference to a manager, to declare that a Latency Index had changed from 0.71 to 0.73. Who cares? The computers behind the manager’s eyes will undertake whatever process of discrimination has meaning for his Judgmental brain. Then this was the first though massive piece of variety engineering we set out to achieve in Chile, on those initial (crude, but effective) models contrived at an appropriate level of optical resolution of all the firms. As I said, the Latency Index is all about investment, and we shall certainly return to it later.
Meanwhile we must consider actuality, the real-time variable in the entire system. For if a Latency difference between 0.71 and 0.73 means nothing because both potentiality and capability are fairly static, such a difference in a fast-moving index could mean something very important. It might be part of a trend. I have already explained the arrangements by which the data representing actuality come into Santiago every day. They are used to form a second ratio, comparing actuality (the newly arrived figure) with capability (selected from the computer store). This is the Productivity Index. It is in a continual state of oscillation, which destroys the variety that is of no concern. In the next diagram (Figure 5), we can see how the three concepts of actuality, capability and potentiality are combined as two ratios to form the Latency and Productivity Indices, and how these in turn create an overall Performance Index. The reason for this iconic representation, in place of the familiar mathematical
12
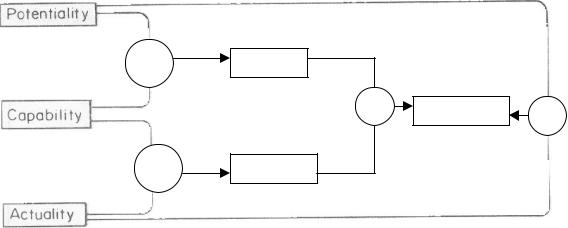
notation. lies in the fact that which part of the ratio is the numerator and which the denominator depends on what is being measured. For instance, capability is always better than actuality, but in numerical terms it may be more (e.g. output) or less (e.g. man-hours per unit). Naturally enough, the smaller number in the ratio is the numerator, since the index will be less than 1.0.
Latency
Performance
Productivity
Figure 5. Three measures of capacity defining three indices of achievement and three concepts of Planning.
The indices procure an enormous variety reduction: even so, we still have problems in conforming to Ashby’s Law of Requisity Variety when it comes to managing the economy. The company production models for instance generate on average about ten triple-indices per plant: these always include raw material and finished stocks, the output of key production processes, and labour absenteeism. This degree of resolution is minimal, and managements have free rein to install whatever extra indicators they like. This honours the argument for autonomy, and it makes an insignificant difference to the workload of the computers because all the numbers inside the computational system are diurnal time series of indices varying between nought and one. The programmes are therefore infinitely extensible in application. Even so, with the system in full operation, many thousands of actuality inputs will arrive daily, generating three times as many indices; and the total number could easily rise by two orders of magnitude as the autonomy criterion is understood by managements, the operational research goes deeper, and worker participation becomes real. And so we reach the more subtle notions of variety engineering.
If a particular indicator. say the rate of crushing limestone in a cement factory in Northern Chile. is generating a new Productivity Index every day. what ought to be done with it'? Should we lay the new figure, each day, on the desk of the Minister of Economics? Surely not, this variety must also be filtered. There are two statistical notions involved, and the first is very simple. A population of (say) a hundred such figures generates a probability distribution. This may turn out to be oddly-shaped. rather than straightforwardly Gaussian. and especially it may be skewed to the right (since the index has a finite limit of one). It is a simple matter, however. to correct for this statistical aberration, by using a trigonometrical transformation. Then we may establish the mean and variance of this population of indices. These two statistics, all alone, characterise the stochastic behaviour of each index over time. Then if we take a running sample of the indexical figures as they are computed. it is easy to establish whether a significant change in the mean or variance of the statistical population has occurred. The statistical population characterising each indicator is known as the taxonomic index, because it classifies every measured activity within every operation according to its mean productivity. There is a standard computer programme that looks for changes in the taxonomic index; if such a change is found, that is notified to the management concerned. and the iconic graph is changed. Further, the history of the index over time is updated (Figure 6). These are relatively rare events. but the procedure mentioned absorbs the variety engendered perfectly well.
13
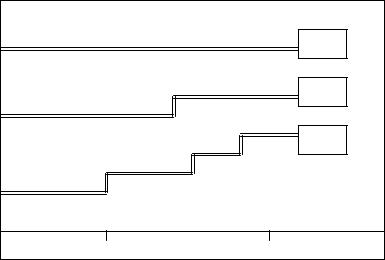
Pot
Cap
Act
1972 |
1973 |
Figure 6. Iconic record of significant (therefore taxonomic) change.
BREAKING THE TIME BARRIER: CYBERSTRIDE
The more difficult problem and the more sophisticated statistical notion concerns the possible trend that each new daily figure may betray. If the economy is to be under real time control, the government cannot wait to know that a significant change has been registered for a particular taxonomic index. Although this is already much to be preferred to the orthodox system of routinely quantizing statistics where the recognition of significant change is left first to the alertness and next to the judgement of whoever is supposed to be watching the results. No, it is much more than this: we approach the problem of breaking the time barrier. Can we tell from yesterday’s figure and the short-term run in which it participates, what will happen (unless we intervene) tomorrow and next week? It is the problem of short-term forecasting with which a great deal of progress has been made in recent years.
Allow me once more to return to the facts of the Chilean work. Before the end of 1971 I had designed a specification for the computer programme to deal with taxonomic indices having daily actuality inputs, and it was in the hands of a team of operational research consultants in London, who had been commissioned to write the programs. We were discussing she short-term forecasting problem, when the London team discovered a brand new paper in the Operational Research Quarterly, - hot off the press. The authors were Harrison and Stevens and they had clearly made a major advance in the field of short-term forecasting (4). We had been talking in terms of Cusum (cumulative sum) techniques to this pointas representing the best available practice. Cusum itself was associated with the first author. who had been pressing its virtues for many years, so we were naturally impressed that this novel development came from him. The obvious power of the method (always supposing it worked), and the elegance of the mathematical demonstration behind the approach convinced us to take the plunge. It was a noteworthy decision. The London team wrote a temporary suite of programs, which included the Harrison-Stevens approach and incredibly had it working in Santiago by the March 1972 deadline of the first phase of the operation mentioned already. Meanwhile they began work on the permanent version, creating a specification that was handed over to the Chilean scientists. In the meantime, as the system was growing, experience was gained in the actual use of these complicated program suites. and they grew in sophistication all the time. But these developments, vitally important though they are, must await presentation by the men made them possible in more technical papers than this.
This suite of computer programs, called CYBERSTRIDE, is the essential feature of the filtration system that achieves the variety attenuation demanded, and which breaks the time barrier of' which I was speaking. It takes as input the actuality figures every day: makes various checks on their integrity: it computes the triple-indices: it makes statistical judgements about the taxonomic indices as I have already described. After that, using Harrison-Stevens techniques, it really gets clever.
14
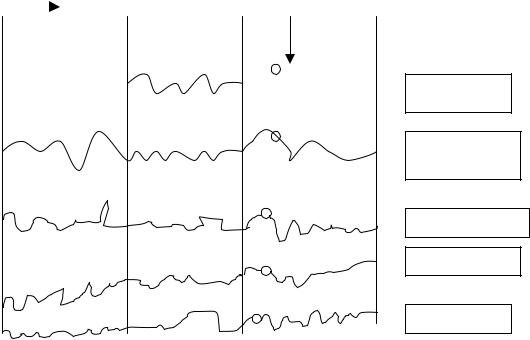
When a new value for any index is computed, Cyberstride looks at it in the context of the recent history of that index (Figure 7). The new point might stand for any one of the four outcomes depicted. It stands for no change or for a transient (neither of which maters to the manager), or it stands for a change of slope, or for a step function, (both of which possibilities matter very much). Using Bayesian statistical theory, the program calculates the posterior probability of' each of these four events - for every index, every day. The programme is incredibly sensitive to these changes recognising them long before the human brain would dare to make a judgement. Cybernetically speaking, the system (as Harrison and Stevens claimed) is self-adaptive: its sensitivity increases whenever uncertainty increases - which happens whenever an apparently unusual index value is thrown up. Moreover, instead of producing merely single-figure forecasts (and who can foretell the future with that kind of precision?) it produces a joint parameter distribution that expresses the inherent uncertainty of all forecasting.
Time |
Now |
|
|
|
|
What does this mean ?
Nothing: random variation
Nothing: transient
Change SLOPE
Change STEP
Figure 7. Using the computer intelligently to calculate probabilities of future alternatives
So this is what I meant in speaking of computers as quasi-intelligent machines. Cyberstride throws away the huge component of variety that has no meaning because it represents a chance fluctuation. It is at once alert to significant changes focussing on them an analytical eye, and capable of estimating on the strength of that analysis what will happen next. The only problem we had with Cyberstride, and it was very severe, was its calibration in terms of these posterior probabilities: how sensitive should it be made? Obviously, it could discard too much or become overexcited about too little. The ‘tuning’ subroutine that fixes these limits of excitation, so analogous to the so-called physiological limits of variation in any homeostat, was the big achievement of the Chilean scientists working on Cyberstride.
The variety engineering is complete-for the lowest level of recursion, the enterprise itself. If it would have been ludicrous to confront the Minister of Economics with the whole variety of fluctuating indices. it would still be absurd to inform him of even highly significant movements in the limestonecrushing activity of a cement plant in Northern Chile. Absurd yes, but also ominous I am sure you recall the argument about autonomy and over-centralisation. What happens in Chile is this. The results of applying Cyberstride daily to the new inputs which quantify the iconic flowcharts, are fed straight back to the managements concerned. It is their responsibility to do something about the warnings that are generated in this way by quasi-intelligent machines. No other human being than the responsible manager receives any information about this extremely elaborate piece of computation and I attach very weighty importance to this fact.
15

Then, you will ask, what about the other levels of recursion? The manager of the enterprise is very well served by all of this especially so since he can pump any indexical series he cares to contemplate into the routine - and receive the alerting advice whenever it is available. Meanwhile he may feel perfectly confident that an absence of alerting advice means that whatever operations or activities are being monitored for him by Cyberstride are fluctuating within the physiological range of chance variation. But what about the Sector Committee, the Industrial Branch, the Minister of Economics himself? These are higher levels of recursion: how are they to be informed?
Here is the coup de grace of the cybernetician, in his role as variety engineer. All viable systems are contained within viable systems. It is the principle of recursion; the model is the same. So it is easy to see what next to do. The iconic representations called quantified flow-charts are to be aggregated at sector level aggregated again at the industrial branch level, and aggregated finally at the level of total Industry. The quantifiers (those actualities, capabilities, and potentialities) are to be aggregated too-not. as is orthodox practice, in terms of averages, but in terms of new operational research models (crude, but effective) of the level of recursion concerned. In that case, raw data-heavily processed through atomic indices and through Cyberstride which produces exceptions known only to the manager concerned-bypass that atomic level of recursion, and become raw material for a molecular level of aggregation higher up. Here they lose their identity, they merge (not by averaging but by modelling) into new molecular indices.
But the new indices, although they have lost a great deal of variety in the process of molecular aggregation, have acquired variety by the sheer amalgamation of so many enterprises. How shall we deal requisitely with this new variety? Well, it is represented by triple-indices, all operating between nought and one. So although the level of recursion changes and although the atomic index changes to a molecular index, the Cyberstride suite of programmes is invariant. The whole process I have described starts again. This time and again exceptional information is fed back to its proper level of' recursion: the sector or the branch or the minister.
Return with me now for the last time to the vexed issue of 'autonomy. I regard the whole of this work as a fanfare for freedom - but for effective freedom. The claim was made that the degree of autonomy, and its complement the degree of centralisation, are computable functions of viability. I stick to that. By separating the levels of recursion, and within those levels by preserving freedom for each separately designed interlocking homeostat, the maximum autonomy consistent with effective organisation is assured. A problem remains. What happens when, for whatever reason, the appropriate homeostat at the appropriate level of recursion FAILS TO ACT?
Many a freedom must have been lost from the fear of those in power that subservient systems down the line would not do their jobs. And if not, it makes a good excuse for the tyrant. This is a classic and intransigent problem, but we can now deal with it easily - if we keep our cybernetic heads. An autonomous unit is supposed to react to any adverse exception reports that it receives from Cyberstride. How long will that take.and how much does it matter? The answer to both questions will vary widely. In our work we have included in the operational research modelling a requirement to assess the possible rate of reaction to change and the relative importance to the system modelled of such a change, for every indicator. When the computer sends an exception report to a manager, at whatever level of recursion, it computes for the message an acceptable delay time, which is a function of both the possible reaction time and the importance, and it starts a clock. If our quasi-intelligent machine fails to detect an improvement within this allotted time, it breaks with the autonomy and notifies the next level of recursion (as well as telling the responsible manager that it has done so).
These special signals are different in kind from the routine management signals. We call them “algedonic”. The word means pain-and-pleasure and it was work in neurocybernetics that taught me this answer. We rely on our bodily organs to do their jobs, but if they should fail we get a special signal - transmitted by specially adapted neural pathways - that bring the facts to our conscious attention. The mechanism is precautionary. Clearly it involves a threat to autonomy but the body politic cannot sustain the risk of autonomic inaction any more than we can as human beings. And remember that there is nothing covert about this. The delay factors are discussed with the managers concerned, and they are informed if the algedonic signal is transmitted. Indeed they may be very relieved - if the problem is seen as beyond their control - to know that the signal has automatically gone.
16
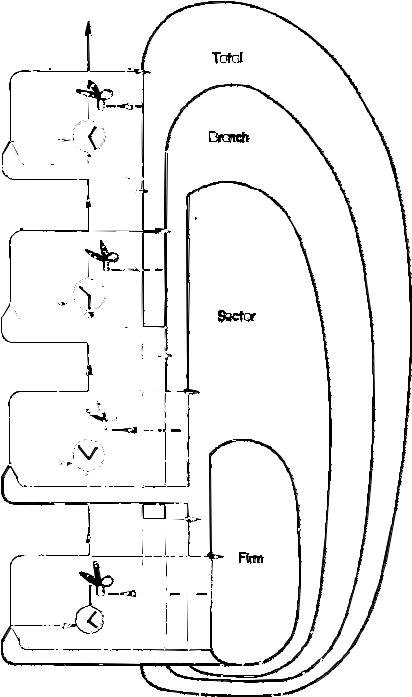
In this way, just as in the body, a sign of special distress automatically breaks through to whatever level is required to deal with it (Figure 8). For if the management group which receives the signal falls to act within its appropriate time delay, the signal will go up to the level next above. Thus the signal makes it possible for a problem concerning that limestone crusher in the cement factory to reach the President’s Economic Control, let us hope that never happens: but it would be surprising if signals of distress were never received there from the Sector level.
Figure 8. Cyberstride operating at four autonomous levels of recursion, with algedonic feedback (see text)
17
THE FACULTY OF FORESIGHT
The real-time control system I have so briefly described is founded on the following elements: A cybernetic model of any viable system,
A cybernetic analysis of the real-life systems appropriate to each level of recursion and their iconic representation;
A design of a large number of interlocking homeostats, the provision of a national communications network capable of operating now on a daily basis and eventually on the basis of continuous input; variety engineering throughout the system to incorporate filtration on the human brain’s scale;
And the Cyberstride computer program suite capable of monitoring inputs, indexical calculations, taxonomic regulation, short-term forecasting by Bayesian probability theory, autonomic exception reporting, and algedonic feedback.
It makes quite a package, and it exists. It represents a system of here-and-now management of the economy that is not based on historical records, but on an immediate awareness of the state of affairs and the protection of that awareness into the short-term future.
Let us call this whole thing the NOW system. Then clearly we also need the FUTURES system. What are we doing all this for? If government is not to be merely the management of perpetual crisis it needs to look ahead. Party-political programmes are supposed to be all about the kind of society the people want and the government is supposed to be dedicated to achieving that. In practice, perpetual crisis drives out mandated intentions. It even happens (dare I say?) that entire sets of electoral policies become reversed when power is granted. This can be only because government has no arrangements for realistic normative planning. It has a political theory but it does not understand the system it is manipulating. It is just laughable to say for example: “the theory is all right but the trade unions (or the City, or the banks, or the people themselves) will not operate the theory”. The unions, the City, the banks, and the people are all elements of the total system that the government claims to be able to govern.
Thus I introduce what I have to say about long-range planning in terms of understanding systems and how they respond: and I do so in deliberate contrast to the many schools of thought that base their conception of inventing the future simply on forecasting it. My objection to that approach is twofold. In the first place I do not believe that we can forecast the future - and that is a fairly strong objection. The future I reckon, is known only to God, and it seems to me that the class of men who have always come nearest to perceiving his intentions are the science fiction writers. They have usually been very close to scientific reality. The people who run society who are famous for being ‘realistic’ and ‘responsible’ turn out to be outrageously irresponsible just because they are so unrealistic. Their unrealism consists in a refusal to notice what science is actually doing and a refusal to think through the inevitable systemic consequences of the politics they underwrite.
These were the reasons why I was determined to provide the Chilean government with an instrument for investigating the systemic consequences of alternative courses of action. For there really are choices to be made. When you read that car prices in Chile have gone up by 900% in a single year, what is your response? Is this the inevitable result of Marxist dogma, is it just what you expect from nationalisation, is it a measure of inflation or what? To whom does it occur that it may be the result of a deliberate choice between economic desiderata? Thus, are we all brainwashed by the consumer society in which the motor car is an absolute good.
The second reason why I object to the forecasting approach to long-range planning is that it assumes that there is a “future” out there lying in wait for us. This is not true, except in so far as larger systems beyond our own - and in which we acquiesce - take a stranglehold on us. I have already suggested that this may doom the Chilean experiment. The real freedom we have is to change our structures and our policies so that the future is different from the future we should have encountered had we not made those changes. And this is where understanding dynamic systems becomes the task. The fact is that we need not to forecast but to experiment.
Experimentation is not easily or perhaps justifiably done when we are talking of social institutions. Scientists undertake social experiments on animal populations, which they try to use as models of human populations-but the discrepancies, may be very wide. Probably the best experimental tool
18
available is the computer simulation. According to this approach, one programmes a computer to represent the dynamic social situation, and then experiments on that. If one asks how such a model could possibly be validated-he learns that the model can be fed with historic data - on the basis of which it ought to simulate the appropriate historic outcome. That is at least a start in a demonstration of validity.
I introduce the topic of dynamic systems simulation in this way, calling it an experimental tool, because I consider there to be a great deal of misunderstanding on the subject. If we experiment on a model putting in possible policies and reading off possible outcomes, then of course we appear to be making predictions. Some people have been causing a great deal of public disquiet with some such predictions about the ecosystemic future of the planet. Personally, I do not mind their doing so - because I believe the public ought to be thoroughly disquieted on this score. But we must make methodological distinctions here. In so far as these models make predictions, it is vital that projections of the input variables be correctly made. There is the rub because specialists disagree quite fundamentally about the trends that have been built into some of those models. Clearly if it is taken as input that fossil fuel will run out by a certain date, then predictions for the ecosystem incorporating this input will be falsified if that date turns out to be wrong. But suppose our objective is not to make predictions but to make experiments to find out how the ecosystem works. That is a different matter. We should put in a whole range of possible dates for the exhaustion of fossil fuel, and find out what difference they made to total performance and by when. After that, we should have a good idea what policy to adopt towards research into novel sources of energy. And that policy would not be the fruit of predictions that might well be falsified, it would be the embodiment of our understanding as to where the system’s vulnerability lies.
My belief is that government planning should be based on this same idea. If we make a dynamic model of the economy, concentrating our power of resolution on the areas in which our decisions appear most unsure or most frightening, then we shall learn how the system operates. The first task is to identify the crucial parameters, which (because complex systems are richly interactive and internally reverberating) are not always the parameters assumed to be critical. It is quite characteristic of cybernetic studies to obtain results that are counter-intuitive. Therein lies their value. The next task is to discover how these parameters may best be manipulated which (because political dealing is a complicated business too) may be in roundabout ways rather than by direct intervention.
What matters about a dynamic system if you want to understand how it behaves, is not so much noticing the sore points themselves, nor resolving the apparently insoluble politics of applying remedies to those sore points - all of which turn out to be unacceptable remedies for some segment of the population. What matters is to change the structure of the system so that homeostatic equilibrium is restored and the sore points disappear. That involves variety engineering: it is likely to mean the redesign of institutions, the addition of informational feedbacks, and the calculated change of time lags in various rates of flow. Economists, perhaps, would not recognise those three cybernetic prescriptions as counting towards the solution of what are regarded as economic problems. But are all our problems economic? I think there is a prior set of problems about the regulation of society (which it falls to governments to solve), which may well have economic causes and consequences, but which are themselves about effective organisation.
Returning to the Chilean story then, we wanted to create a facility for normative planning, suitable for all levels of recursion, embodying dynamic system simulation. Now the task of inventing a fresh computer compiler for this purpose was outside our time-scale. A number of compilers exist, and we chose to use the Dynamo compiler in its latest version (5). The choice was made on the grounds of its elegance and its relatively long existencemeaning that it is very well debugged. The choice has been criticised and will be again - because this is the very compiler used in the work that I referred to as making predictions about the planet using inputs that many ecologists regard as insecure. To me, that is like blaming the pornographic content of a book on the English language in which it is written. My defence of the compiler says nothing about my concurrence or otherwise with ecological predictions any more than hearing my defence of English would tell you my views on pornography.
For the record then, we again formed two teams - one in Santiago and the other in London. These teams were organised differently from the two Cyberstride teams and had no members in common, and this simulation pair operated in a different way. Instead of members of the London team taking program suites out to Santiago to be developed, as happened with Cyberstride, a member of the
19
Chilean team came to London to learn a cybernetic skill. Moreover, whereas all the Cyberstride runs using actual data were undertaken on the Santiago computers the simulation runs for a long time were undertaken on computers in London. In this way dynamic systems models for the Chilean futures system were originally developed, but by now, the whole of the work is being done in Santiago.
There is much that is new about these models. but for obvious reasons I shall not discuss their content. What is worth remarking upon is the status of the information fed into them. As I said just now models of this type are often criticised on the grounds that their inputs are suspect. Now this is not surprising: because, as I also said before, economic information at the national level is usually about a year out of date. But Cyberstride produces information that is immediate. Then there is a question about the interface between the real-time control system and the futures system. If absolutely current information can be used continuously to update our models of the world, a new era dawns in national planning. Well, at any rate it happens just like that in the brain. We should indeed be foolish to choose between the alternatives open to us as men on the strength of knowing what our circumstances were like last year.
A DECISION MACHINE: THE OPS ROOM
And now we reach the final question, How do we ‘get it all together’. How is so much sophisticated science to be made available to those who bear the brunt? In most countries this is a function for the civil service. Those people constitute the ultimate filter. The ministerial briefing stands, however, responsibly, between the minister and all those urgent facts of the NOW system, all those experiments in foresight of the FUTURES system.
I wanted ministers to have a direct experience, an immediate experience, an experimental experience. And what goes for ministers goes also at another level of recursion for managers -whether the managers of the social economy or (at yet other levels of recursion) of enterprises or of plants. Above all, if “participation” has any meaning, no one must be disbarred because of an inadequate grasp of jargon, of figure-work, of high-level rituals. As I have told you before, the workers themselves must have access to the whole of this. Let me put the point before you in two contrasting ways.
When I first expounded the cybernetic model of any viable system (which I have not expounded today) to President Allende, I did so on a piece of paper lying between us the table. I drew for him the entire apparatus of interlocking homeostats in terms of' neurophysiological version of the model - since he is by profession a medical man. It consists of a five-tier hierarchy of systems. I worked up through the first, second, third and fourth levels. When I got to the fifth I drew an historionic breath - all ready to say “And this, companero presidente, is you”. He forestalled me “Ah” he said with a broad smile as I drew the topmost box: “at last - the people”.
I do not care what political outlook any of us may have: that story ought to convey a profound message. It deeply affected me, and it affects this work. The second perception of the same point that I give you comes from that Litany written by the folklore singer Angel Parra, which I quoted at the outset. This is what his song says on the subject (my translation):
Equal I say to the Minister
Selling promises forlorn
Since all of us are hostage
For that baby to be born.
Society can no more afford the alienation of the people from the processes of government than it can afford their alienation from science.
And is this really a political question any more once we say that all of us are men? The fact is that no man, worker, or minister has more neurological jelly-ware than anyone else - although he may make marginally better use of his endowment. We have seen how that man, minister, or worker, can be saved from drowning in an inundation of statistics and reports - through variety engineering and the deployment of computers as quasi-intelligent machines. But how does the filtered information get into his head?
20